EventSources, the sister LogicModule to DataSources, are a useful framework for triggering event-based, contextual alerts from your applications and infrastructure. While DataSources poll your applications and infrastructure for time-series datapoints, EventSources poll (or listen) for interesting events from your log files, SNMP traps, syslogs, Windows Event Logs, and much more. LogicMonitor provides over a dozen EventSources out-of-the-box for common use cases, but building your own Script EventSource can enable alerting for interesting events from a much wider range of sources.
What Are Interesting Events?
If you’re looking to monitor traditional, time-series datapoints like CPU utilization, memory utilization, or latency, DataSources are for you. LogicMonitor provides thousands of DataSources out-of-the-box for common IT vendors and products, each of them rich with interesting datapoints and pre-set alert thresholds.
What if your monitored application exposes interesting events, such as all severe alarms occurring recently, or a specific ID/string in events that you need to know about? What if these events occur infrequently but contain important, contextual information describing what is happening? This is where EventSources come in, triggering alerts in LogicMonitor when an interesting event occurs.
In this article, we’ll walk through how to build customized Scripted EventSources to monitor and alert interesting events exposed from a simple HTTP URL and a REST API.
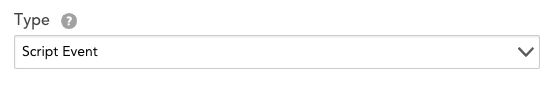
Script EventSources
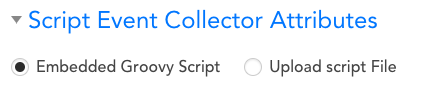
Script EventSources are capable of running any script on your Collector, either as embedded Groovy or as any other external script (Python, Ruby, PowerShell, etc.) that’s supported by your Collector’s operating system.
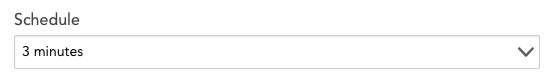
The EventSource is configured to execute the script on a Schedule, as frequently as one minute to as infrequently as one day.
With a Script EventSource, you can generate contextual alerts from countless sources, such as your application’s REST API or from a simple HTTP GET Response. Generally, your script will need to do the following, regardless of the language you write it in:
- Authenticate with the source
- Query for any new, interesting events since the most recent / last poll
- Output the events (after iterating through them) to standard output using the following JSON format:
{
  "events": [
    {
      "severity": "warn",
      "happenedOn": "Thu Jun 01 09:50:41 2017",
      "message": "this is the first message",
    },
    {
      "severity": "warn",
      "happenedOn": "Thu Jun 01 09:50:41 2017",
      "message": "this is the second message"
    }
  ]
}
Your script will need to output three important attributes for each event that it identifies:
- LogicMonitor alert severity (warning, error, or critical)
- A timestamp of the event (numerous formats supported)
- The unique message of the event
The Collector will then process the newly-output events JSON and trigger an alert for each event within your LogicMonitor portal.
Now let’s look at how to configure a few practical, real-world use cases.
Use Case 1: Slack Events
If you manage Slack at your company and have ever browsed Slack’s Status page, you may have seen the occasional incident. With the out-of-the-box Slack Events EventSource, you can easily add Slack to your LogicMonitor portal and begin triggering alerts for when the next incident occurs.
- Import the Slack Events EventSource to your portal from core (if not already in yours) – this LogicModule is considered core to our product and provided out-of-the-box.
- Add a Slack Device to your Resources tab, using any hostname you’d like. For this example, you can use system.hostname = “status.slack.com”
- Append “SlackService” to system.categories property of the Device. This tells LogicMonitor to apply the Slack Events EventSource to this Device.
- Review the embedded Groovy Script and you’ll notice what is happening:
- Authenticate – this information is exposed with a very simple HTTP GET call to Slack’s API. No authentication required!
- Query – the call is made to https://status.slack.com/api/v2.0.0/current using Groovy’s URL class:
def endpoint = "https://status.slack.com/api/v2.0.0/current"

def slackStatus = new JsonSlurper().parse(new URL(endpoint))
The response is raw JSON containing the current incidents, which shows there are currently none (click the API URL above in your browser see it live):
{"status":"ok","date_created":"2020-05-07T21:55:17-07:00","date_updated":"2020-05-07T21:55:17-07:00","active_incidents":[]}- Output – to output each incident, we do the following:
- Iterate through all of them with slackStatus.active_incidents.each to create a Groovy map (outMap) with each event appended
def outMap = ["events": []]- Generate a current timestamp on the Collector with the now.format() method
def outMap = ["events": []]- Generate a current timestamp on the Collector with the now.format() method
def now = new Date()
def tz = TimeZone.getTimeZone('PST')
def dateFormat = "yyyy-MM-dd'T'HH:mm:ss"
def nowPST = now.format(dateFormat, tz)- Print the incidents to standard output by converting outMap to JSON and printing to standard output:
def jsonOut = JsonOutput.toJson(outMap)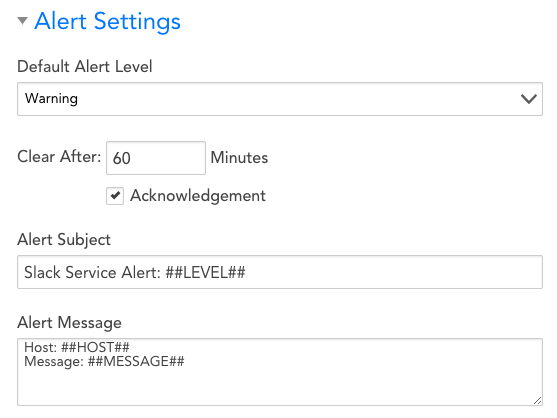
println JsonOutput.prettyPrint(jsonOut)- Finally, you can now customize other Alert Settings of the EventSource such as:
- Default Alert Level – the script will automatically categorize the Slack incidents to Warning, Error, and Critical, but Warning is used here regardless.
- Clear After – because these are event-based alerts, you’ll need to specify how long the alert will last in LogicMonitor before cleared. The default is 60 minutes.
- Alert Subject and Message – customize the subject of and message of alert notifications, if necessary.
In summary, this EventSource will query Slack’s status page every three minutes looking for incidents and subsequently triggering an alert once one is found.
Use Case 2: LogicMonitor Audit Logs
Have you ever wanted to trigger an alert on an interesting activity in your LogicMonitor Audit Logs, such as when a LogicModule is updated or a specific user is active in your portal? By using a Script EventSource, the LogicMonitor REST API, and unique search strings inside Resource Properties, you can setup LogicMonitor to trigger alerts when specific events occur in your portal.
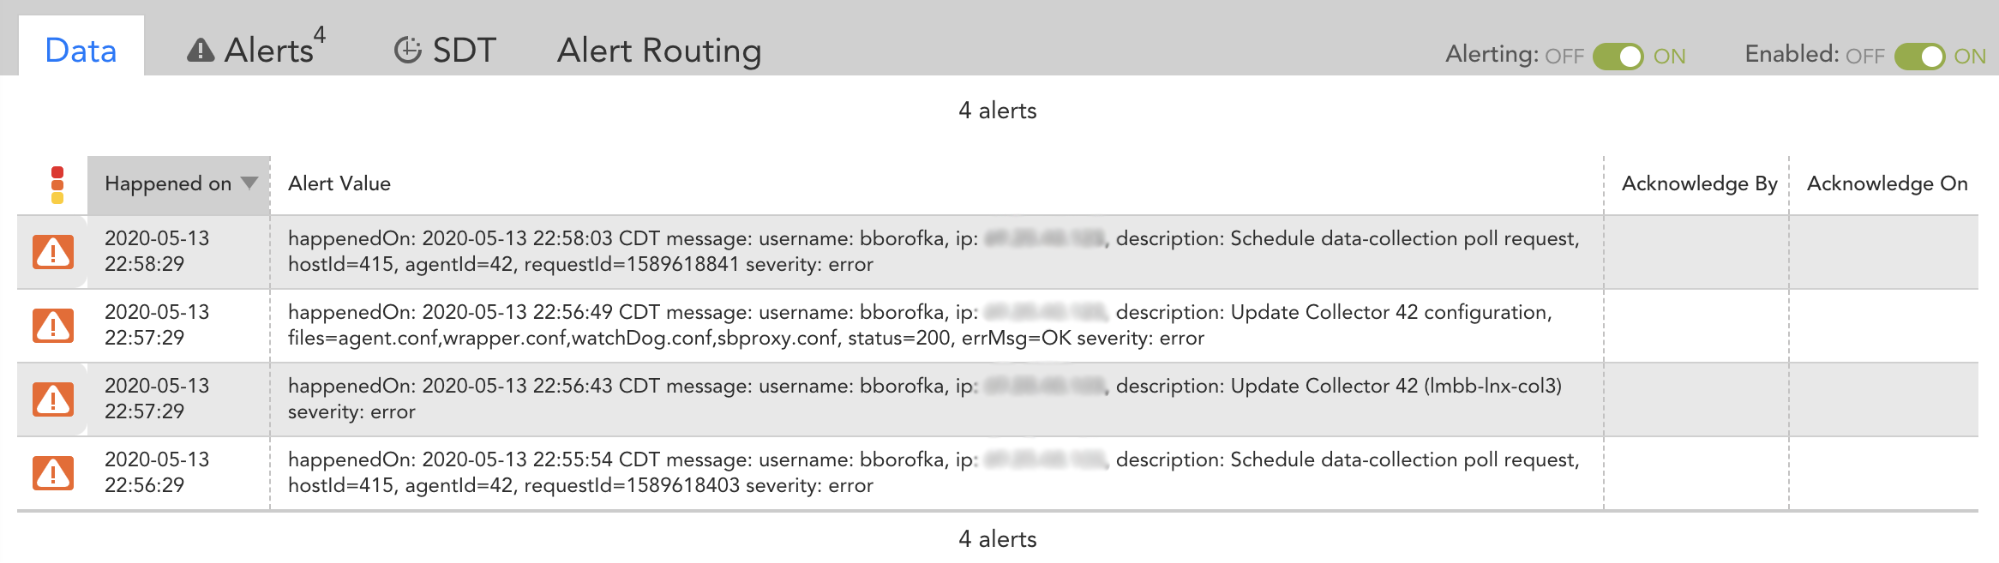
In this example, we will create the Script EventSource to query for new Audit Logs occurring within the past 60 seconds, polled every minute. We will then generate Error alerts whenever the username (bborofka) has activity within the portal.
1. Add a Device representing your LogicMonitor portal, with a hostname “<portal>.logicmonitor.com”. Your Collector will monitor the portal’s REST API using this hostname.
2. Configure a User account with (at least) access to Settings – Access Logs, which can be an API-only service account. Create an API Token for this User and save it somewhere secure.
3. In the Resources tab, under your Device’s Info tab, add the API token details as lm.access.id and lm.access.key properties.
4. Here you will also want to add a property for the search string to trigger alerts for. In this example, we will use the property lm.auditlogs.error with the value bborofka, which will trigger Errors for any time “bborofka” is found anywhere within a new Audit Log:
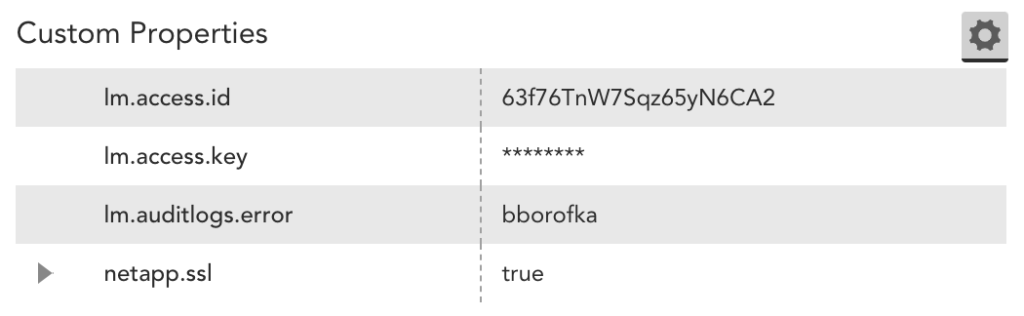
This property will be used as a search string across all Audit Log information/columns (User, IP and Description):
5. Now, let’s create a new Script EventSource. You can add the LogicMonitor_Audit_Logs EventSource to your portal from our Community post here. This EventSource is provided as a public, Community LogicModule and not part of the core LogicMonitor platform.
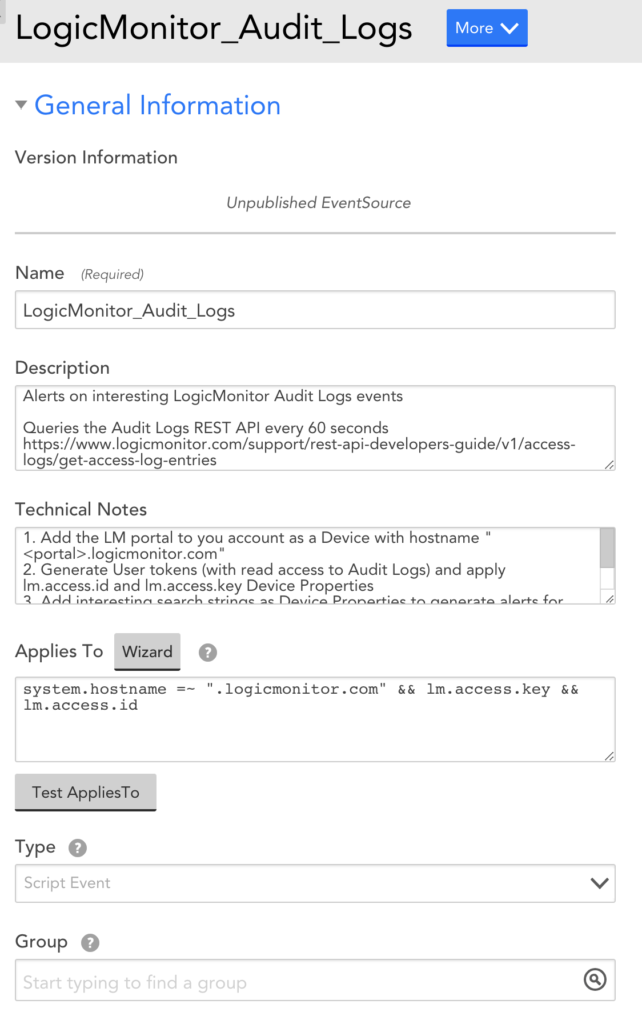
6. In the EventSource’s Groovy script, we start by retrieving all of the Resource properties you applied previously to use as variables:
// *** Get LM Device Properties
def accessKey = hostProps.get("lm.access.key")
def accessID = hostProps.get("lm.access.id")
def eventWarn = hostProps.get("lm.auditlogs.warn")
def eventError = hostProps.get("lm.auditlogs.error")
def eventCritical = hostProps.get("lm.auditlogs.critical")
def hostname = hostProps.get("system.hostname")
7. Because this EventSource will be configured for a one minute schedule, you will only query for Audit Logs within the past 60 seconds. To do this, you will need to generate epoch timestamps on the Collector for both current time and 60 seconds ago. Epoch timestamp is also used for setting up authentication to the LogicMonitor REST API:
// *** Get current time (now - 60s)
def epochCurrentSeconds = System.currentTimeSeconds()
def epochPreviousSeconds = epochCurrentSeconds - 60
def epochCurrentMillis = System.currentTimeMillis()
8. Now you will generate the REST API base URL, endpoint, and query parameters. Using the two epoch timestamps above, these will both be used in the Audit Logs API query parameters to retrieve only Audit Logs within the time window (using the happenedOn>: property). Many other application REST APIs also support restricting time windows using timestamps or epoch, refer to documentation to find if your application allows this:
// *** Setup URL
def baseUrl = "https://" + hostname + "/santaba/rest"
def endpoint = "/setting/accesslogs"
// "happenedOn>:" set filter to only grab Audit Logs after a designated epoch timestamp
// Query parameters already URL-encoded in this string
def queryParams = "?filter=happenedOn%3E%3A" + epochPreviousSeconds + "&size=1000"
def apiUrl = baseUrl + endpoint + queryParams
9. Next you will setup your LogicMonitor REST API authentication and make the query using HTTP GET to retrieve all Audit Logs within the past 60 seconds (note that the CloseableHttpClient section, and onwards, are encapsulated in a try / catch block in the actual EventSource in order to allow for more graceful error handling and exiting). The LogicMonitor_Audit_Logs EventSource borrows from our Support Center Examples for using HTTP GET with our REST API.
10. Now is the fun part. You will use Groovy’s JsonSlurper class to parse the HTTP response body, convert it to JSON and create a Groovy map to append events to.
// *** Parse LM Audit Logs JSON
def jsonSlurper = new JsonSlurper()
def auditLogs = jsonSlurper.parseText(httpResponseBody)

// *** Create a map for standard output
def outMap = ["events": []]
11. Iterate through the retrieved Audit Logs (if there are any). Use the search strings (eventWarn, eventWarn, eventCritical) brought in earlier from Resource properties to find if there is a match within any of each Audit Log’s three fields: description, username, and ip. If there is a match, you will append the Audit Log to outMap:
// Search Audit Log for matching pattern for Warning property, lm.auditlogs.warn
        if (description =~ eventWarn || username =~ eventWarn || ip =~ eventWarn) {
            def event = ["happenedOn": auditLog?.happenedOnLocal,
                            "severity": "warn"]
            def message = "username: " + username + ", ip: " + ip + ", description: " + description
            event.put("message", message)
            outMap.events += event
        }
12. Then you will print the alerting Audit Logs by converting outMap to JSON and printing to standard output:
// Convert the map to JSON and print to standard output
def jsonOut = JsonOutput.toJson(outMap)
println JsonOutput.prettyPrint(jsonOut)
return 0
13. Finally, set the EventSource Schedule to one minute and Save.
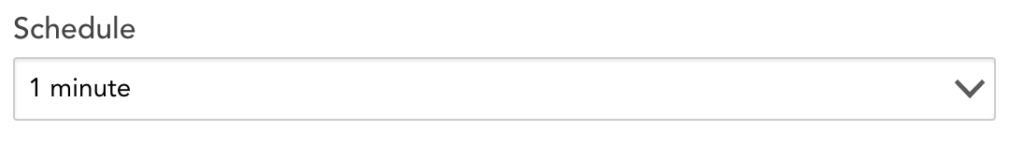
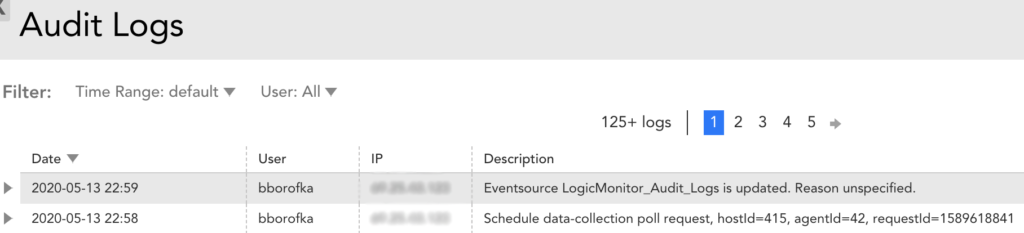
That’s it! Now when a user account “bborofka” takes any action within the LogicMonitor portal, Errors will be triggered with contextual information about the alert within the Alert Value field:
Custom Monitoring With LogicMonitor
These use cases cover just a couple examples of how to use Script EventSources to creatively fetch and alert interesting events from applications’ HTTP URLs and REST APIs. If your application has a documented REST API, you may find useful event information that is exposed and retrievable by authenticating, querying, and outputting the event to trigger alerts by a custom EventSource.
LogicMonitor Professional Services delivers custom LogicModules (such as EventSources) for customers that are tailored to their requirements. If you have a complex or custom monitoring need that you need our help in building, contact your Customer Success Manager for more information about scoping and pricing.