In this article


LogicMonitor’s current monitoring coverage for VMware’s vCenter is best-in-class: from a single device in your portal, you can see every component of your virtual environment and their respective performance metrics: hosts, clusters, virtual machines, resource pools, datastores, virtual switches, networks, snapshots, and more.
In practice, this means that after you add in your vCenter’s hostname and ESX credentials, LogicMonitor’s collector will immediately begin collecting, displaying, and alerting on these metrics. With LogicMonitor’s newly-released VCSA DataSources, LogicMonitor’s vCenter monitoring coverage continues to expand.
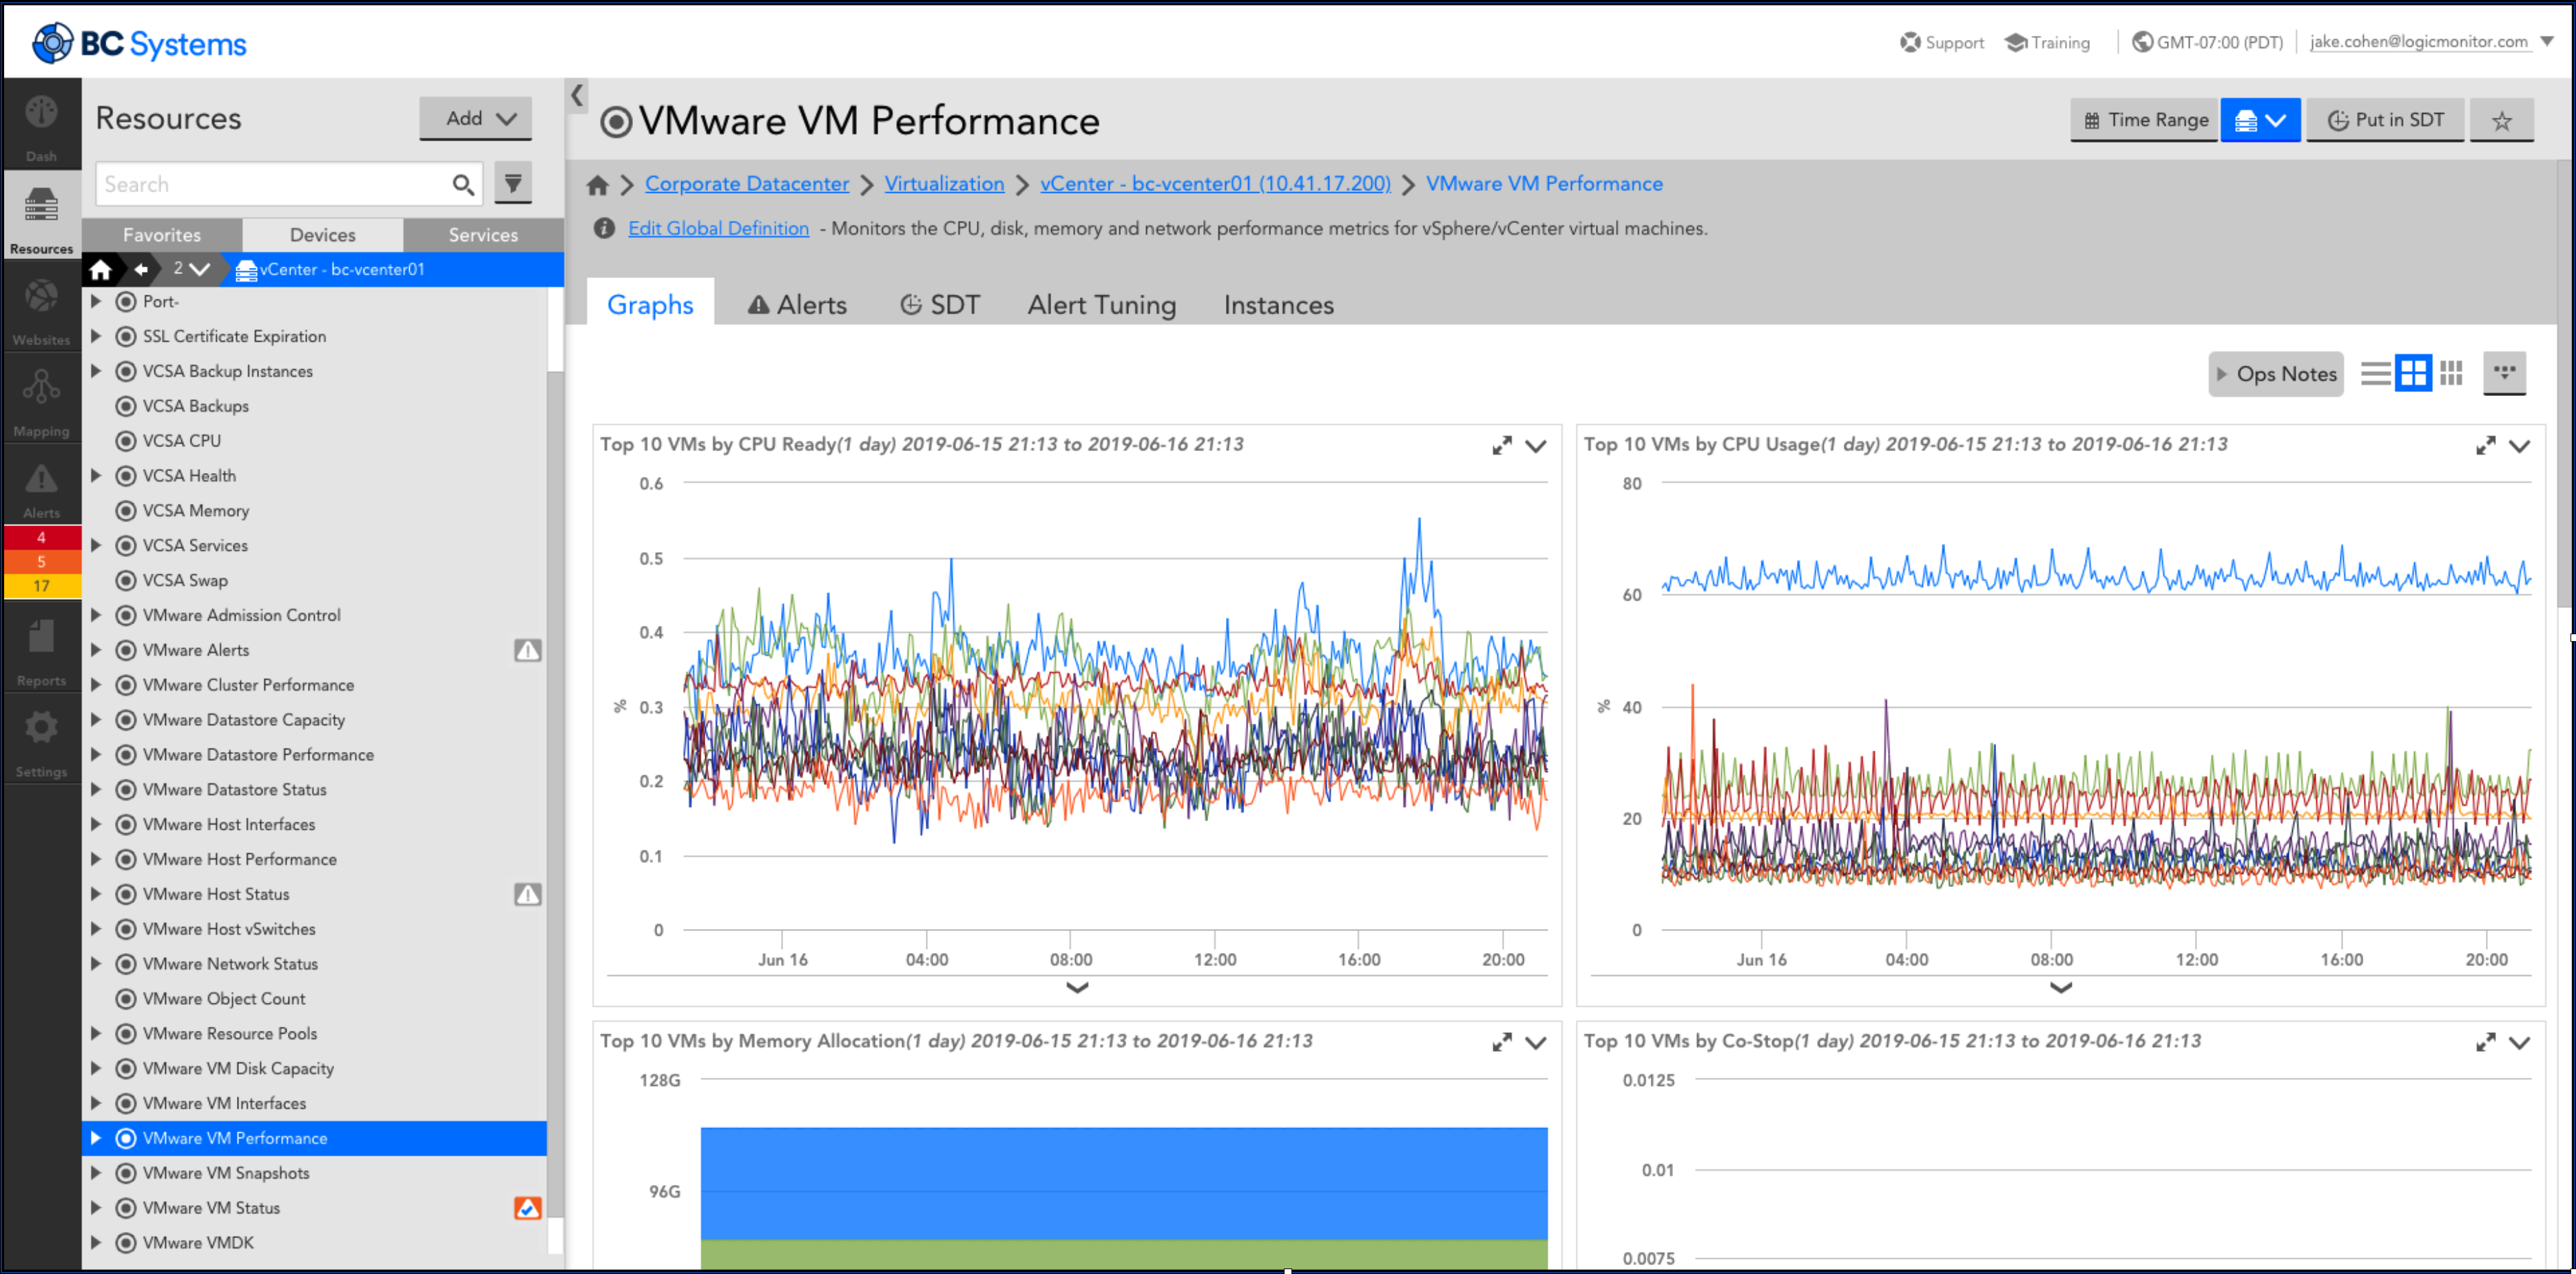
Though the above method is quick and provides you high-level insights into your virtual-machine’s performance, due to the structure of the vSphere API, LogicMonitor can not provide OS and application statistics on the vCenter device.
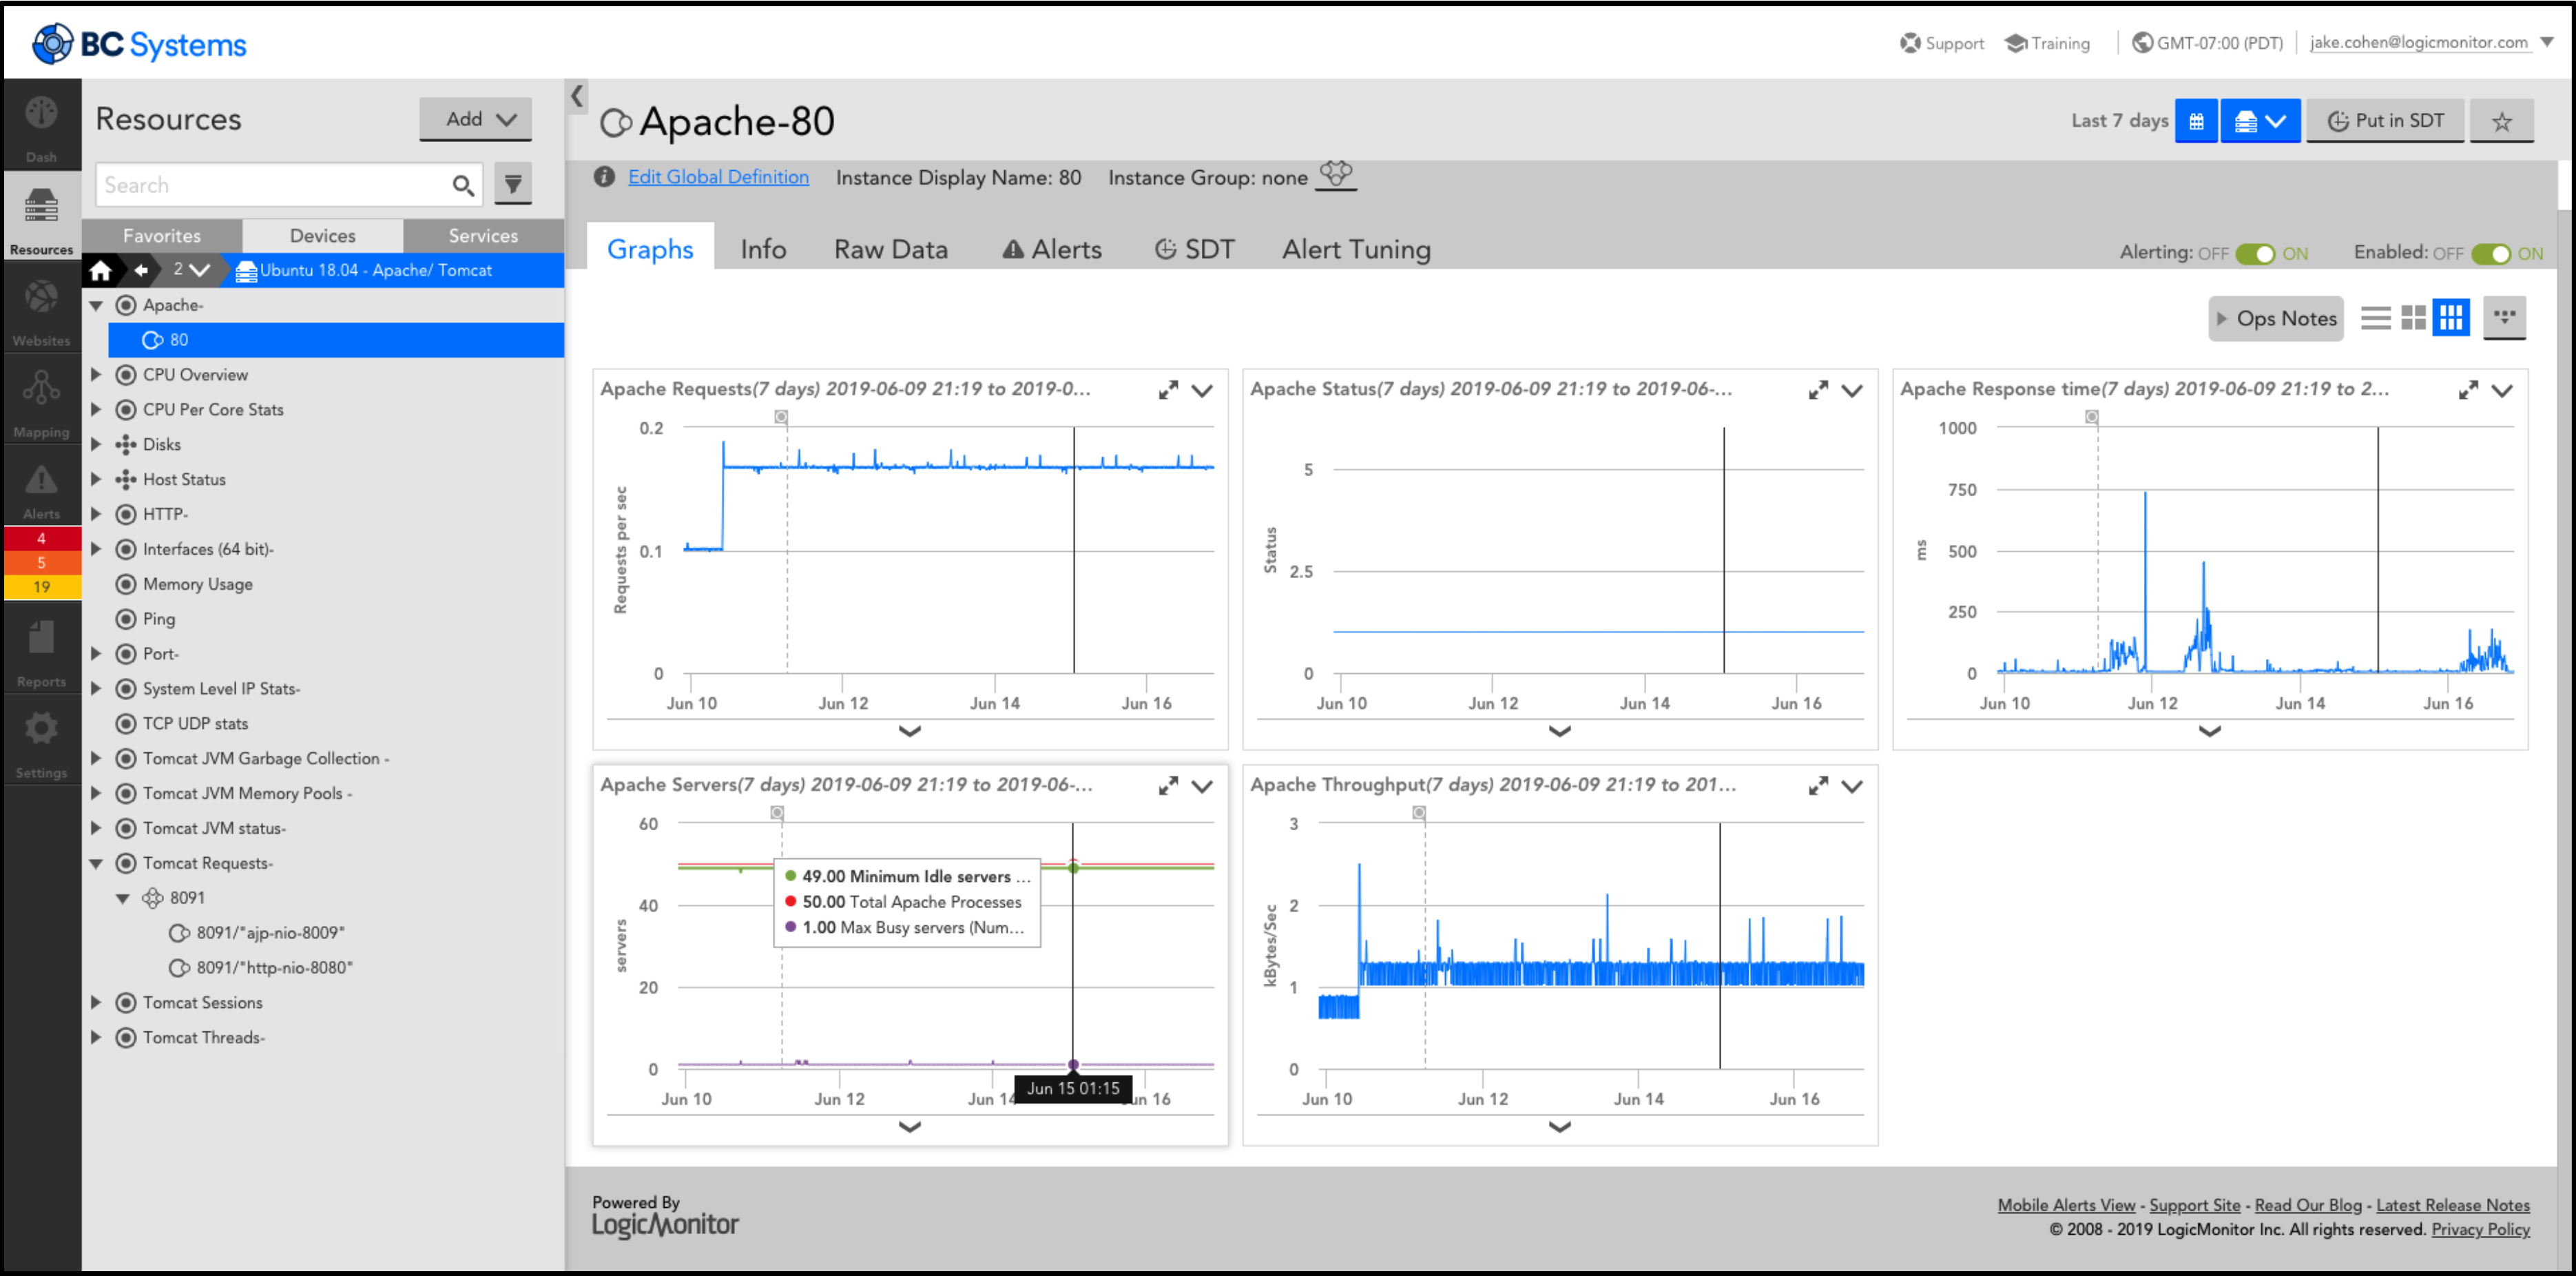
In order to gain visibility into OS and application-level metrics, VM’s need to be added into LogicMonitor as independent devices. This process is rather straightforward as well: add in your virtual machine’s hostname and SNMP or WMI credentials (depending on whether you’re running Linux or Windows respectively), and again, you will have metrics at your fingertips within minutes:
If you’re running a large vCenter, perhaps with hundreds or thousands of virtual machines, you’re going to want to introduce as much automation as possible into the mix.
On a related note, many users leverage the foldering structure within vSphere to organize their Virtual Machines. With these points in mind, we wrote two DataSources that aim to improve operational-efficiency and time-to-value.
The first DataSource automatically brings all of your virtual machines into monitoring so that you have visibility into the OS and application-level statistics. Much like LogicMonitor’s LM-Cloud product, which allows you to filter resource discovery based on AWS Tags, this DataSource allows you to filter which virtual-machines are brought into this “comprehensive” monitoring using vSphere “Categories” and “Tags,” or by the virtual-machine’s name.
Perhaps you have an “Environment” category, and you only want comprehensive monitoring on the “Prod” virtual-machines in that category. This is accomplished easily by adding the “vcenter_integration_tags_include” property to the vCenter device in your LogicMonitor portal shown below:
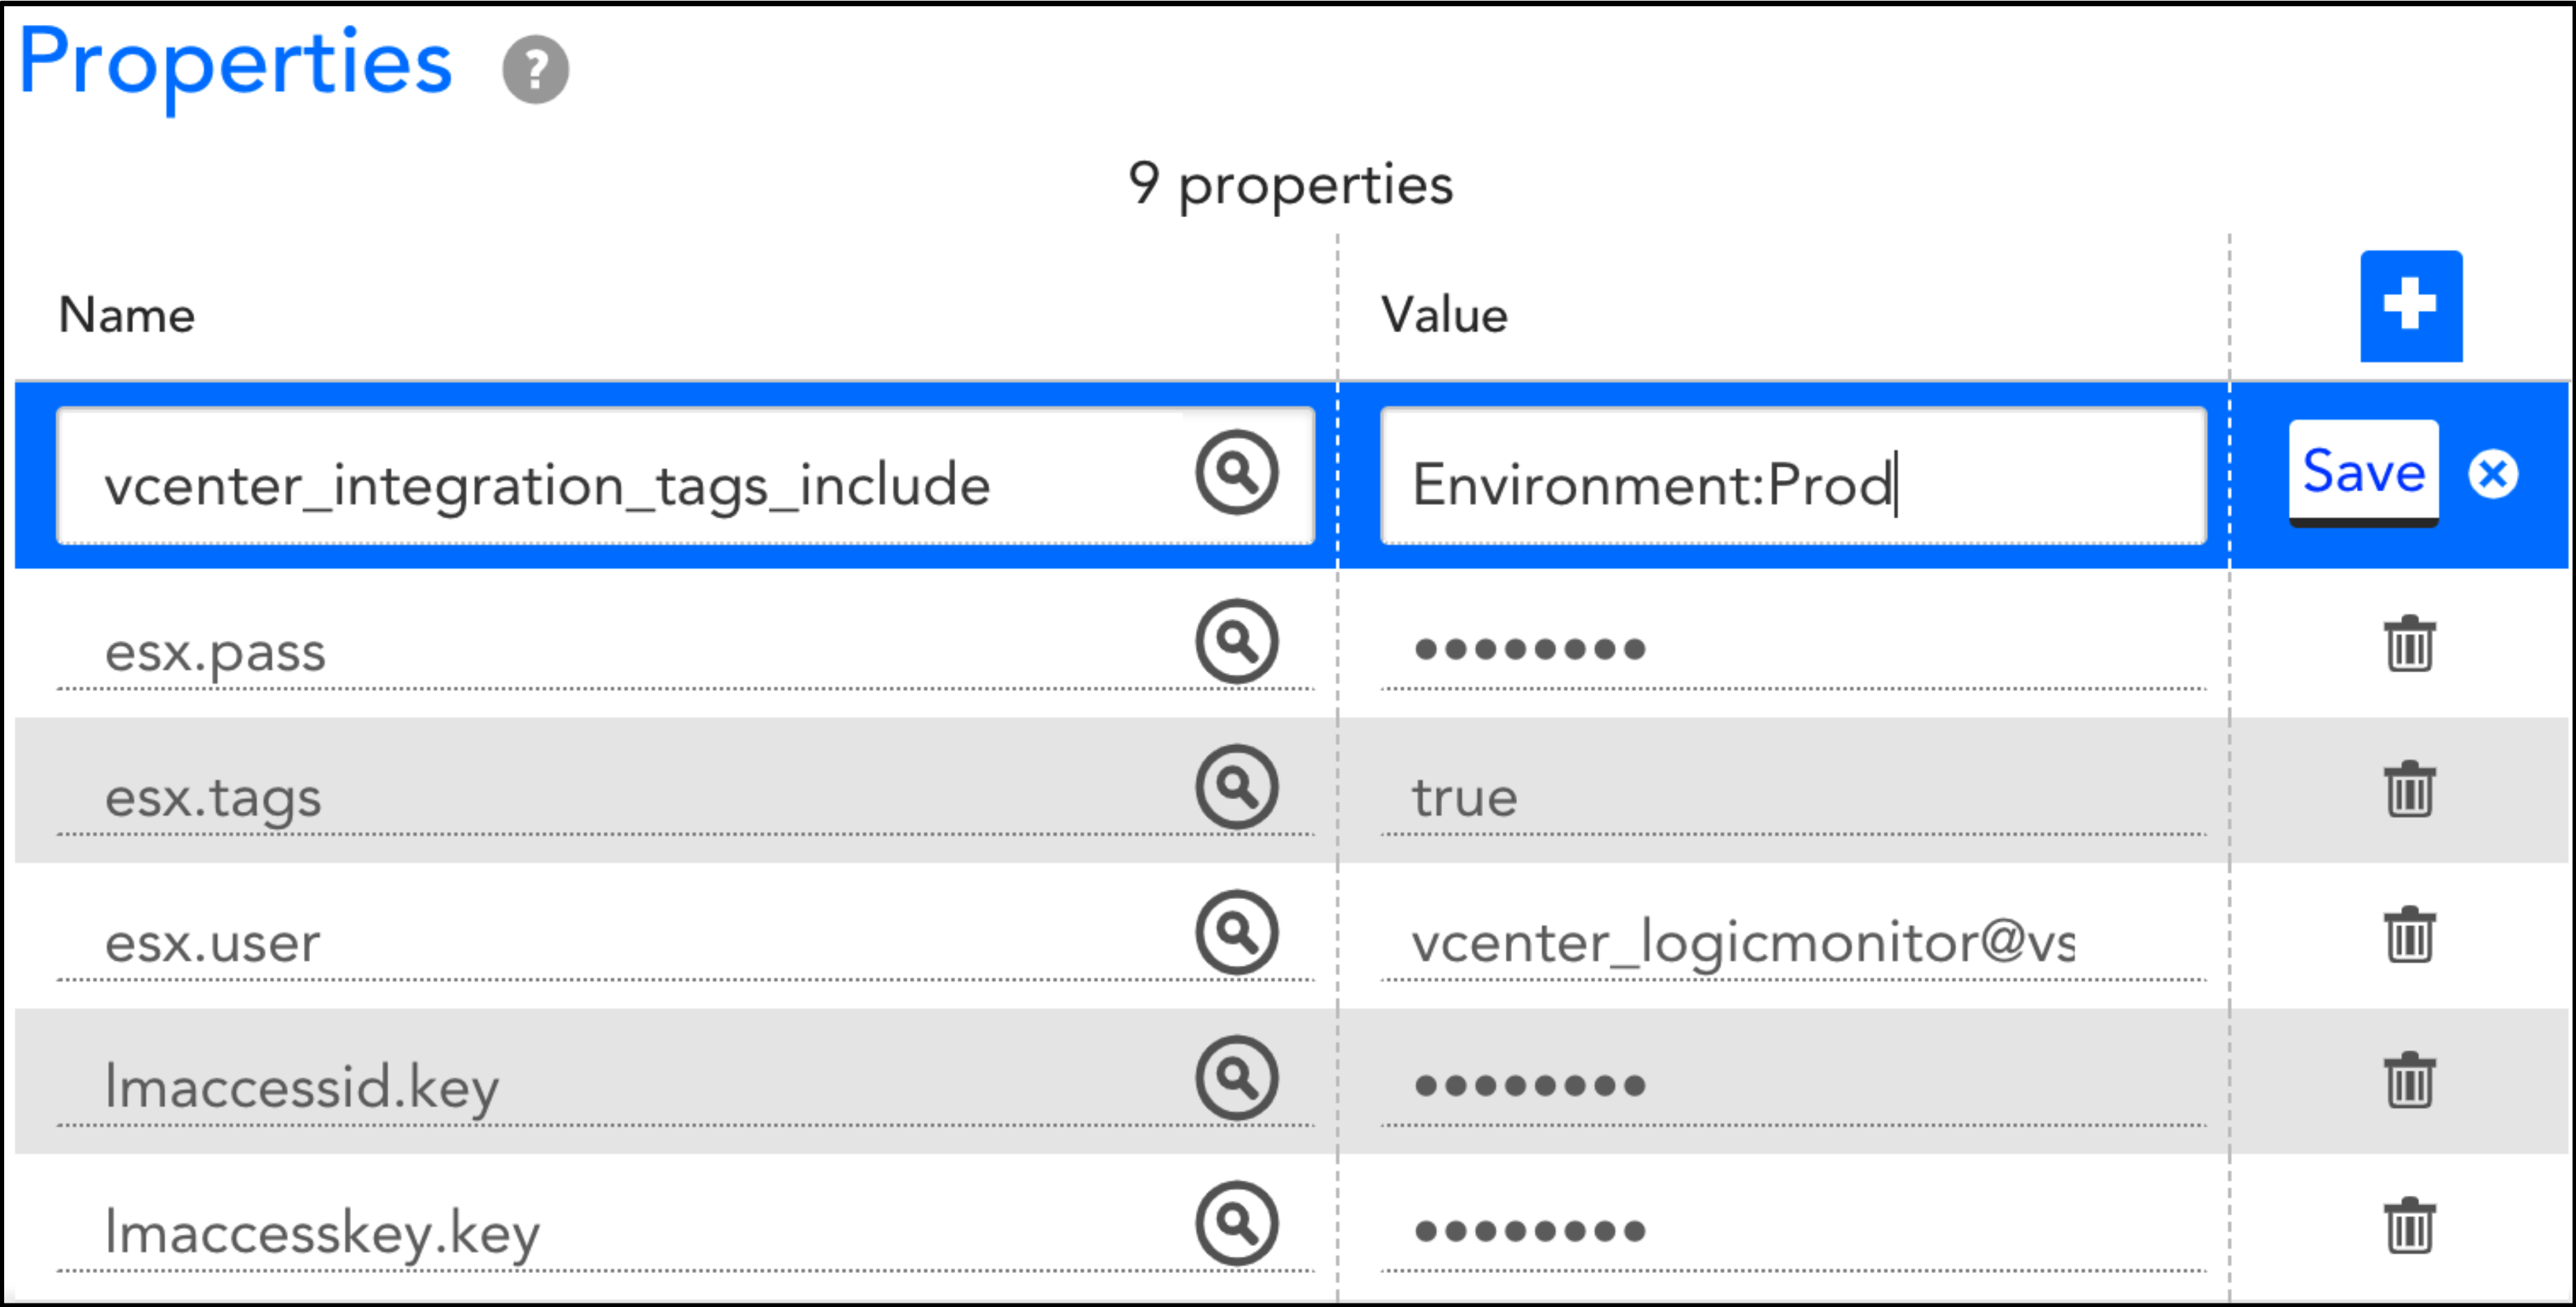
Note that you can add multiple categories and tags by adding comma-separated category and tag pairs (e.g. Environment:Prod,Project:TimeMachine).
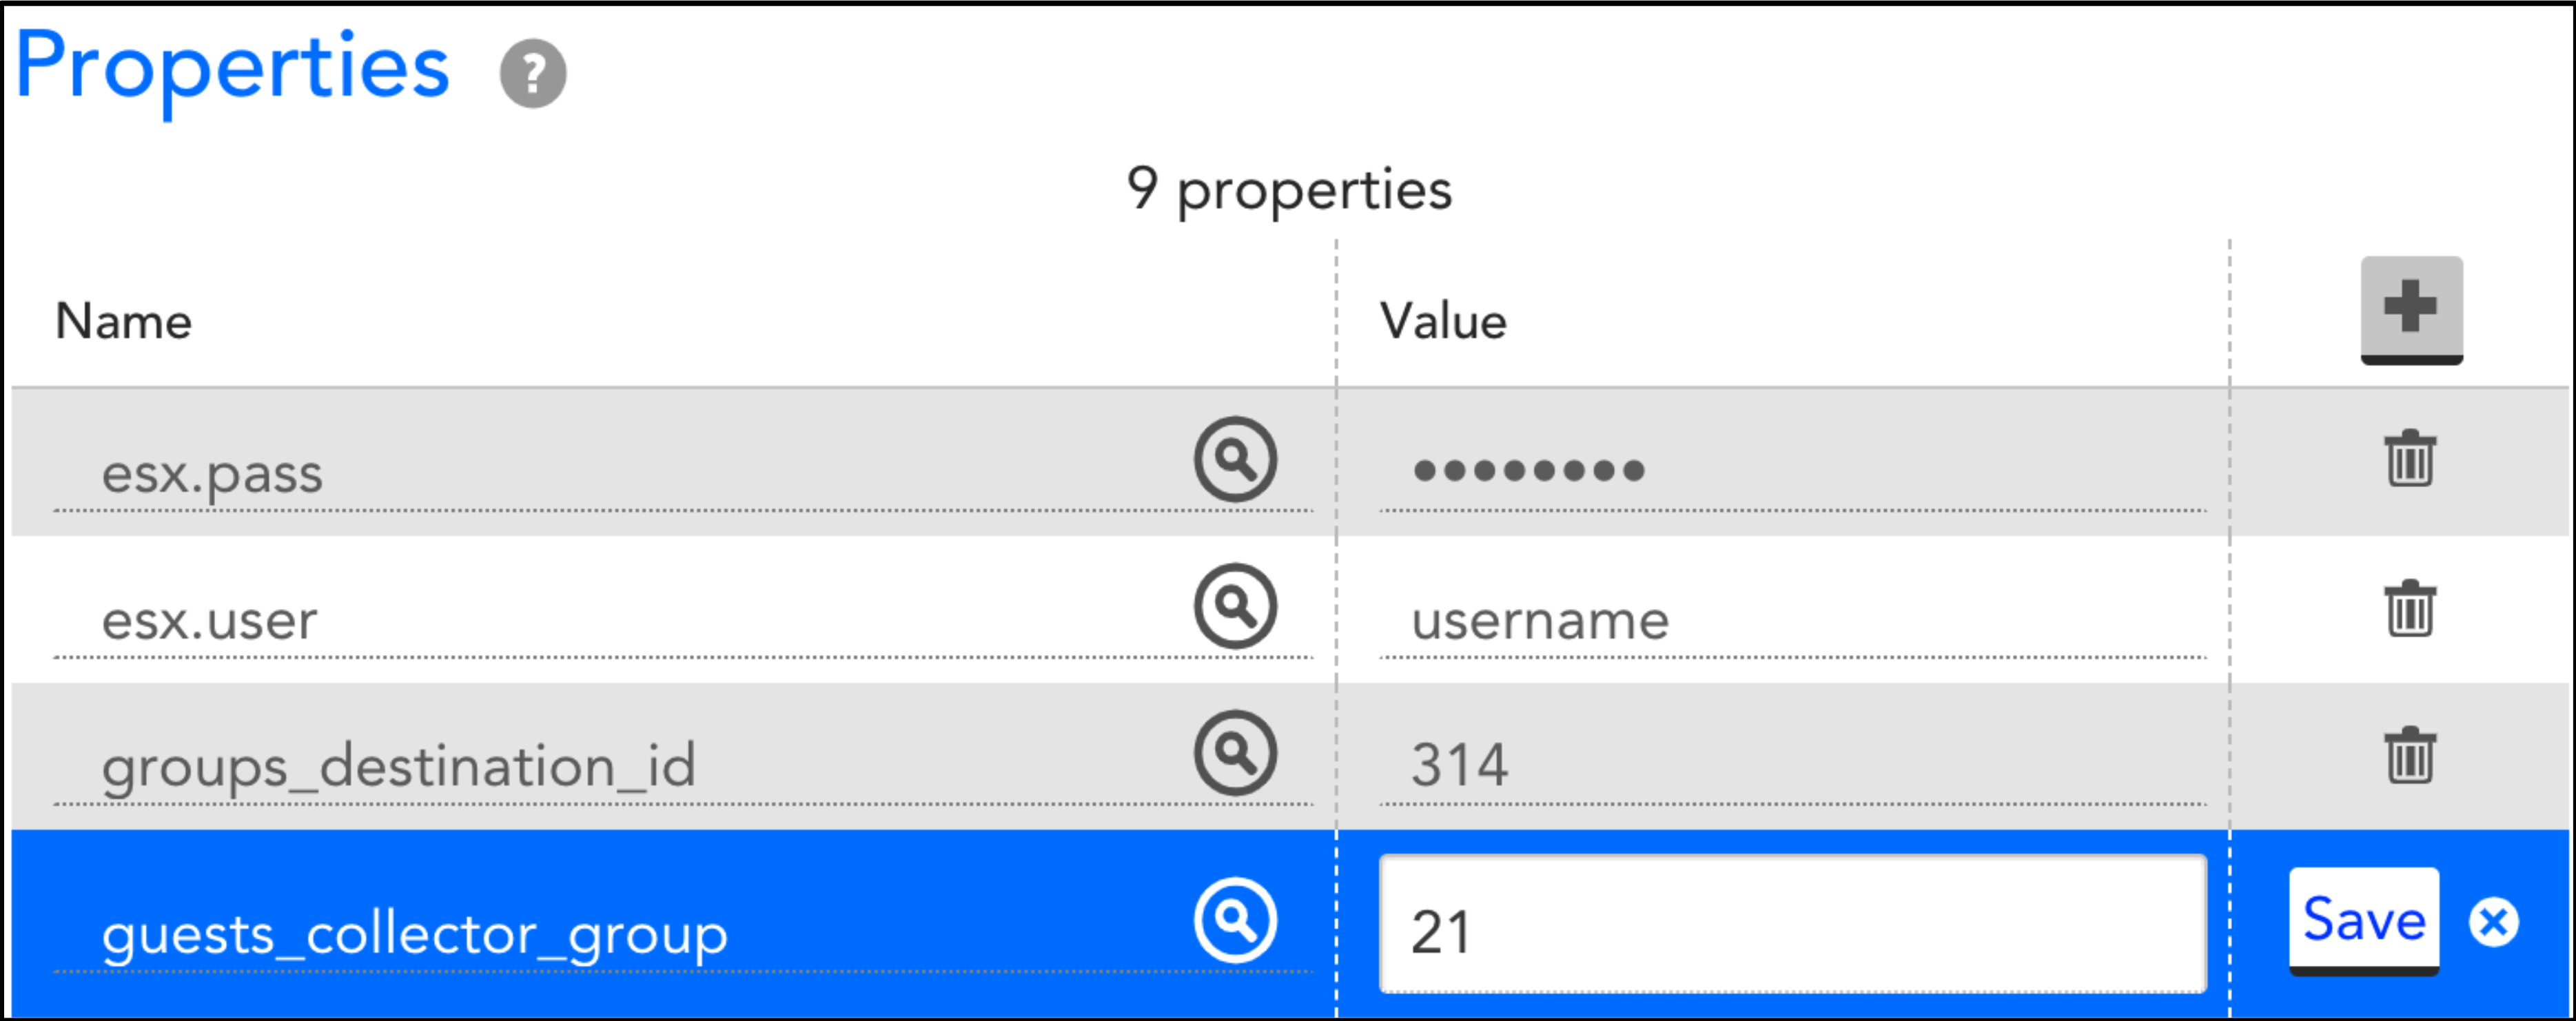
This DataSource can optionally take advantage of LogicMonitor’s Auto balanced Collector Groups (ABCG), so that you don’t have to worry about collector-load if you have a large number of virtual machines that you want to add into comprehensive monitoring. After configuring an ABCG, simply add the “guests_collector_group” property with the Collector Group ID as the value, show below:
Similar to LM-Cloud, this DataSource will check every 30 minutes for any new virtual machines and will add those into monitoring as well:
You can download the DataSource directly here, and the documentation for setup here.
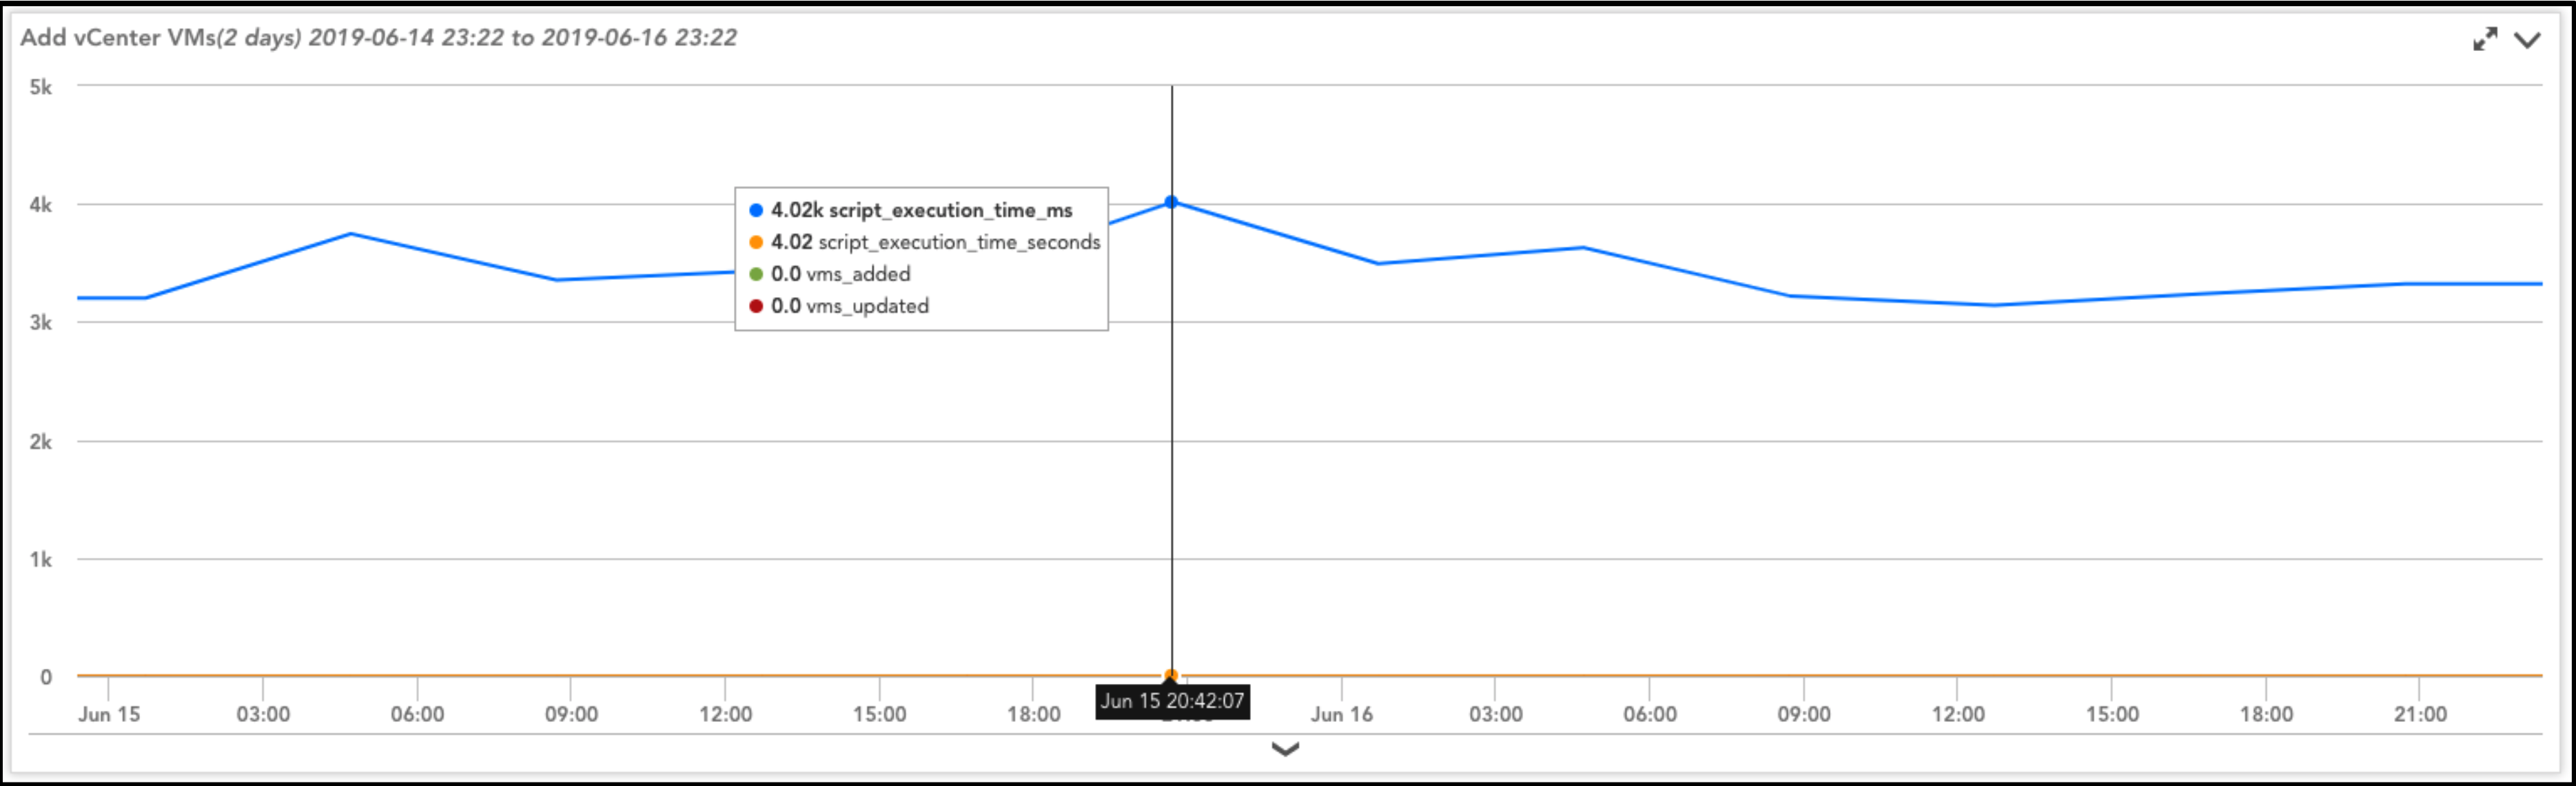
The second DataSource in this solution automatically creates (and updates) your vCenter folders in the LogicMonitor resource-tree. As these are dynamic-groups in LogicMonitor, the virtual machines added into your portal will appear in their corresponding folders. Updates to your groups and virtual-machines in vCenter, such as renaming groups or moving VMs between groups, will be reflected in LogicMonitor. This means that you can manage your virtual-environment structure in vSphere and align your monitoring operations with this structure.
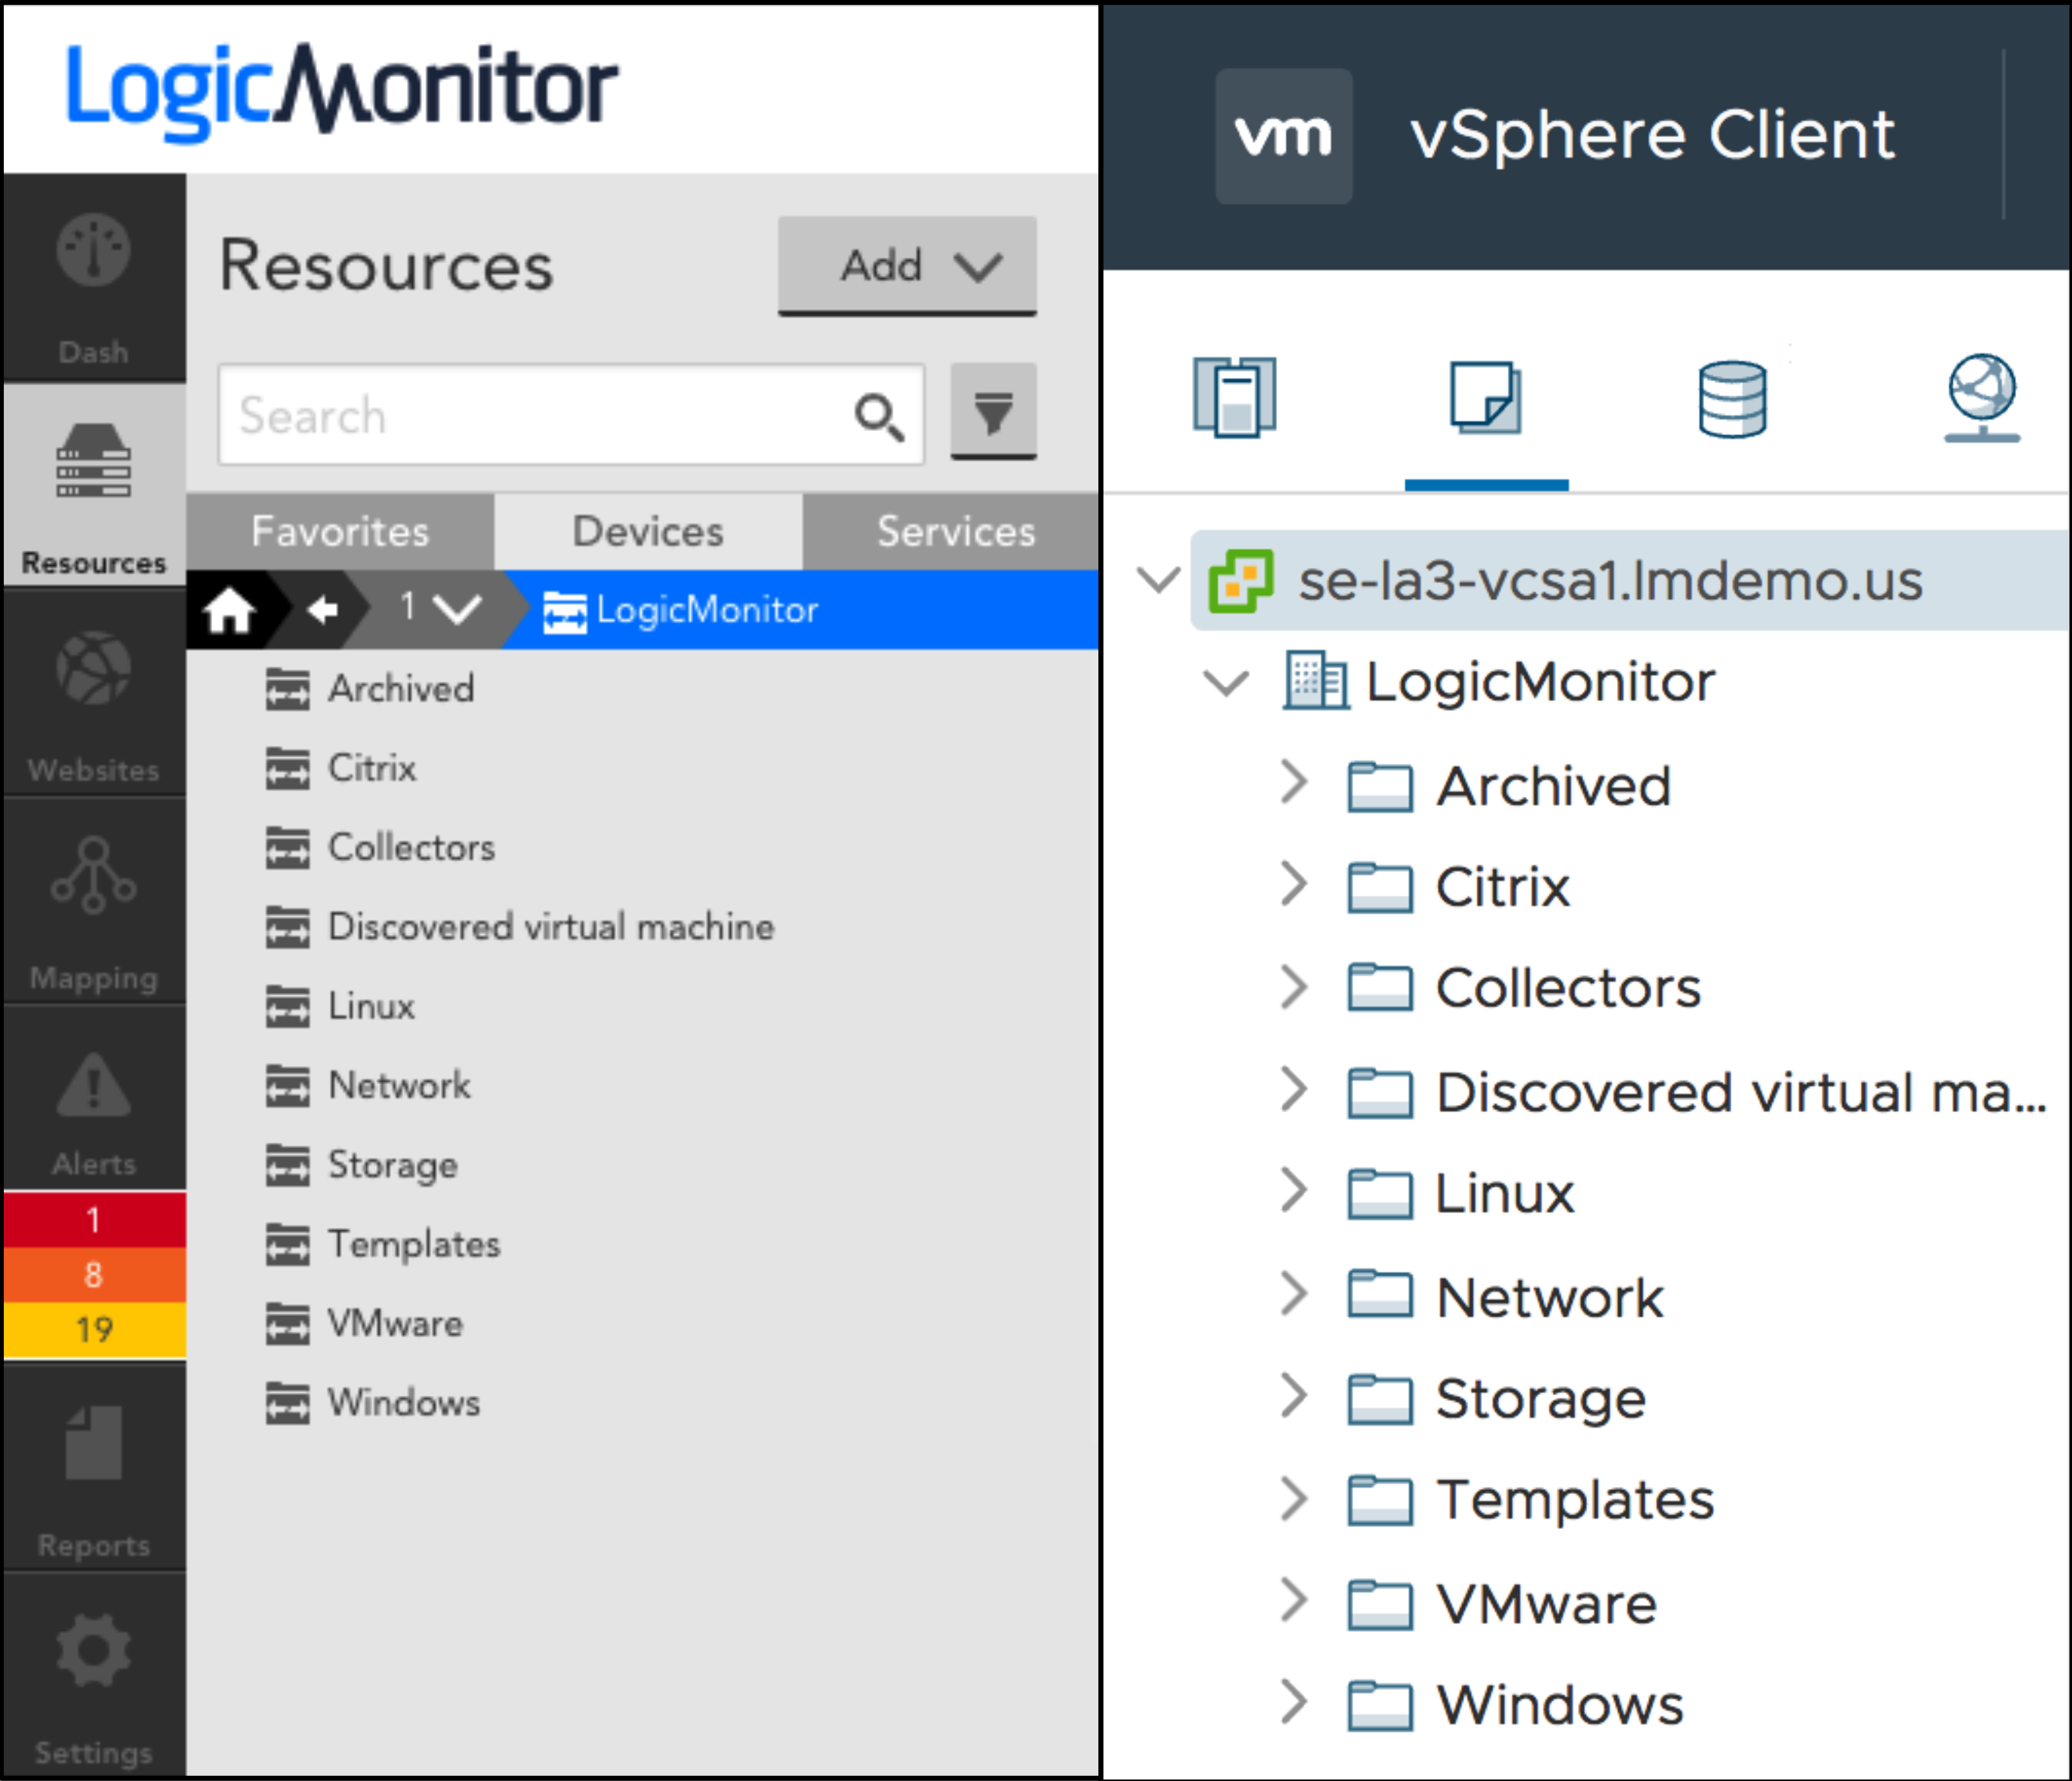
One customer recently used this solution to bring over 1200 virtual machines and over 300 device-groups into monitoring in a matter of minutes. This DataSource can be downloaded here, along with documentation here.
There is intuitive value in using both of these DataSources in tandem with one another: decreased time-to-deployment, keep your LogicMonitor and vSphere environments aligned with one another, and improve operational efficiency by managing your grouping structure in just a single portal. That being said, these DataSources were intentionally developed to operate independently. You can, therefore, choose to apply either DataSource without the requirement of using the other.
Looking ahead, we’re always investigating avenues to improve operational efficiency and time-to-value. If you have ideas on how to improve this vCenter integration or other LogicMonitor modules, please share them on our Communities Forums!
Have questions? Reach out to your customer success manager or request a free-trial.


Subscribe to our blog
Get articles like this delivered straight to your inbox