Rolling out through mid-May, LogicMonitor v.119 brings with it two exciting new features: Auto-Balanced Collector Groups and topology mapping. Read on for highlights of these new features, and details on other enhancements included in this v.119 release.
New Feature Highlight: Auto-Balanced Collector Groups

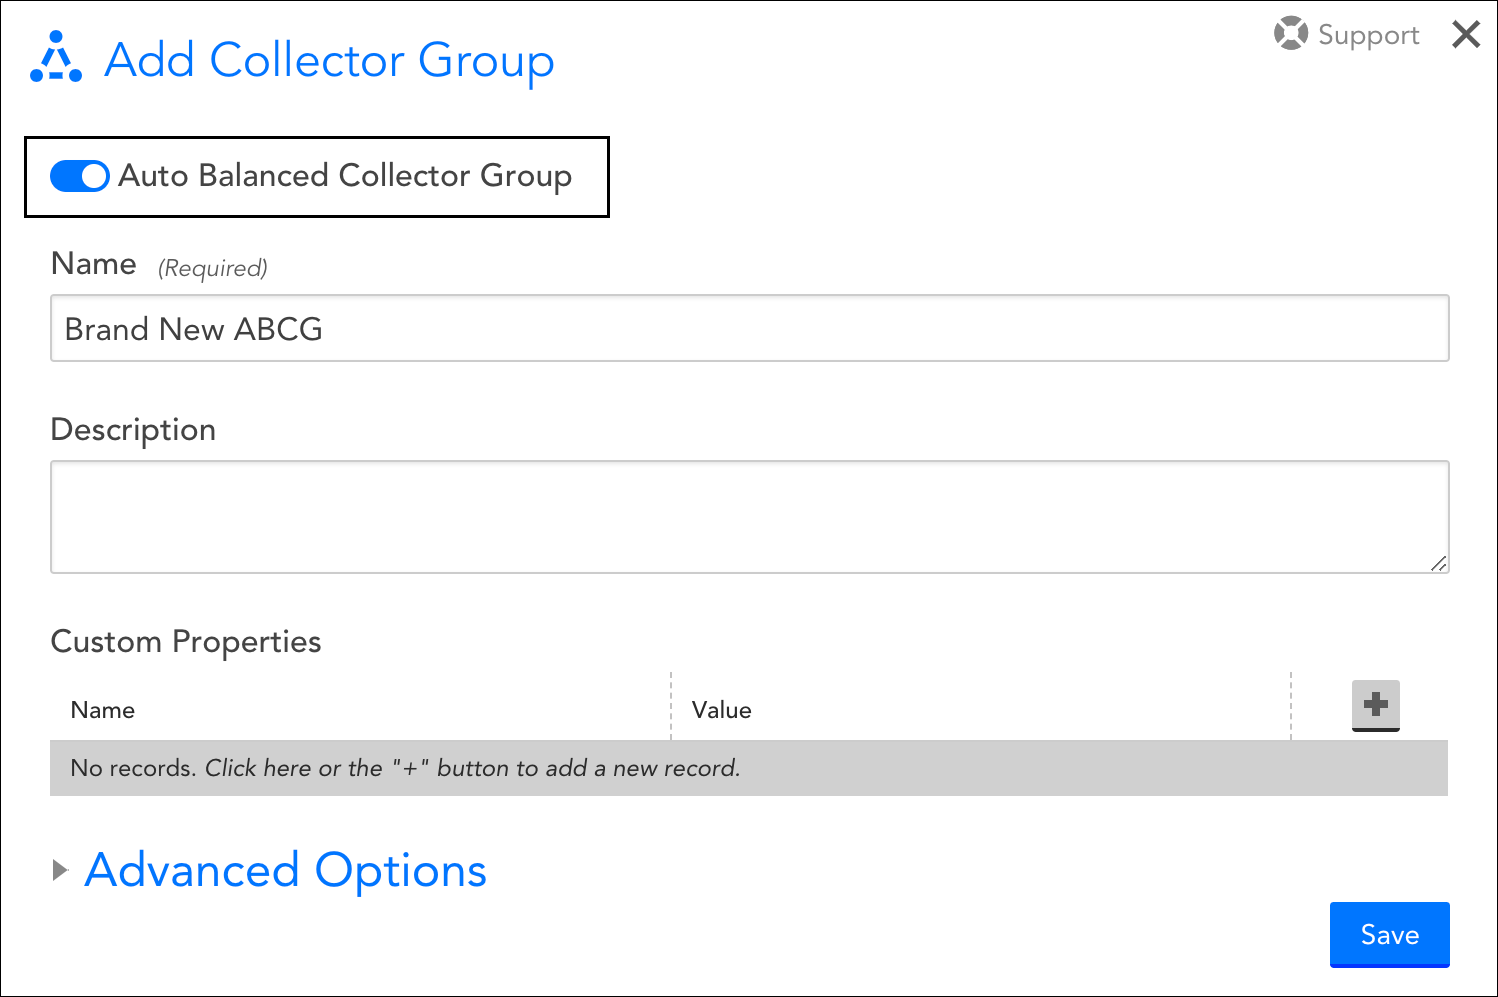
Get better device balancing, scaling, and failover with LogicMonitor’s brand new Auto-Balanced Collector Groups (ABCGs). An ABCG is a group of Collectors that share device load. ABCGs bring more efficient Collector management and monitoring through their ability to:
- Dynamically move devices from one Collector to another within the ABCG in order to prevent any individual Collector from becoming over-subscribed
- Equally distribute devices on a failed Collector to the remaining active Collectors in the ABCG
- Streamline device creation by simply assigning an ABCG and letting the ABCG decide which Collector will perform the monitoring
To learn more, see Auto-Balanced Collector Groups.
New Feature Highlight: Topology Mapping
A few days before the official rollout out of v.119 (on April 26 to be exact), we released topology mapping. Available to users of LogicMonitor Pro and Enterprise packages, LogicMonitor’s topology mapping allows you to visualize the logical relationships between elements in your network environment.
This additional context can be very beneficial to your monitoring operations, providing you with the ability to:
- Discover and map relationships between resources
- Generate topology maps based on alerts to streamline your troubleshooting workflow
- Navigate resources based on topology relationships
- Save relevant and frequently-used topology maps for monitoring continuity
Topology is auto-discovered by LogicMonitor! Once you’ve downloaded all necessary LogicModules, relationships are dynamically generated. To learn more, see Topology Mapping Overview.
Other v.119 Enhancements
Alerting
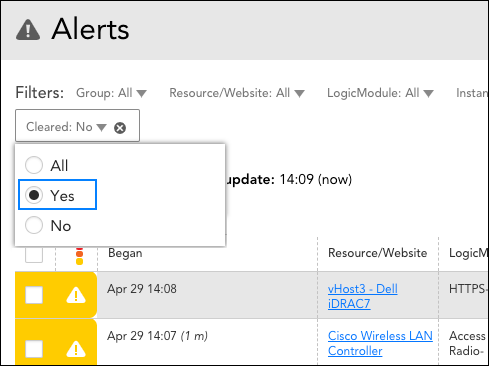
 Cleared alerts only filtering. When filtering alerts on the Alerts page (or Alerts tab), you now have the ability to see only those alerts that have been cleared. This is accomplished by checking the new “Yes” option available for the Cleared filter. Previously, you could only see cleared alerts in addition to active alerts (the “All” option) or explicitly exclude cleared alerts (the “No” option).
LM Cloud
- Amazon Web Services (AWS) monitoring updates:
- Tag discovery filter for DynamoDB. Added a tag discovery filter for the AWS DynamoDB service. We will not be removing the previously implemented name filter; the new tag filter will be connected with a logical AND to the name filter. You may find this new tag filter useful for preventing DynamoDB tables from being discovered based on tags that already exist in your AWS environment.
- AWS DMS replication instances monitoring. Added discovery and monitoring support for AWS Database Migration Service (DMS) replication instances.
- Google Cloud Platform (GCP) monitoring updates:
- UI text update for clarity. A term used in the text of the Add and Manage cloud account dialogs for GCP was updated to eliminate confusion. The dialogs now indicate that automatic disablement of alerting is available for deleted instances. Previously, the dialogs used the term terminated which, in GCP terminology, implies a stopped state.
LM Container
- Improved warning for manual deletion of Kubernetes resources. Added a more helpful warning when users attempt to delete monitored Kubernetes resources that are auto-managed by Argus.
LM Service Insight
- Adding member graphs to dashboards. Service member (i.e. instance and device) graphs can now be added to dashboards as widgets directly from the Service’s Graphs tab. This new capability parallels that already in place for adding a resource’s graphs to dashboards. You may find this useful for quickly building dashboards for your Services.
REST API
- Cleared-only alerts retrieval. The LogicMonitor REST API supports the new “Yes” option (added in this release) for the Cleared filter. This new option retrieves only those alerts that have been cleared. It is referenced in the API as cleared:true.
Topology Mapping
- New debug commands. To support LogicMonitor’s brand new topology mapping capabilities, two new commands are now available in the Collector Debug Facility that allow users to debug issues related to the unintended existence of duplicate external resource IDs (ERIs):
- !erimergelist [threshold=xxx] – This command lists all ERI values that appear across resources/instances (or those that meet a designated threshold if specified)
- !erimergedetail <eriValue> – This command lists all the resources/instances bound to an ERI value
- Edge collapsing. When multiple edges connect two vertices, the default behavior is to collapse those edges into a single edge for cleaner viewing. A new Display all edges option allows you to override this default behavior on a per-map basis from the map’s settings. Alternately, right-clicking on a collapsed edge will also show all edges between two vertices.
- Capturing multiple vertices for dragging. In addition to dragging and dropping a single vertex into a new position within a topology map, you can now also move multiple vertices in a topology map at once. To do so, position the cursor in approximation to the desired vertices and hold down a left click until the cursor becomes a plus sign. Then, with the click still held, draw a box that encompasses all the vertices you would like to move. Click any one of the vertices that you drew a box over to drag all selected vertices to a new location.
LogicModule Releases
LogicModules that have been added or updated since the last release.
New Monitoring Coverage
- Cisco IPSec Tunnels – 1 DataSource
- The existing Cisco IPSec Tunnels DataSource has been deprecated and removed; this new module is named with a slight variance (Cisco_IPSec_Tunnels) so as to not accidentally overwrite existing DataSource
- Layer 2 Topology – 8 PropertySources, 2 TopologySources
- Supporting auto-discovery of topology mapping for Arista, Cisco, HP, Juniper, Linux, and Windows network components
- SwiftStack – 10 DataSources, 1 PropertySource
- Veeam Backup and Replication – 8 DataSources, 1 PropertySource
- VMware vCenter Server Appliance (VCSA) – 11 DataSources
- VMware vCenter Topology – 5 DataSources, 2 PropertySources, 1 TopologySource
- Supporting auto-discovery of topology mapping for VMware components
Monitoring Improvements
- addCategory OracleDB – 1 PropertySource
- Improved exception handling
- AWS EBS – 1 DataSource
- Minor fix to datapoint descriptions and alert messages
- AWS Network ELB & Network ELB Target Groups – 1 DataSource
- Removed alert thresholds on TCP ELB Reset datapoints due to unpredictable HealthCheckIntervalSeconds behavior
- Cisco CUCM Processes – 1 DataSource
- Added Cisco known bug report to tech notes field
- Cisco NXOS – 1 ConfigSource
- Increased ExpectJ timeouts which were preventing instance discover
- Cisco QoS – 1 DataSource
- AD script improvements to reduce execution times and timeouts
- Citrix XenApp DataStore Status – 1 DataSource
- Updated script to convert IP to FQDN to resolve connection failure issues within PowerShell
- Dell Networking – 1 ConfigSource
- Updated AppliesTo function to include Dell PowerConnect hosts
- GCP HTTP Load Balancer – 1 DataSource
- Fix applied to datapoint response code for HTTP 400 requests
- Host Resources Memory – 1 DataSource
- Added various datapoint descriptions; graph cleanup
- LogicMonitor Collector JVM Status – 1 DataSource
- Added datapoint to capture max heap memory; adjusted heap percent utilization complex datapoint calculation; updated alert message
- Microsoft SQL Server – 1 PropertySource
- Added timeout support for testing instances
- Microsoft SQLServer Databases – 1 DataSource
- Wildvalue improvements for appropriate special character and space handling
- NetApp Cluster Aggregate – 1 DataSource
- Corrected issue in collection script to address NetApp ONTAP API not accepting all UUIDs properly
- NetApp Cluster Logical Interfaces – 1 DataSource
- Corrected issue in collection script wildvalue assignment
- NetApp E-Series Dynamic Disk Pools and Volume Groups – 1 DataSource
- Corrected issue with AD script to ensure proper matching of multiple storage controller arrays on SANtricity Web Services Proxies (WSPs) with multiple storage systems registered
- NetSNMP Memory – 1 DataSource
- Improved complex datapoint calculation
- Nimble HDD Disks – 1 DataSource
- Improved exception handling in collection script
- Nutanix Virtual Machines – 1 DataSource
- Numerous improvements to AD and collection to properly capture and convert hex output to ASCII; script execution time improvements and graph cleanup
- Terminal Services – 1 DataSource
- Added virtual datapoint to adjust for existing console and service sessions already active; improved datapoint description
- VMware ESXi Datastore Performance – 1 DataSource
- Fixed issue in AD script to ensure correct wildvalue is accessed
- VMware Horizon Troubleshooter – 1 DataSource
- Improved troubleshooting instance discovery and alert messages
- VMware LM Troubleshooter – 1 DataSource
- Improved troubleshooting script execution and alert messages
- VMware Object Count – 1 DataSource
- Fixed null exception handling on VM counts
- VMware vCenter VM Performance – 1 DataSource
- Updated calculation for CPUReadyperVCPU datapoint to properly display average per vCPU
- VMware vCenter VM Snapshots – 1 DataSource
- Updated snapshot age label for graph from “Age” to “AgeInHours” for clarity
- VMware vSphere VM Status – 1 DataSource
- Corrected issue with heartbeat alerts and mapping status; various improvements to exception handling
- Windows WMI Access – 1 DataSource
- Provided additional support for WMI access troubleshooting codes


