Amazon Web Services (AWS) products can feel countless, and at LogicMonitor, we are working tirelessly to bring monitoring support to as many of them as possible. With so many products and tools already on your plate, we want to make sure that monitoring is not a hassle, but rather a trusted companion.
AWS provides tools that help with application management, machine learning, end-user computing, and much more. While the list of tools AWS offers continues to grow, LogicMonitor consolidates data from these services and empowers users to monitor them side by side with the rest of their infrastructure, whether it’s in the cloud or on-premises. See how LogicMonitor uses tools from analytics and services for business continuity.
Jump to:
Monitoring AWS Analytics
AWS Athena
AWS Glue
Monitoring AWS Application-Related Services
Document DB
RDS Service Limits
MQ
Codebuild
Monitoring AWS Services For Business Continuity
AWS Opsworks Stacks
AWS AppStream 2.0
AWS Connect
AWS SageMaker
Monitoring AWS Analytics
AWS Athena
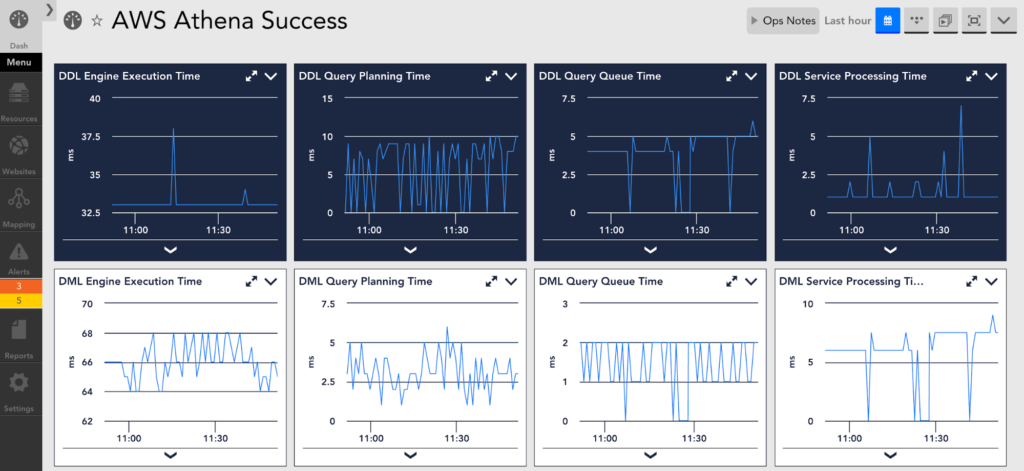
Amazon Athena is an interactive query service that analyzes data stored in Amazon Simple Storage Service (S3) using standard SQL. By monitoring Athena, we give users insight into failed queries and long-running queries. This allows them to catch issues sooner and resolve them faster, thus maximizing uptime and performance.
The data is collected into two query types: Data Definition Language (DDL) and Data Manipulation Language (DML). Each extracted metric is identified by the state of the query: canceled, failed, and succeeded. With that indicator, you can focus your attention on the metrics that are relevant to your task. You can also create a dashboard specifically for failed queries, which is useful for troubleshooting, and another dashboard for successful queries, which will help you come up with acceptable baselines for more accurate thresholds. While troubleshooting, you want to track the execution time. By bringing all the time metrics such as query queue, query planning, engine execution, and service processing into one place, you can quickly identify bottlenecks or the place where things break down. Once you feel like you are in a steady-state and things are running smoothly, make sure to go back and set suitable thresholds for the time metrics. With this, along with our dynamic thresholds feature, you can rest assured that you will only get notified when it matters.
AWS Glue
AWS Glue is a fully managed extract, transform, and load (ETL) service that helps customers prepare and load their data for analytics. The service automatically detects an enterprise’s structured or unstructured data when it is stored within other AWS services, such as data lakes in Amazon Simple Storage Service (S3), data warehouses in Amazon Redshift, and other databases that are part of the Amazon Relational Database Service. All of these can be monitored by LogicMonitor. The only objects from AWS Glue with measurable data are the Jobs, so this DataSource discovers the jobs automatically.
To accurately monitor Jobs, we need to keep track of executors, stages, and tasks.
The number of actively running job executors, “active executors”, can be helpful to identify any delays due to straggler scenarios. Keep an eye on active executors and the max executors metrics to know when it is time to provision more data processing units (DPUs). Make sure to create an alert and warnings for active executors metric as it approaches the max executors value.
As your job goes through different stages, it is helpful to have the completed stages metric on a dashboard to monitor the progress. If you notice that some stages are taking too long, you can correlate the CPU load, memory, and elapsed time metrics to triage the issue and potentially add more resources. Or you can repartition the load to lower the elapsed time. If there is any parallelism within your stages, it is essential to track the completed task and failed tasks. Depending on the workflow of the job, you need to set an appropriate threshold for failed tasks. These failed tasks can help determine abnormalities within the data, cluster, or script.
Monitoring AWS Application-Related Services
Document DB* (Database)
Amazon DocumentDB (with MongoDB compatibility) is a fast, scalable, highly available, and fully managed document database service that supports MongoDB workloads. Our users already monitor traditional MongoDB workloads, and with this DataSource, they can now monitor AWS DocumentDB workloads within LogicMonitor’s platform. For organizations that are planning to migrate from a traditional MongoDB environment to DocumentDB, LogicMonitor will provide metrics to closely monitor the transition and alert if there are any hiccups.
Keep the clusters healthy by monitoring the CPU, memory, network activity, database connections, and IOPS metrics. In the case of a node going down, you can monitor the replication lag metric (instanceReplicaLag). There is a chance that if the lag is too high, then your data is at risk of not correctly syncing, so make sure to keep an eye on this metric.
It is crucial to keep backups either via the retention period or snapshots, but it is also essential to know how much storage space these backup are using. Overlooking storage in a cloud environment can create massive headaches, so keep track of the larger backup files to make sure you stay within the storage budget. By tracking these metrics, backupRetentionPeriodStorageUsed, and snapshotStorageUsed, you’ll be able to see any unexpected spikes and take action immediately.
RDS Service Limits* (Database)
LogicMonitor already has RDS specific Datasources that will handle useful monitoring metrics. This new enhancement is adding unique metrics to monitor the RDS service limits. Amazon sets service limits on the number of RDS resources that can be created by an AWS account. A few of these resources include the number of database clusters, instances, parameters, snapshots, and allocated storage. With this data, you can be on top of the limits/quotas Amazon has on your RDS resources. You won’t get caught off guard and will be able to respond accordingly when critical resources are closing in on the quota.
MQ (Application Integration)
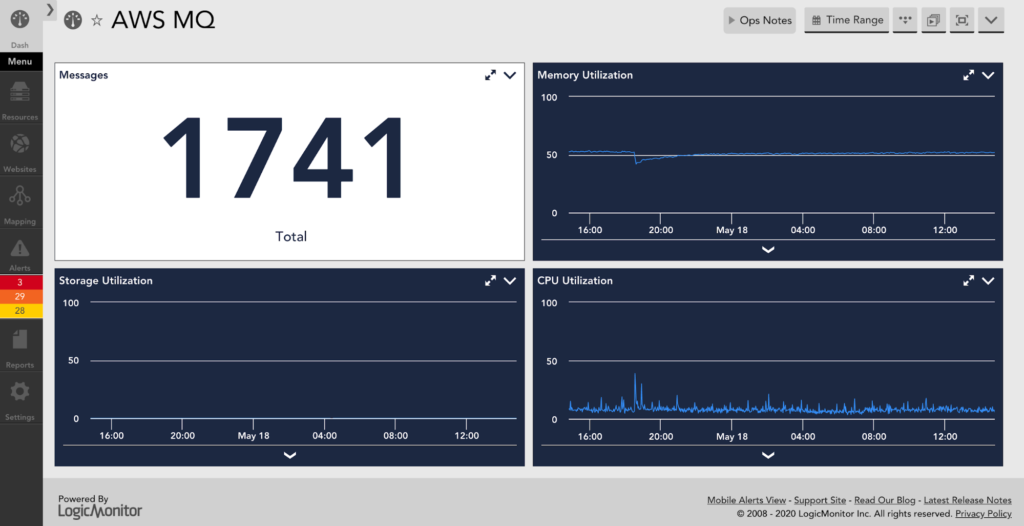
Frequently, users will have complex services that may partially rely on MQ and partially on other infrastructure running elsewhere, either on-premise or Cloud. Centralized monitoring in LogicMonitor equips them with more visibility so they can proactively prevent issues with these complex services in hybrid environments. Amazon MQ is a managed message broker service for Apache ActiveMQ. LM provides visibility into these managed brokers so that application teams can maximize uptime and performance with metrics such as message counts, CPU, memory, storage, and network utilization.
For active/standby deployments, LogicMonitor has a DataSource specifically for the standby resources. Separating the active and standby metrics allows for more clarity and keeps the data consistent.
Codebuild (Developer Tools)
AWS CodeBuild is a fully managed continuous integration service that compiles source code, runs tests, and produces software packages that are ready to deploy. You can monitor the build projects to ensure builds are running successfully and at the right time. It is ultimately giving you the information to optimize performance and uptime alongside your infrastructure data.
Application development teams need to be aware when builds fail. This DataSource has predefined thresholds that will automatically trigger notifications in the case of a failed build. Builds need to happen promptly, and with the breakdown of build time, you can pinpoint the step in the build that is causing delays and possibly add resources to optimize the build time of your projects.
Monitoring AWS Services for Business Continuity
AWS Opsworks Stacks
Cloud-based computing usually involves many components, such as load balancer, application servers, databases, etc. AWS OpsWorks Stacks, the original service, provides a simple and flexible way to create and manage stacks and applications. AWS OpsWorks Stacks lets you deploy and monitor applications in your stacks. Through CloudWatch we can get aggregate metrics for a stack, which helps understand the overall health of the resources within the stack & prevent issues. The metrics collected can be broken down into:
CPU Percentage
System
User
Input/Output Operations
Memory
Total
Cached
Free
Buffered
Average Load
1 minute
5 minutes
15 minutes
Processes
Total Active
A stack of the same resource is called a layer. For example, a layer represents a set of EC2 instances that serve a particular purpose, such as serving applications or hosting a database server. These layers can also be monitored within LogicMonitor. With LogicMontor’s robust coverage of AWS, you can also view the individual resource metrics of the layers through the out-of-the-box Datasources of the service.
AWS AppStream 2.0
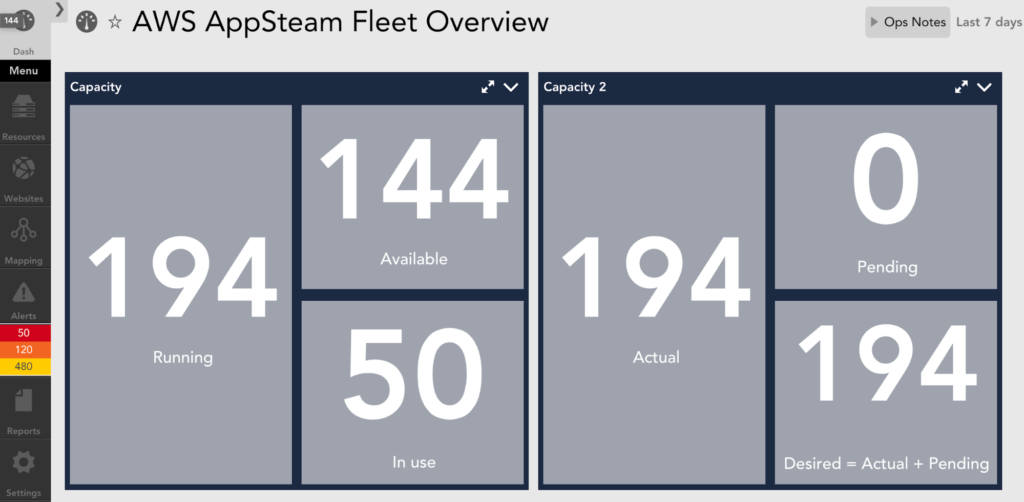
Amazon AppStream 2.0 allows organizations to manage desktop applications and securely deliver them to any computer. This service helps users run programs that could be resource-intensive on underpowered machines. AppStream is similar to Citrix or Microsoft remote desktop. It becomes essential to monitor the capacity and utilization of the fleets. With a simple dashboard, you can track current and remaining capacity, along with capacity utilization. When an insufficient capacity error happens, LogicMonitor will automatically send an alert.
AWS Connect
Customer service is as crucial as its ever been and people want fast and quality responses. Amazon Connect is an easy to use omnichannel cloud contact center that helps companies provide superior customer service at a lower cost. When utilizing this service, it is beneficial to track the following metrics: status of the service, the volume of calls, quota, and missed calls.
With out-of-the-box alerts for missed calls, misconfigured phone numbers, concurrent calls percentage, and recording upload errors, you can rest assured that you will be on top of any problematic situation.
AWS SageMaker
AWS SageMaker is a fully managed service that provides every developer and data scientist with the ability to build, train, and deploy machine learning models quickly. Users want to monitor this service alongside existing infrastructure to ensure uptime and performance across their entire complex infrastructure, particularly where SageMaker models are being used in production environments. SageMaker Endpoints are discovered as resources in LogicMonitor.
Each endpoint will have its own CPU, memory, and disk utilization metrics. All of which have predefined thresholds for automatic alerts and notifications. LogicMonitor tracks the total invoked HTTP requests and will alert if there are any 5XX errors. You can baseline the latency of the model and the SageMakers overhead. With these baselines, you can be on top of any changes when new models have been deployed or see the difference in latency when doing an A/B deployment.
Conclusion
We recently highlighted our commitment to our AWS partnership, and our developers keep cranking out new AWS monitoring integrations. Here are some previous blogs highlighting AWS analytics services and application development services. All of these new integrations are included with our LM Cloud offering. LogicMonitor will automatically start collecting these metrics if you are an LM Cloud customer and already utilizing any of these Amazon services.
If you have any questions regarding these new monitoring integrations, please reach out or contact your CSM for more information. Or you can try LogicMonitor for free