Alert fatigue is preventable when alerts are designed to be actionable, properly prioritized, and continuously reviewed.
-
Alert fatigue occurs when excessive alert volume and low-quality alerts make it harder to identify real, actionable issues.
-
IT teams reduce alert fatigue by removing duplicate alerts, grouping related alerts into correlated incidents, and pausing alerting during planned work.
-
Clear severity tiers and correct routing reduce missed incidents, on-call stress, and burnout.
-
Ongoing alert reviews and feedback loops are required to keep alerting effective as systems and teams change.
30% of security leaders consider alert fatigue one of their biggest operational challenges. Alert fatigue is a condition where excessive or low-value alerts reduce a team’s ability to recognize and respond to real problems.
This happens when monitoring systems generate frequent alerts that do not require action. As a result, IT teams spend more time sorting alerts and less time responding to actual incidents.
To prevent this, you have to prioritize alerts based on severity and business impact and eliminate those that do not require action and redundant notifications.
In this article, you’ll learn how to prevent alert fatigue using practical alerting patterns and what observability tools reduce alert fatigue for engineers.
Causes of Alert Fatigue
Alert fatigue is caused by a combination of high alert volume, low signal-to-noise ratio, and poor alert design.
The most common causes include:
- Excessive alert volume from systems that trigger on minor or expected behavior
- False positives, where alerts fire but no action is required such as alerts on self-healing conditions
- Non-critical notifications sent with the same urgency as outages or security incidents
- Duplicate alerts generated by multiple tools reporting the same underlying issue
- Poorly tuned thresholds that react to short-lived spikes instead of sustained problems
- Unclear ownership, where it is not obvious who should respond to an alert
In security operations, industry surveys report that 63% of organizations deal with duplicate alerts, and 60% deal with false-positive alerts. When these issues exist, IT teams spend a large amount of time reviewing false alerts. As a result, response speed declines and trust in alerts erodes.
Why Teams Become Desensitized to Alerts
Alert fatigue is driven by a psychological response called habituation, also known as desensitization. Habituation occurs when repeated exposure to the same stimulus causes the brain to pay less attention to it over time.
When IT teams are repeatedly exposed to the same alerts, and no negative outcome follows, the brain reduces attention to that. This natural brain adaptation leads to missed or delayed reactions, even when an alert is critical. In alerting systems, this happens when alerts fire frequently but rarely lead to incidents.
So each repeated alert lowers perceived urgency and alerts that once triggered, immediate investigation begins to feel routine. As a result, responses are delayed or skipped, even when a genuine issue occurs.
In the SOC (Security Operations Center), 62.5% of team members feel overwhelmed by alert volume, often due to duplicate or low-value alerts.
Signs You’re Experiencing Alert Fatigue
Alert fatigue usually becomes visible through operational symptoms before teams formally recognize it. Common signs include:
- Alerts taking longer to be acknowledged
- On-call engineers muting or suppressing notifications
- High time spent investigating alerts that result in no action
- Critical incidents reported by users or customers before alerts detect or escalate them
- Increased frustration, stress, or burnout during on-call rotations
- Declining confidence in monitoring or observability tools
How to Reduce Noise With Alert Consolidation And Grouping
IT Teams reduce alert fatigue in two primary ways:
- Alert consolidation: Remove duplicate or repetitive alerts so the same issue does not trigger multiple notifications.
- Alert grouping: Combine related alerts into a single incident based on shared metadata like host, service, or timing.
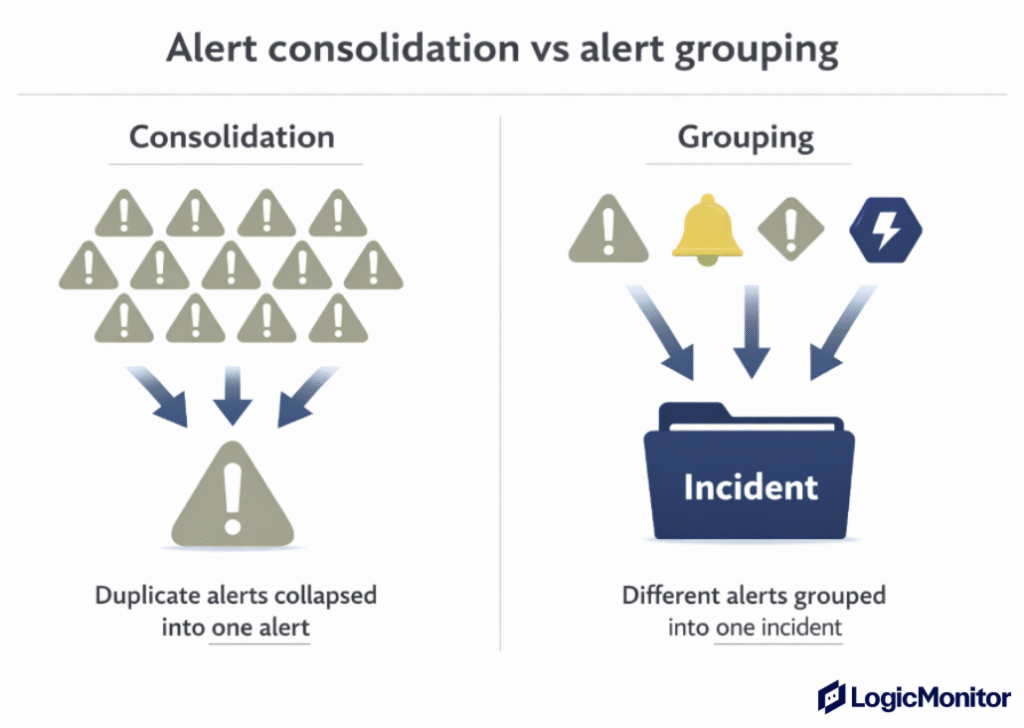
Consolidation suppresses repeated alerts for the same condition, so the system does not send multiple notifications when nothing has changed. After repetition is controlled, grouping combines alerts from related components into a unified incident view.
This sequence reduces noise first, then adds context so IT engineers can focus on the root cause instead of managing alert volume.
But how do you group alerts?
Here are four ways to do so:
- Group by service: Roll up alerts related to the same application or microservice into a single incident.
- Group by cluster or host: Alerts from the same server group or Kubernetes cluster are bundled together.
- Group by device: Infrastructure alerts from the same device are treated as one issue.
- Group by time window: Alerts that fire close together are grouped instead of sent separately.
How to Streamline Alert Delivery
Reducing alert noise helps decide which alerts should trigger. Controlling alert noise determines when and how those alerts reach users. This keeps attention focused on real issues and prevents unnecessary disruptions during expected conditions.
IT teams usually do this in a few practical ways:
- Bundle alert storms: During outages or traffic spikes, the systems group many alerts into one ongoing incident instead of sending dozens of separate messages.
- Deduplicate repeated alerts: When the same condition triggers an alert again without a meaningful state change, monitoring systems update the existing alert instead of sending a new notification.
- Schedule downtime: Alerts are paused during planned work like deployments or maintenance, so teams aren’t interrupted by issues they already expect.
- Route alerts by severity and importance: Critical alerts trigger paging or on-call tools, while lower-priority alerts stay on dashboards or reports rather than in inboxes or paging tools.
Prioritizing and Tiering Alerts
20% to 30% of alerts are ignored or never investigated in time. Why? Because too many alerts compete for attention. If low-impact alerts interrupt IT teams as often as real outages, they start assuming most alerts are not urgent, regardless of actual impact. Over time, response quality drops across the board.
That’s why alert prioritization and tiering are important:
- Prioritization evaluates each alert based on impact and urgency to determine its severity.
- Tiering then organizes alerts into clearly defined levels (for example, Tier 1, Tier 2, and Tier 3) based on severity, business impact, and required action.
Here’s how to prioritize alerts:
1. Decide what makes an alert critical
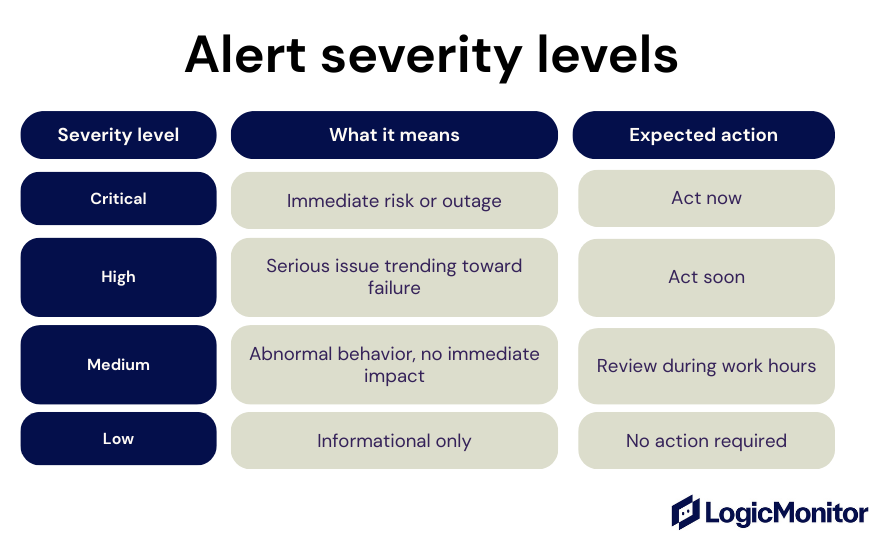
Each alert is evaluated against clear criteria, such as customer impact, service availability, data risk, and urgency. Then, risk-based scoring determines whether an alert should be critical, high, medium, or low before it reaches a human.
2. Map severity to notification channels
Once severity is determined, decide how to deliver alerts:
- Critical alerts page immediately through on-call or paging tools
- High-severity alerts notify the owning team through on-call or chat systems
- Medium alerts create tickets or dashboard entries
- Low alerts remain informational and do not interrupt anyone
3. Apply automated triage before alerting users
Automated triage evaluates context before sending alert notifications. It checks for duplicate alerts, correlated events, recent changes, and whether the issue resolves on its own within a defined suppression window.
If the alert represents the same incident or resolves quickly, the system suppresses or delays notification. If risk increases, the alert is escalated.
4. Escalate alerts based on response expectations
Escalation policies define what happens when alerts are not acknowledged or resolved within expected timeframes, typically defined by alert severity or SLA.
Here’s how it works:
- An alert is sent to the primary on-call responder based on ownership and severity
- If the alert is not acknowledged within a defined response window, it escalates automatically
- The alert is then routed to a secondary responder, such as a backup on-call engineer, or team lead
- For critical alerts, escalation may continue to management or incident command until someone responds
This ensures critical issues are not missed without increasing alert volume for lower-severity events.
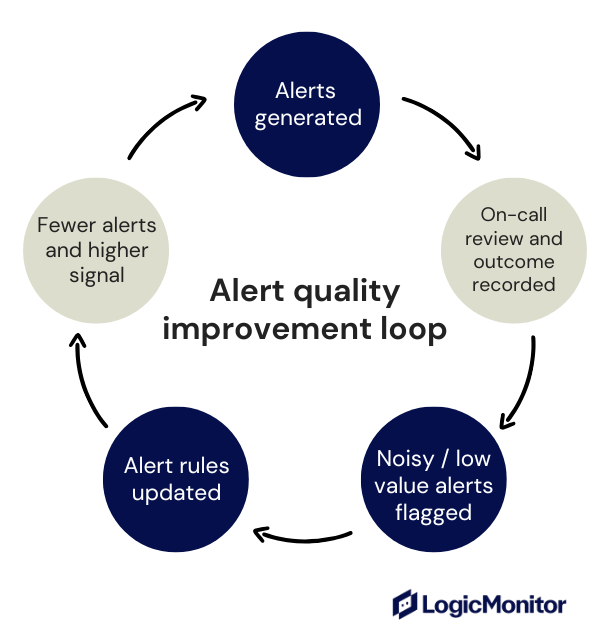
Build a Continuous Improvement Loop To Prevent Alert Fatigue
Alerting systems must evolve as environments change because new services are added, traffic patterns shift, and teams grow. As a result, alerts that were useful months ago may no longer reflect current system behavior or risk.
Here are some best practices to prevent alert fatigue:
Review alert configurations on a regular schedule
Proactive teams review alert configurations monthly or quarterly, depending on system criticality and change frequency. Reviews should focus on whether alerts led to action, whether ownership and routing were correct, and whether thresholds and alert timing still make sense.
Measure alert quality, not just alert volume
For this, use metrics like:
- How many alerts required remediation or follow-up action
- How quickly high-severity and critical alerts are acknowledged
- How many alerts were deduplicated, grouped, or auto-suppressed
- How disruptive on-call shifts felt (eg, after-hours interruptions)
Involve the users receiving the alerts
Engineers and on-call staff are best positioned to identify alert fatigue, since they experience alert volume and urgency firsthand during live incidents. So, create simple feedback loops that turn those experiences into actionable improvements like this:
- Ask engineers to flag noisy or low-value alerts during on-call
- Review flagged alerts in retrospectives or scheduled alert reviews
- Assign one owner to fix the alert configuration
Train teams as systems evolve and alert behavior changes
As tools, services, and automation evolve, your teams need updated visibility and situational awareness to respond appropriately to alerts, so make sure you provide them enough context to make the right decisions.
For example, IT engineers should understand what alerts mean now, which alerts require action, and what the system handles automatically.
Without this clarity, even good alerts lose credibility.
So, when alerts improve gradually and consistently, it reduces stress and helps teams maintain a reliable response over time.
Reduce Alert Fatigue With LogicMonitor
If you’re evaluating what observability tools reduce alert fatigue for engineers, LogicMonitor is the way to go.
LogicMonitor combines dynamic thresholds, AI-driven correlation (Edwin/LM Envision), and built-in grouping/deduplication to reduce noisy pages and surface likely root causes before alerts reach people.
Beyond noise reduction, LogicMonitor supports deep enterprise integrations and a scalable unified view that lets teams route alerts into existing incident workflows and measure alert quality over time so fixes stick instead of drifting back into noise.
That combination (automation + context + integrations) is the practical reason LM Envision helps engineers spend less time triaging and more time fixing.
FAQs
Should every alert have a documented owner?
Yes, because alerts without assigned ownership often get ignored. So make sure to assign ownership for better accountability, faster resolution, and routing clarity during incidents.
Is alert fatigue only a problem for large organizations?
No. Small teams experience alert fatigue too, especially when one person is responsible for many systems or is on frequent call rotations.
What is the difference between alert fatigue and burnout?
Alert fatigue is caused by excessive or low-value alerts. Burnout is broader and includes workload, stress, and lack of recovery time. Alert fatigue often contributes to burnout.
How do I know if my current monitoring system supports dynamic thresholding?
Most modern network monitoring tools list dynamic thresholds as a feature in their alert configuration settings. Check your platform’s documentation or alert rule configuration to see if thresholds can update based on historical patterns or behavior baselines.
What’s the best way to train the AI in my network monitoring tool to recognize what counts as noise?
To improve AI-driven alert filtering, regularly mark alerts as false positives, resolve tickets properly, and group similar incidents when possible. Over time, this feedback helps the AI model prioritize real issues and suppress unnecessary ones.
Can I apply role-based alert routing without restructuring my whole IT team?
Yes. Most tools help you assign alerts based on tags, keywords, or system classifications. Route bandwidth or server performance alerts to their respective teams, then build out more rules as you refine your process.
What if my team still ignores alerts, even after reducing noise?
If alerts are still being missed, try adding escalation protocols and alert acknowledgment policies. When alerts escalate automatically after a set time, it builds accountability and helps prevent unresolved incidents from going unnoticed.
How does integrating with an incident response system actually save time?
When you integrate your IT monitoring software with an incident management platform, alerts can instantly create tickets, assign tasks, and document steps taken.