

LM Envision is an AI-powered hybrid observability platform from LogicMonitor that unites comprehensive monitoring and observability capabilities. In this blog post, we’ll show how to integrate Istio service mesh with a LogicMonitor APM so that application traces can be used within LM Envision to better understand, optimize, and troubleshoot application performance.
1. What Is a Service Mesh?
A service mesh enables organizations to secure and connect microservices, providing a great source for monitoring microservices. This removes the responsibility of managing all service-to-service communication within a distributed software system. The way service mesh is able to do that is through an array of network proxies. Essentially, requests between services are routed through proxies that run alongside the services but sit outside in the infrastructure layer.
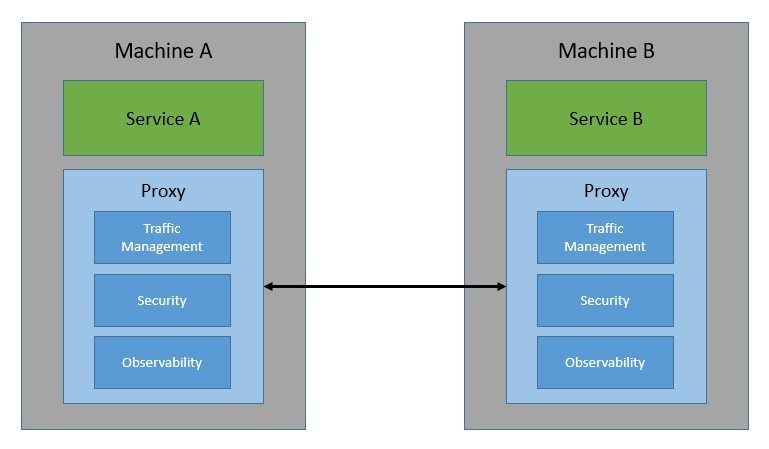
Features of a Service Mesh
- Traffic management: a service mesh can provide retries, timeouts, rate-limiting, traffic splitting, and circuit breakers.
- Security: service-to-service communication, providing authentication through certificate validation, and ensuring authorization through access policies.
- Observability: can generate a lot of metrics like latency, traffic, errors, and saturation, access logs & providing a full record for each request.
2. Istio
- Introduction:
Istio is an open-source service mesh designed to help in maintaining reliable service-to-service connections. Istio is by far the most popular service mesh that works with Kubernetes very well. This is an open-source implementation of the service mesh originally developed by IBM, Google, and Lyft. It can layer transparently onto a distributed application and provide all the benefits of a service mesh like traffic management, security, and observability. Istio works by deploying an extended version of Envoy as proxies to every microservice as a sidecar.
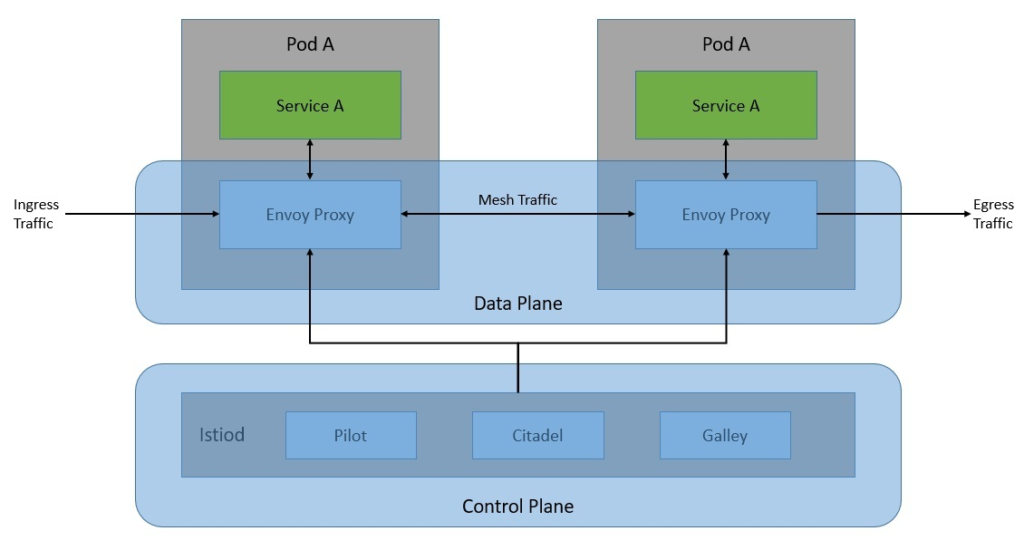
The network of proxies constitutes the data plane and The configuration and management of these proxies are done from the control plane, The control plane is basically the brain of the service mesh. It provides discovery, configuration, and certificate management to Envoy proxies in the data plane at runtime.
- How Istio Observability Works:
Like most service mesh implementations, Istio complements existing application containers with a proxy container, called a sidecar. Sidecar proxies are specially configured Envoy instances that intercept network traffic entering and leaving service containers and reroute the traffic over a dedicated network, Istio generates distributed traces through the Envoy proxies, it supports a number of tracing backends like Zipkin, Jaeger, OTEL, etc.
- How Istio Observability Works with LM APM:
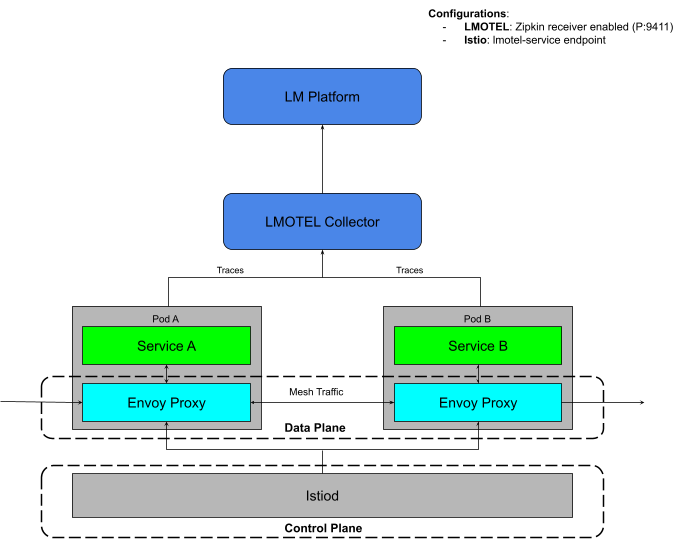
Istio with help of Envoy sends traces to LMOTEL Collector in HTTP Zipkin format and LMOTEL collector receives those traces with the help of Zipkin receivers. The LMOTEL collector exports the traces received from istio to the LogicMonitor backend with the help of exporter.
3. Getting started with Setup
As part of this setup, we will be installing the LMOTEL collector and Istio.
Step-1 Setting up and configuring LMOTEL collector:
- To install LMOTEL collector on the Kubernetes platform go through the Install an OpenTelemetry Collector document.
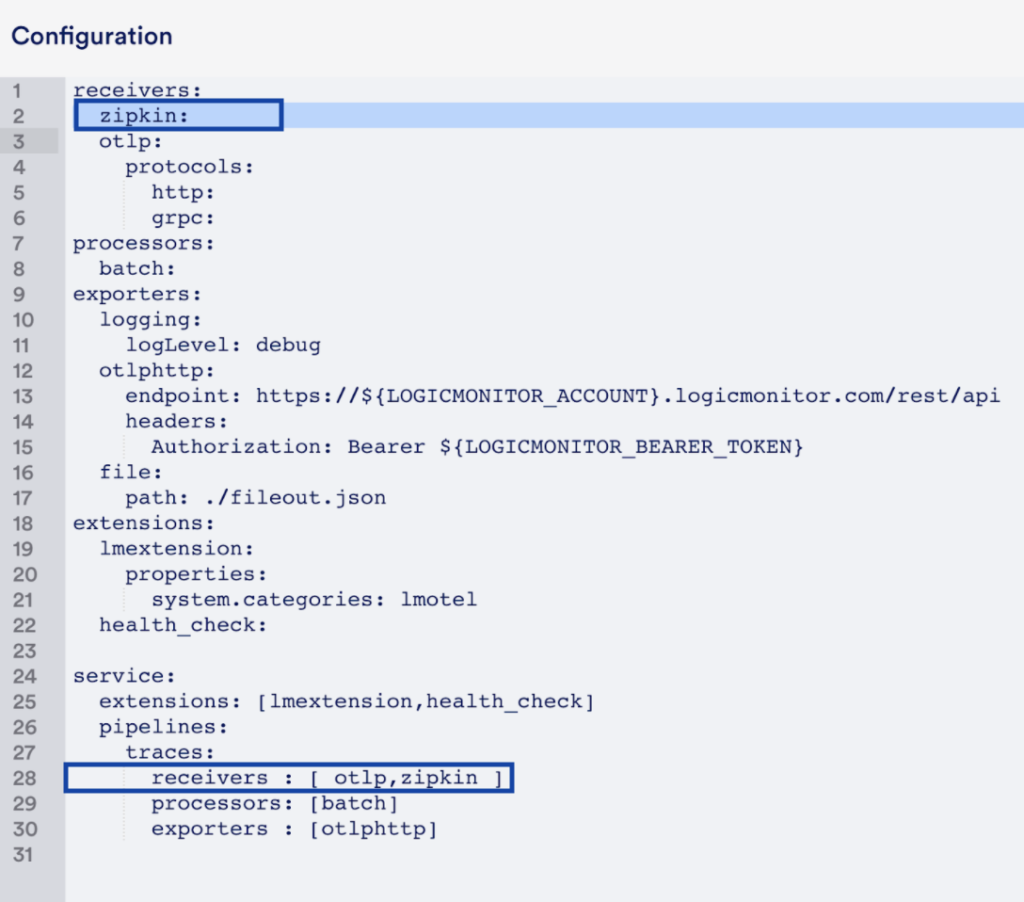
- To enable Zipkin receiver, modify the LMOTEL configuration and download the config file.
- After the config page, you will be presented with the page having the command to install LMOTEL collector, copy the command and modify it by referring to the below example.
helm repo add logicmonitor "https://logicmonitor.github.io/k8s-helm-charts"
helm install -n logicmonitor \
--create-namespace \
--set lm.account=AccountName \
--set lm.bearer_token=xxxxx \
--set lm.otel_name="istio-eks-poc" \
--set replicaCount=1 \
--set-file=external_config.lmconfig=/Path/To/config.yaml  \
--set service.ports.zipkin=9411 \
lmotel logicmonitor/lmotelIn the command we have exposed the Zipkin receiver port and have defined the config file path which we have downloaded in the above step.
Step-2 Setting up Istio
We will be using Istioctl to install Istio. You can refer to the document to install Istioctl.
- Run the following command to install Istio by passing the LMOTEL collector Zipkin receiver’s endpoint.
istioctl install \
  --set meshConfig.accessLogFile=/dev/stdout \
--set values.global.tracer.zipkin.address=lmotel-svc.logicmonitor:9411- Now label the k8s namespace where the application will be deployed with the label istio-injection=enabled. Labeling the k8s namespace will allow Istio to inject envoy proxies as a sidecar into the pods.
## Here we are labeling default namespacekubectl label namespace default istio-injection=enabled
kubectl get ns --show-labels- Now deploy any sample app in the labeled namespace by referring to below links.
Ref-1: https://istio.io/latest/docs/examples/bookinfo/
Ref-2:https://github.com/GoogleCloudPlatform/microservices-demo
After all the above steps, as soon as your application generates traces it will appear in the LM platform as shown below.
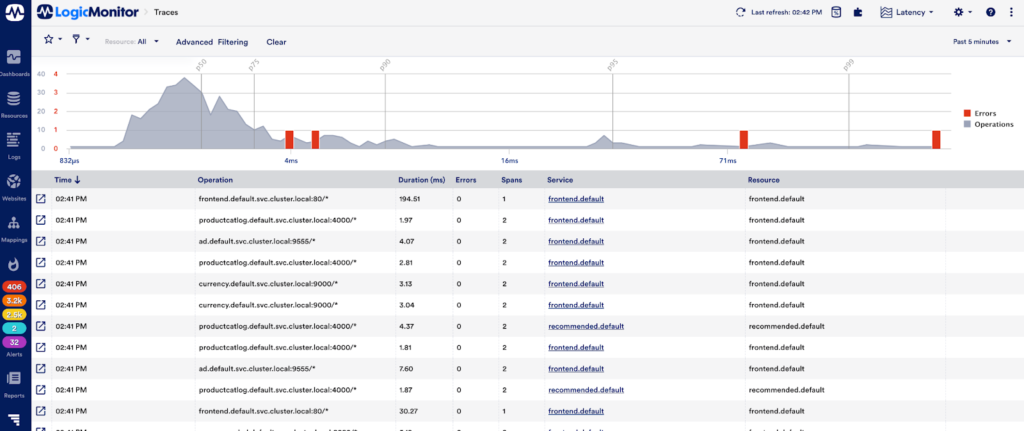
You can use these application traces within LM Envision to better understand application performance and identify areas for optimization (e.g. which spans within a trace take the longest), proactively get notified when application performance is sub-optimal (e.g. you may set up dynamic thresholds-based alerting for the duration and errors for your applications, so you know when anomalies occur), as well as speed troubleshooting time (e.g. span logs may provide context regarding why the duration is longer than normal).
4. Troubleshooting:
- Edit istio config
kubectl -n istio-system edit configmap istio5. References:


