
Apache
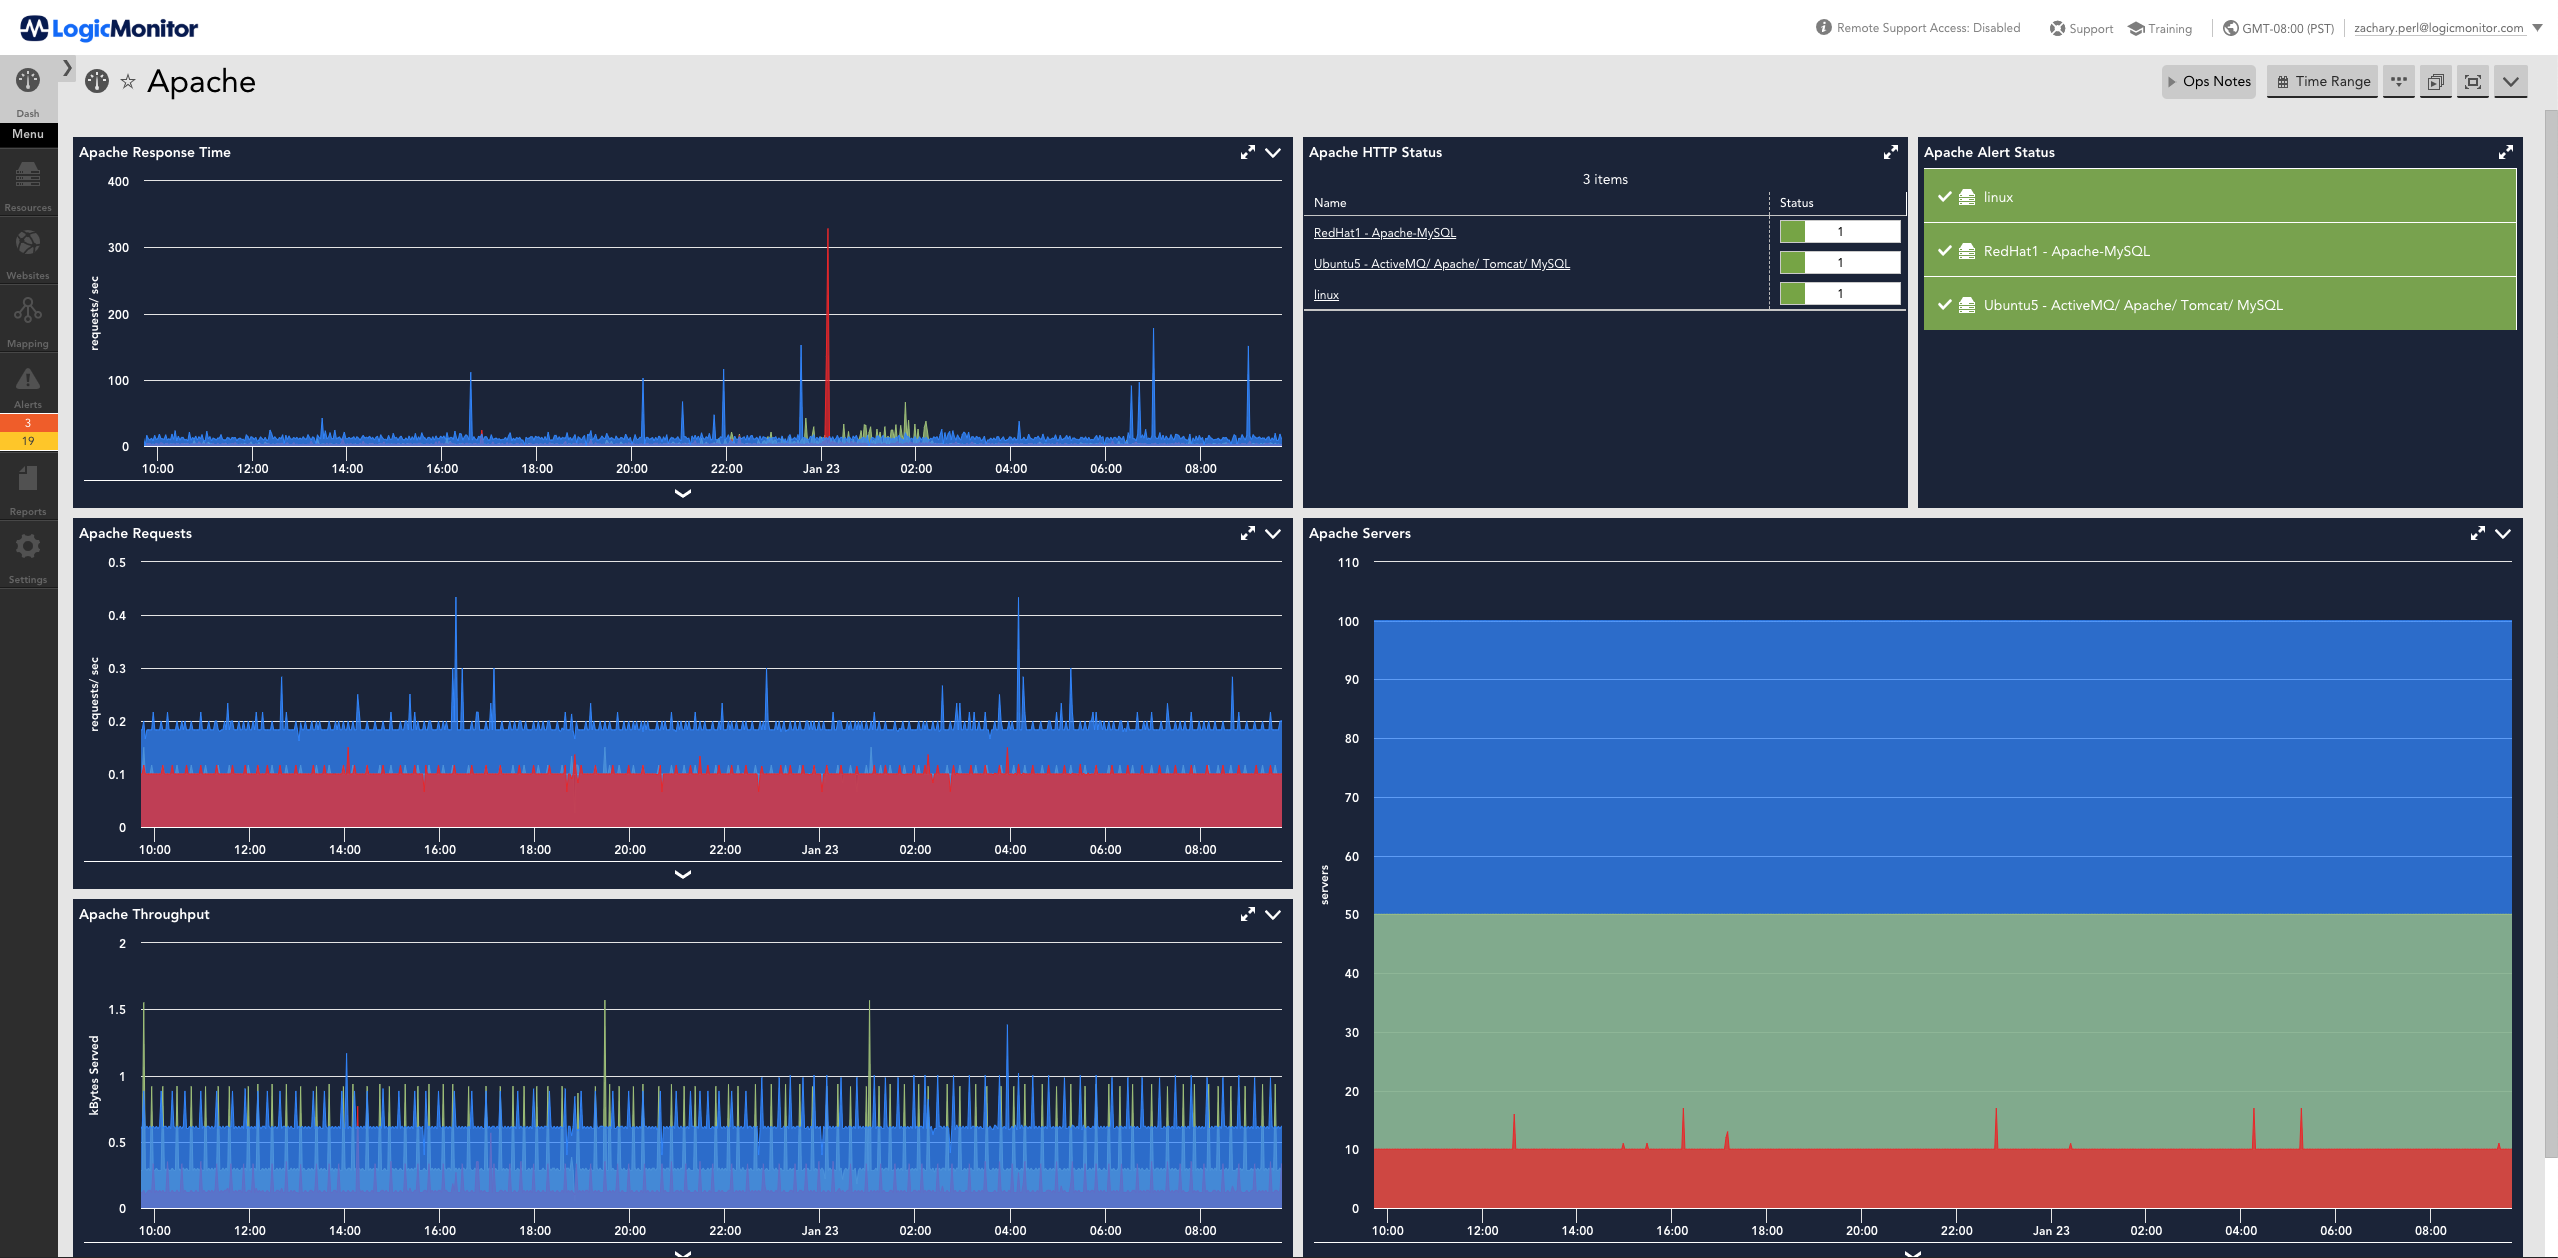
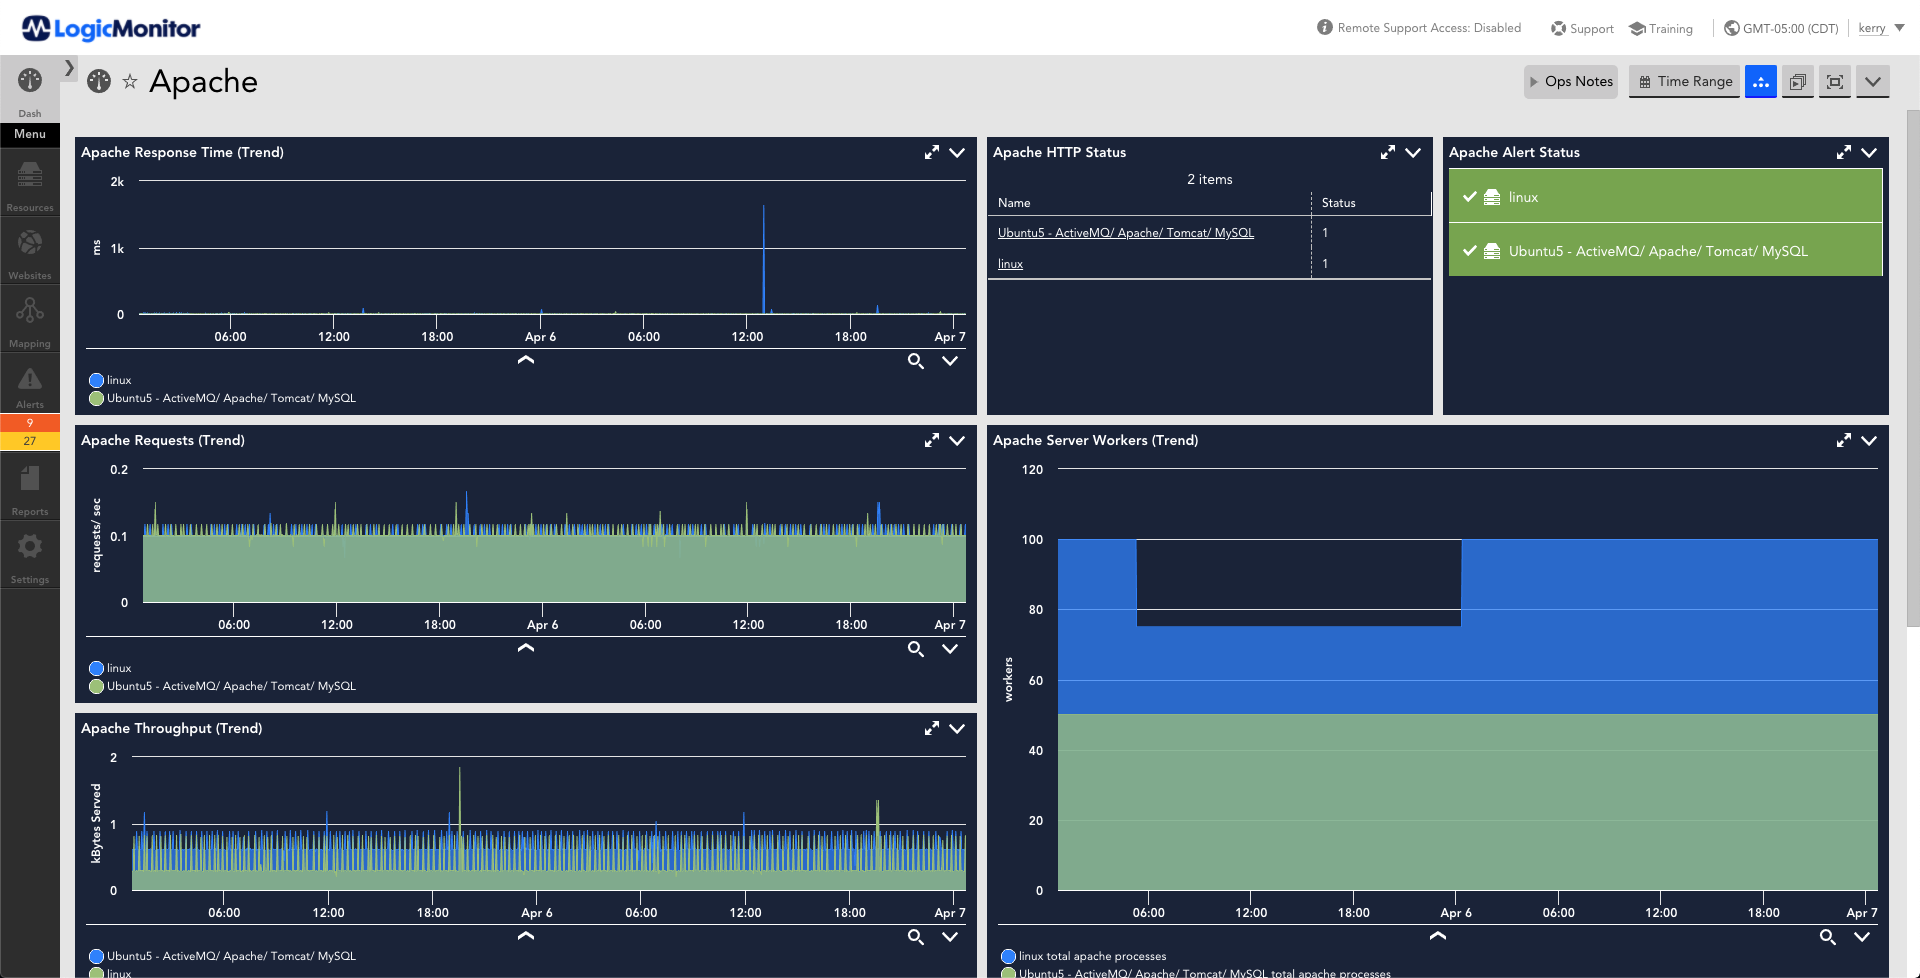
Apache Web Server powers your mission critical sites. Whether internal or customer-facing, you need to know when your web-server performance is under heavy load or not performing optimally. LogicMonitor provides agentless and proactive monitoring of your Apache instances so that can maintain performance and scale with confidence.

Agentless and Proactive Monitoring for Apache
LogicMonitor’s agentless architecture allows you to deploy anywhere and start collecting critical Apache metrics, such as Busy-Workers and Response-Time, within minutes.
Contextualize and Correlate your data on pre-built Dashboards
Out-of-the-box dashboards allow you to contextualize and compare performance across your fleet of Apache Web Servers. Quickly identify performance bottlenecks and improper load-balancing.


Immediately alert on irregular Apache Web Server behavior
Take advantage of LoigcMonitor’s machine-learning so that you are alerted to irregular behavior on your Apache instances, while also reducing alert-noise from recognized norms.
Accurately Report on Trends and Forecasts
LogicMonitor stores all of your collected metrics for up to two years. No roll-ups or aggregation. This means you can confidently report on trends, forecasts, and SLA’s of your Web Server availability and performance.

Setup:
Monitoring Apache Web Server is simple with LogicMonitor’s agentless, Collector based architecture. See our Support guide on how to get up and running.
Similar & Related Integrations
Apache Solr
Other Resources
Curious about monitoring Apache Web Server on your Cloud Instances? See this 3rd-party White Paper on Monitoring AWS Beyond CloudWatch.