The Interface Bandwidth report displays maximum and average values for interface inbound and outbound throughputs across multiple resources. The information is displayed as a table and can include a graph for each interface, allowing you to view multiple interface metrics across a group of devices.
Disclaimer: When generating the Interface Bandwidth report, only the following default DataSources are supported:
- snmp64_If-
- snmpIf-
- WinIf-
- snmp64_If_novlan
- snmp64_If_user_ports-
- SNMP_Network_Interfaces
Custom DataSources are not supported when generating the Interface Bandwidth report.
Configuring the Interface Bandwidth Report
- In LogicMonitor, navigate to Reports.
- Select
 > Add Report > select Add for the Interface Bandwidth report.
- In the Name field, enter a name for the report.
Report names cannot include the operators and comparison functions used in LogicMonitor’s datapoint expression syntax. - (Optional) In the Description field, enter a description for the report.
For example, you can enter a description of the specific purpose of the report. - From Report Group, select the report group where your report is stored.
Matching groups display as you type, and you can select the group from the list. - From Format, select the type of format for the output of the report.
You can select HTML, PDF, or CSV.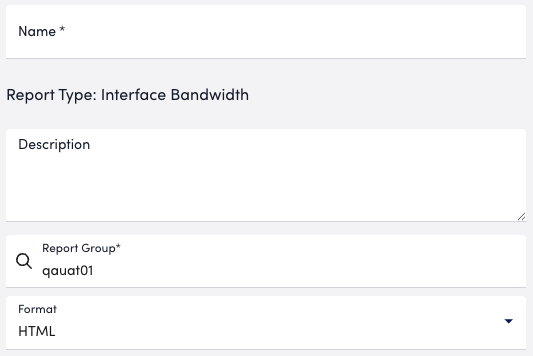
- In the Time Range section, do one of the following to configure the time range that you want the report to display information for:
- To configure a set time range, choose Predefined time range, and then select a time range.

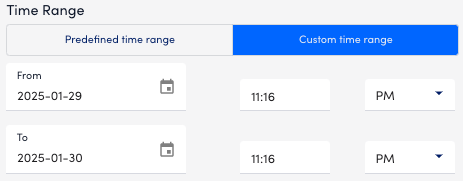
- To configure a custom time range, choose Custom time range, and then configure the following:
- Enter or choose a date in the From field, and then configure the settings to define the time you want the report to start at.
- Enter or choose a date in the To field, and then configure the settings to define the time you want the report to end at.
- To configure a set time range, choose Predefined time range, and then select a time range.
- Do one of the following to base the Interface Bandwidth report on resources or resource groups:
- To add a resource group, select Resource Group and enter the name of a resource group from the Resource Group field.
LogicMonitor attempts to match values as you type.
- To add a resource group, select Resource Group and enter the name of a resource group from the Resource Group field.
Note: You can select a combination of both glob and distinct values to specify your resources or resource groups. For more information, see Using Glob Expressions Throughout the LogicMonitor Portal.
- To add a resource, select Resource and enter the name of a resource from the Resources field. LogicMonitor attempts to match values as you type.
Note: You can select a combination of both glob and distinct values to specify your resources or resource groups. For more information, see Using Glob Expressions Throughout the LogicMonitor Portal.
- Indicate which DataSource to include in the report using the Datasource, Instance, and Description fields.

- Toggle the Show top 10 only switch to display only the top 10 results in your report for each DataSource you have defined.
For example, if you defined a DataSource for HostStatus and Ping, your report displays the top 10 results for HostStatus and the top 10 results for Ping. - Toggle the Scale by units of 1024 switch to change the scale of the graph.
By default, the graph is scaled by units of 1000. - From the Report Format dropdown menu, select the format for how you want the report displayed.
- From the Percentile dropdown menu, select the percentile to capture the highest usage levels experienced during the peak traffic hours.
For example, if you select the 95th percentile, it provides a reliable metric for evaluating your network’s bandwidth performance, capturing the highest usage levels experienced during the top 5% of peak traffic periods. This helps distinguish between typical traffic patterns and temporary fluctuations. - From the Data Format dropdown menu, select the format to convert the data into.
By default, the data format is set to Bits.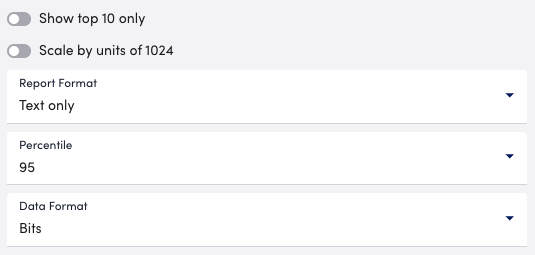
- In Report Schedule settings, do the following to configure the report to generate on a schedule:
- Toggle the Generate this report on a schedule switch.
- From Frequency, select how frequent you want the report to generate, and then configure when you want the report to generate.
For example, if you configure the report to generate daily, you can choose the time to generate the report each day. If you configure the report to generate weekly, you can choose the day of the week and time to generate the report for the selected date. If you configure the report to generate monthly, you can configure the day of the month and time to generate the report.
Each frequency option provides you a setting for selecting the time zone. - In Recipients Email, enter the name of the user you want to receive the generated report. You can also add recipient groups.
You can enter as many users as needed.
LogicMonitor attempts to match values as you type.
The recipients you add to the report are emailed a generated report based on the format you configured and the email associated with the username.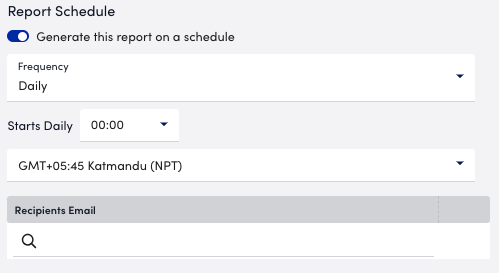
- Do one of the following to save the report:
- Select Save.
The report saves to the Report Group you selected.
If you configured the report to generate on a schedule, the report generates and sends to recipients based on the frequency you configured. - Select Save and Run.
The report saves to the Report Group you selected and generates a report based on the format you configured.
If you configured the report to generate on a schedule, the report generates and sends to recipients based on the frequency you configured.
- Select Save.
Threshold Limits for Interface Bandwidth Report
Note: For ad-hoc reports, you must select the maximum date range as less than or equal to last month. If you require a date range more than the previous month, you must schedule the required reports.
Adhoc Requests Thresholds (Limit for number of graphs)
| CSV | HTML | |
| 250 | 120 |
Scheduled Requests Thresholds
| CSV | HTML | |
| 600 | 600 |
Adhoc Requests Thresholds (Limit for number of instances)
| CSV | HTML | |
| 500 | 4200 | 3700 |
Scheduled Requests Thresholds
| CSV | HTML | |
| 19900 | 5000 | 5000 |
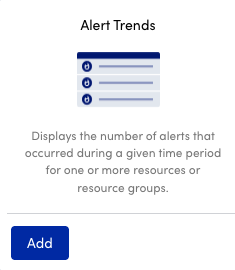
The Alert Trends report summarizes the number of alerts for each severity level that occurred for one or more resources or groups for a specified period of time. You can use this report to monitor and identify the resources and resources groups that are generating too many alerts. Then, you can adjust the alert thresholds for the resources to reduce the number of alerts. For more information, see Status Thresholds for Datapoints.
Configuring an Alert Trends Report
- In LogicMonitor, navigate to Reports.
- Select
 Add Report, select Add for the Alert Trends report.
- In the Name field, enter a name for the report.
Report names cannot include the operators and comparison functions used in the LogicMonitor datapoint expression syntax. - (Optional) In the Description field, enter a description for the report.
For example, you can enter a description of the specific purpose of the report. - From Report Group, select the report group where your report is stored.
Matching groups display as you type, and you can select the group from the list. - From Format, select the type of format (for example, HTML, PDF, or CSV) for the output of the report.
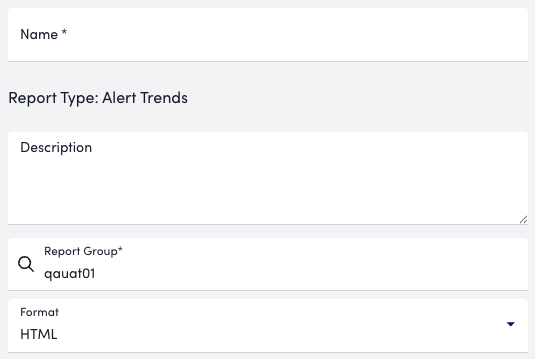
- In Time Range settings, configure the time range you want to base the report on by doing one of the following:
- To configure a predefined time range, select Predefined time range, and then select on of the time range options.

- To configure a custom time range, select Custom time range, and then configure the date and time.
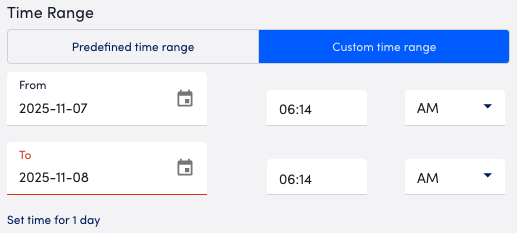
- To configure a predefined time range, select Predefined time range, and then select on of the time range options.
- In the Resource Groups/Resources section, add resources to the report by doing the following:
- From Choose Type, select either “Resource” or “Resource Group”.
- In the Resource Group/Resources field, enter the name of a resource or resource group.
The report is restricted to the data entered in these fields.
You can use explicit names or glob expressions in these fields.
Note: You can select a combination of both glob and distinct values to specify your resources and resource groups. For more information, see Using Glob in your LogicMonitor Portal.
- In Report Schedule settings, do the following to configure the report to generate on a schedule:
- Toggle the Generate this report on a schedule switch.
- From the Frequency dropdown menu, select how frequent you want the report to generate, and then configure when you want the report to generate.
For example, if you configure the report to generate daily, you can choose the time to generate the report each day. If you configure the report to generate weekly, you can choose the day of the week and time to generate the report for the selected date. If you configure the report to generate monthly, you can configure the day of the month and time to generate the report.
Each frequency option provides you a setting for selecting the time zone. - In Recipients Email, enter the name of the user you want to receive the generated report. You can also add recipient groups.
You can enter as many users as needed.
LogicMonitor attempts to match values as you type.
The recipients you add to the report are emailed a generated report based on the format you configured and the email associated with the username.
Note: When configuring a delivery schedule, your report is generated and emailed immediately if it has not been generated within the last 24 hours. After that, emailed delivery only occurs according to the schedule.
- To save the report, do one of the following:
- Select Save.
The report saves to the Report Group you selected.
If you configured the report to generate on a schedule, the report generates and sends to recipients based on the frequency you configured. - Select Save and Run.
The report saves to the Report Group you selected and generates a report based on the format you configured.
If you configured the report to generate on a schedule, the report generates and sends to recipients based on the frequency you configured.
- Select Save.
Threshold Limits
Adhoc Requests Thresholds (Limit for number of alerts)
| CSV | HTML | |
| 76500 | 30000 | 2000 |
Scheduled Requests Thresholds
| CSV | HTML | |
| 200000 | 30000 | 2000 |
The Alert Service Level Agreement (SLA) report displays the amount of time that a set of resources are in warning, error, or critical alert status over a specified period of time. This report also calculates the total percentage of time that the resources were not in alert status for that same given time period. You can use this report to display the percent of time that a resource datapoint value falls out of the normal range, where normal is defined by alert thresholds.
You can use the Alert SLA report to do the following:
- Monitor your service SLAs, whether that includes resource groups, a single resource, or specific instances and datapoints.
- Communicate to customers that you are meeting the SLAs defined in their contracts. You can configure different thresholds for each customer and use the Alert SLA report to communicate the percent of time the services you provide are available. For more information, see Static Thresholds for Datapoints.
Note: If you want to evaluate how effectively your resources met their SLAs using metrics other than alert thresholds, consider creating an SLA report instead. The SLA report type lets you choose what constitutes an acceptable service level. For more information, see Service Level Agreement Report.
Configuring an Alert SLA Report
- In LogicMonitor, navigate to Reports.
- Select
 > Add Report > select Add for the Alert SLA report.
- In the Name field, enter a name for the report.
Report names cannot include the operators and comparison functions used in LogicMonitor’s datapoint expression syntax. - (Optional) In the Description field, enter a description for the report.
For example, you can enter a description of the specific purpose of the report. - From Report Group, select the report group where your report is stored.
Matching groups display as you type, and you can select the group from the list. - From Format, select the type of format for the output of the report.
You can select HTML, PDF, or CSV.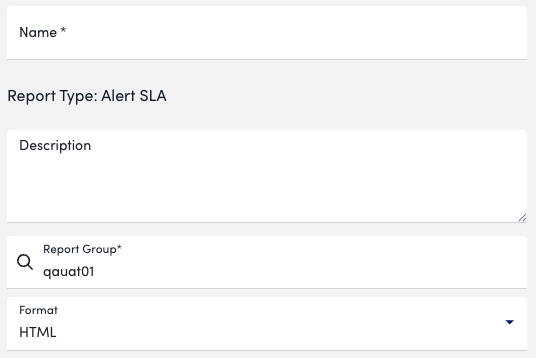
- In the Time Range section, do one of the following to configure the time range that you want the report to display information for:
- To configure a set time range, choose Predefined time range, and then select a time range.

- To configure a custom time range, choose Custom time range, and then configure the following:
- Enter or choose a date in the From field, and then configure the settings to define the time you want the report to start at.
- Enter or choose a date in the To field, and then configure the settings to define the time you want the report to end at.

- To configure a set time range, choose Predefined time range, and then select a time range.
- Do one of the following to base the Alert SLA report on resources or resource groups:
- To add a resource group, select Resource Group and enter the name of a resource group from the Resource Group field.
LogicMonitor attempts to match values as you type.
- To add a resource group, select Resource Group and enter the name of a resource group from the Resource Group field.
Note: You can select a combination of both glob and distinct values to specify your resources or resource groups. For more information, see Using Glob Expressions Throughout the LogicMonitor Portal.
- To add a resource, select Resource and enter the name of a resource from the Resources field. LogicMonitor attempts to match values as you type.
Note: You can select a combination of both glob and distinct values to specify your resources or resource groups. For more information, see Using Glob Expressions Throughout the LogicMonitor Portal.
- In the DataSource Instances field, enter a DataSource instance that has datapoint values you want to evaluate.
LogicMonitor attempts to match values as you type.
You can use a wildcard to include all instances. - In the Datapoints field, enter one or more datapoints to evaluate against the alert thresholds.
You can use an explicit name, a glob expression, or a wild card to include all datapoints. - In the Alert Rule field, specify the alert rule you want to use to evaluate and route alerts.
LogicMonitor attempts to match values as you type. - From the Severity dropdown menu, select the minimum alert status severity you want to use to evaluate the specific resource groups or resources.
- In Report Schedule settings, do the following to configure the report to generate on a schedule:
- Toggle the Generate this report on a schedule switch.
- From Frequency, select how frequent you want the report to generate, and then configure when you want the report to generate.
For example, if you configure the report to generate daily, you can choose the time to generate the report each day. If you configure the report to generate weekly, you can choose the day of the week and time to generate the report for the selected date. If you configure the report to generate monthly, you can configure the day of the month and time to generate the report.
Each frequency option provides you a setting for selecting the time zone. - In Recipients Email, enter the name of the user you want to receive the generated report. You can also add recipient groups.
You can enter as many users as needed.
LogicMonitor attempts to match values as you type.
The recipients you add to the report are emailed a generated report based on the format you configured and the email associated with the username.
- Do one of the following to save the report:
- Select Save.
The report saves to the Report Group you selected.
If you configured the report to generate on a schedule, the report generates and sends to recipients based on the frequency you configured. - Select Save and Run.
The report saves to the Report Group you selected and generates a report based on the format you configured.
If you configured the report to generate on a schedule, the report generates and sends to recipients based on the frequency you configured.
- Select Save.
Overview
You can schedule any report to be auto-delivered via email from the report configuration dialog.
When the size of the report exceeds 20 Mbytes, the email attachment delivered will be in a compressed gzip (.gz) file format. Recipients will need to uncompress these attachments. This can be done using a tool such as WinZip, 7-Zip, or gunzip if uncompression is not automatic through their email program or operating system.
Note: In addition to being generated and emailed according to the configured report schedule, a report will also be generated and emailed at the time a schedule is added or updated (assuming it hasn’t been generated within the last 24 hours). Manually running a report, however, will not trigger email delivery; only updates to its scheduling configurations.
Configuring Auto-Delivery
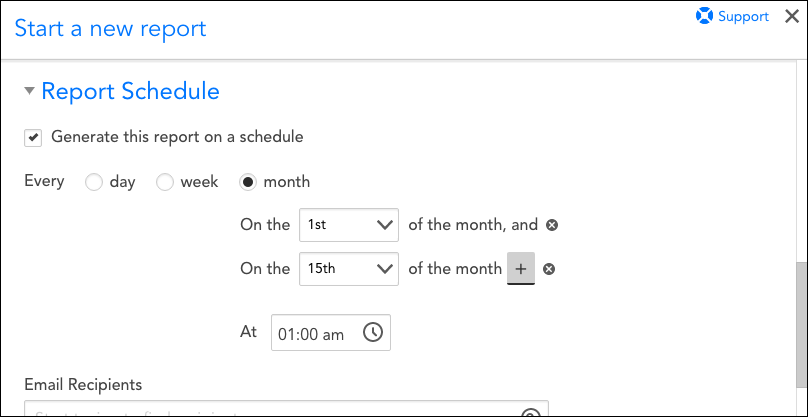
To configure auto-delivery, check the Generate this report on a schedule option available under the Report Schedule section of the report configuration dialog. As shown and discussed next, several additional settings appear when this option is selected.
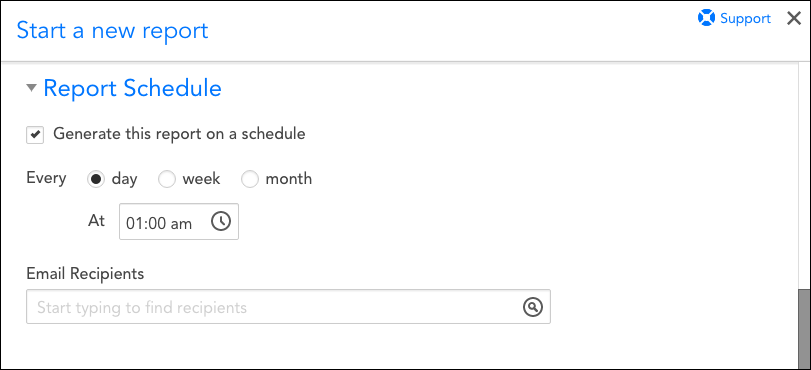
Note: For information on configuring other areas of the report configuration dialog, see Creating and Managing Reports.
Every
Select how often the report should be generated and delivered. Choose from once a day, one or more days per week, or one or more days per month.
- Every day: Set the time at which it will be delivered.
- Every week: Set the day(s) of the week and time at which it will be delivered.
- Every month: Set the date(s) of the month and time at which the report will be delivered. To select more than one date per month, click the + icon located to the right of the date selection drop-down.
Email Recipients
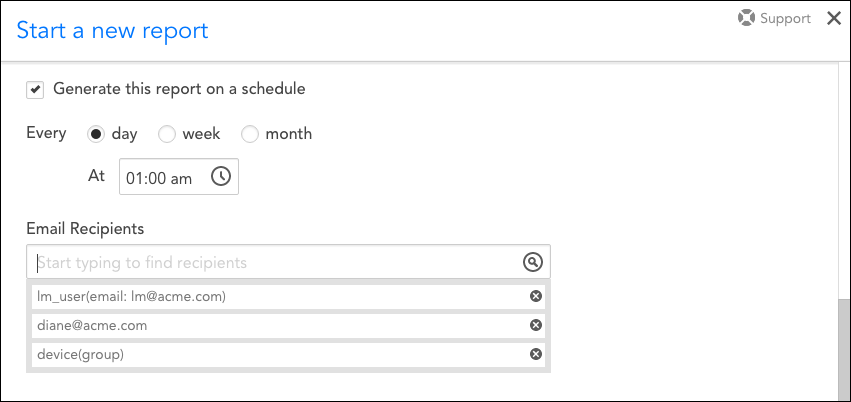
Add the recipient(s) that will receive the report via email. As you type, LogicMonitor will auto-suggest user accounts, e-mail addresses, and recipient groups that exist in the system. You can optionally add external email addresses manually.
Note: Your level of permissions determine which, if any, users/recipient groups are available for selection when assigning email recipients.
Overview
The SLA report calculates the percentage of time in which acceptable service levels were maintained for the resources or websites included in the report. Acceptable service levels are defined in the report’s configurations.
How Is the SLA Report Calculated?
For each individual website or resource included in your SLA report, the baseline calculation is quite simple. It is the amount of time the resource or website actually met its acceptable service levels as compared to the amount of time covered by your SLA.
However, there are times when the individual SLA value for a website or resource is aggregated with the SLA values of other website(s) or resource(s) monitored by the report. This is the case when (a) multiple websites or resources are selected as a single metric or (b) when the SLA report is providing an overall, single SLA summary value for all websites or resources monitored. For these cases, there are potentially two calculation options available to you, depending upon whether you’re measuring performance across websites or resources.
Measuring Performance Across Websites
When running the SLA report for websites, the aggregated SLA value is calculated by averaging the percentage of time in which acceptable service levels were maintained by the individual websites. For example, consider that an SLA report is measuring the availability of the following four websites over a one-day period:
- Website A: Unavailable from 8-9am; 95.83% (23/24 hours)
- Website B: Unavailable from 9-10am; 95.83% (available 23/24 hours);
- Website C: No unavailability; 100% (24/24 hours)
- Website D: Unavailable from 8:30-9:30am; 95.83% (23/24 hours)
The overall aggregated SLA value for websites A, B, C and D is 96.87%, which is the average of their individual availabilities.
Measuring Performance Across Resources
When running the SLA report for resources, there are two calculation methods available for determining the aggregated SLA value. One of the methods is the one described in the previous section (i.e. averaging the percentage of time in which acceptable service levels were maintained by the individual resources).
The other calculation method measures the percentage of time in which all resources concurrently met their individual thresholds for acceptable service levels. For example, consider that an SLA report is measuring performance thresholds for the following four resources over a one-day period:
- Resource A: Fell below defined threshold of acceptable service level from 8-9am
- Resource B: Fell below defined threshold of acceptable service level from 9-10am
- Resource C: Met acceptable service level threshold all day
- Resource D: Fell below defined threshold of acceptable service level from 8:30-9:30am
Based on these metrics, the total window of time in which at least one resource was performing at a subpar level was from 8-10am, which evaluates to an overall SLA value of 91.67%. If these four resources were calculated using the average approach of the other calculation method, the overall SLA value would be 96.87%
Configuring an SLA Report
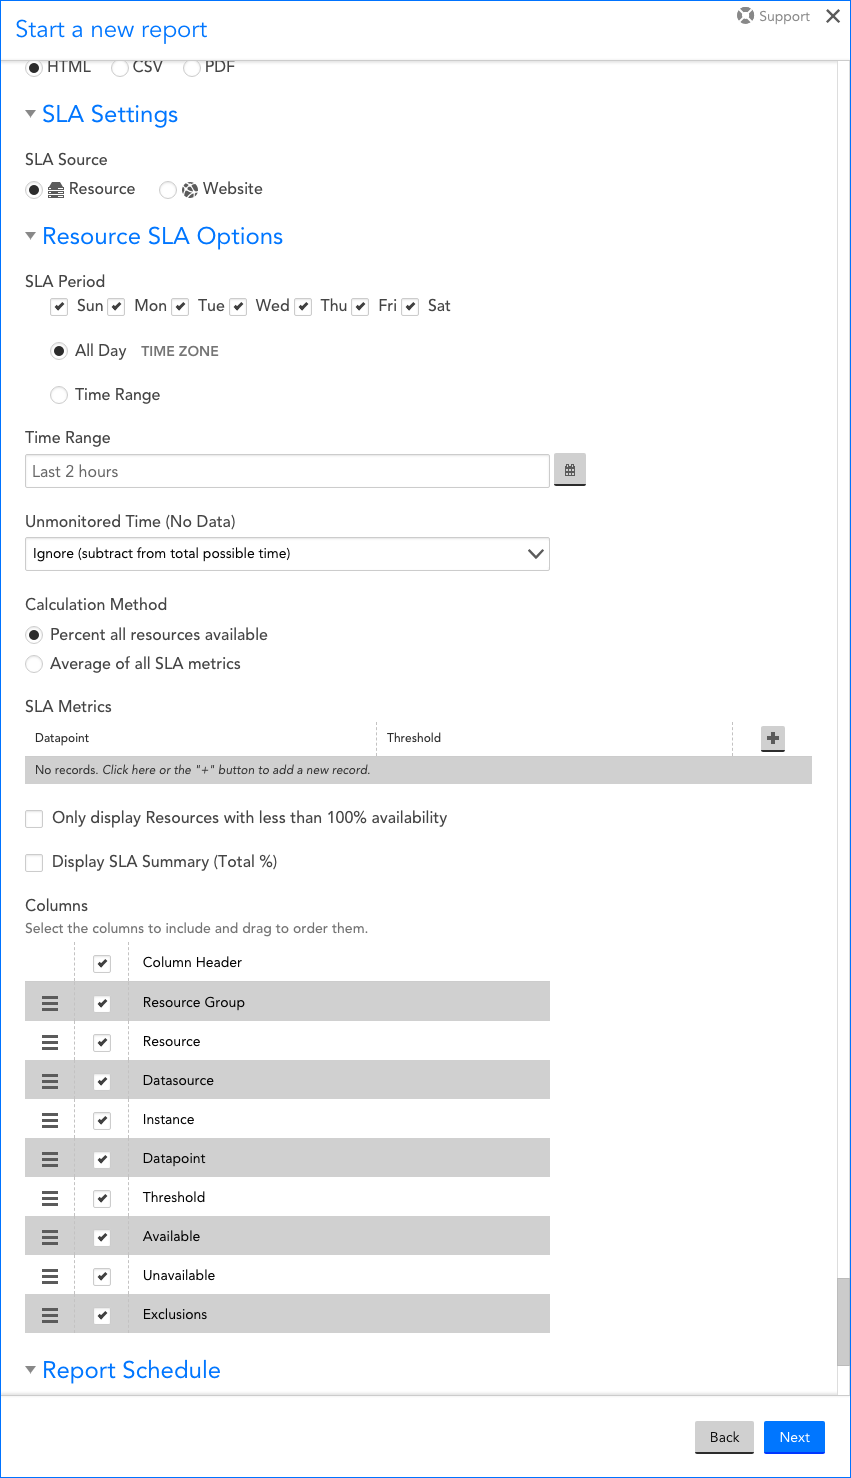
To configure an SLA report, select Reports | Add | Report | SLA Report. A report dialog appears that allows you to configure various report settings.
Configuring Settings Common to All Report Types
The first four settings that are found in the report dialog (Title, Description, Group, and Format), along with the final setting (Generate this report on a schedule), are universal to all report types. To learn more about these global report settings, see Creating and Managing Reports.
Configuring SLA Report Settings
In the SLA Report Settings area of the report configuration dialog, shown and discussed next, specify settings particular to the SLA report.
SLA Source
For the SLA Source option, indicate whether the report will monitor SLAs for a set of resources or websites.
SLA Period
Using the configurations under this heading, indicate the period (days and time) in which the SLA is in effect. Select the All Day option if your SLA spans all 24 hours of the selected days. If the SLA does not cover days in their entireties, select the Time Range option to indicate a window of time, down to the quarter hour, within each day that the SLA spans.
Note: This section should reflect the time range of your actual SLA, not the time range of the report. The report’s time range is determined in the next configuration.
Time Range
Click your cursor into the Time Range field to display the options available for setting a predefined or custom duration of time for which data will be pulled for this report.
Unmonitored Time (No Data)
Note: This field is only available if you previously selected “Resource” as the option for the SLA Source field.
The Unmonitored Time (No Data) field allows you to establish what impact, if any, the amount of time in which no data was reported for the resources has on the SLA calculation. There are three options available for selection from this field’s dropdown menu:
- Ignore (subtract from total possible time). This option does not include unmonitored time in its SLA calculations. For example, if your report’s time range spans 100 hours, of which there are five hours of missing data, the report will calculate the SLA value based on a total time range of 95 hours.
- Count as violation (subtract from uptime). This option will consider any unmonitored time as a violation against your SLA. For example, if your report’s time range spans 100 hours, of which 15 of those hours represent performance that doesn’t meet SLA thresholds and five of those hours represent no data received, the report will calculate SLA violation time as 20 hours, which results in an overall SLA value of 80%.
- Count as available (add to uptime). This option will consider any unmonitored time as meeting SLA requirements. For example, if your report’s time range spans 100 hours, of which 15 of those hours represent performance that doesn’t meet SLA thresholds and five of those hours represent no data received, the report will calculate SLA violation time as 15 hours, which results in an SLA value of 85%.
Calculation Method
Note: This field is only available if you previously selected “Resource” as the option for the SLA Source field.
As detailed in the How Is the SLA Report Calculated? section of this support article, there are two calculation methods available when aggregating SLA values among multiple resources. The Percent of all resources available option measures the percentage of time in which resources concurrently met their individual thresholds for acceptable service levels; the Average of all SLA metrics option averages the percentage of time in which acceptable service levels were maintained by the individual resources.
Specifying Resources or Websites Included in the SLA Report
The configurations you see in this area vary depending on whether you selected “Resource” or “Website” for the SLA Resource field.
Specifying Resources and Their Metrics
Click the + icon located at the top right of the Datapoint table to identify the datapoints that will be tracked by this report (along with corresponding SLA thresholds that must be met). From the dialog that expands, configure the following fields and options:
- Use the Group, Resource, DataSource, Instance, and Datapoint fields in combination to add a single metric. Multiple metrics can be added, but they must be configured and saved one at a time.
Note: If a single metric applies to multiple resources, the report will aggregate the SLA value for that metric using the calculation method selected in the Calculation Method field.
- For each datapoint, specify the DataSource SLA Threshold using the dropdown operator menu and field immediately to the right of it. If you’d like to refer to the global thresholds (warning, error, and critical) already established for this datapoint for help in determining the threshold for this report, click the View current Global Thresholds (for reference) hyperlink to display them.
- Check the Exclude SDT periods checkbox to remove scheduled downtime (SDT) from the SLA calculations. SDT exclusion can be set at the resource or group level. If the exclusion is set at the resource level, then only SDT set at the resource level will be excluded from the SLA calculation. Any SDT set at the group level for those resources will NOT be excluded in this case. If the exclusion is set at the group level, then only SDT set at the group level will be excluded from the SLA calculation. For example, consider that you have SDT set for a group from 8-9pm each Wednesday. One of the resources in the group additionally has SDT set for 5-6pm each Thursday. If this option is configured for the resource level, the Thursday 5-6pm SDT will be excluded. If this option is configured for the group level, the Wednesday 8-9pm SDT period will be excluded.
Check the Only display Resources with less than 100% availability option to exclude resources that achieved a 100% SLA value from the report’s display output, allowing you to better focus in on areas of improvement. This option only affects the report’s display, not its calculations.
Check the Display SLA Summary (Total %) if you would like the SLA report’s output to include an overall, single SLA summary value for all websites or resources monitored. This summary value will be calculated using the method selected in the Calculation Method field.
Specifying Websites
Click the + icon located at the top right of the Website table to identify the websites that will be tracked by this report. Use the Group and Website fields in combination to add a website metric. Multiple metrics can be added, but they must be configured and saved one at a time.
Check the Exclude SDT periods checkbox to remove scheduled downtime (SDT) from the SLA calculations.
Columns
Uncheck any columns that you would like to exclude from the report. To reorder columns, grab the icon to the far left of a column name and drag and drop the column into its new position.
Overview
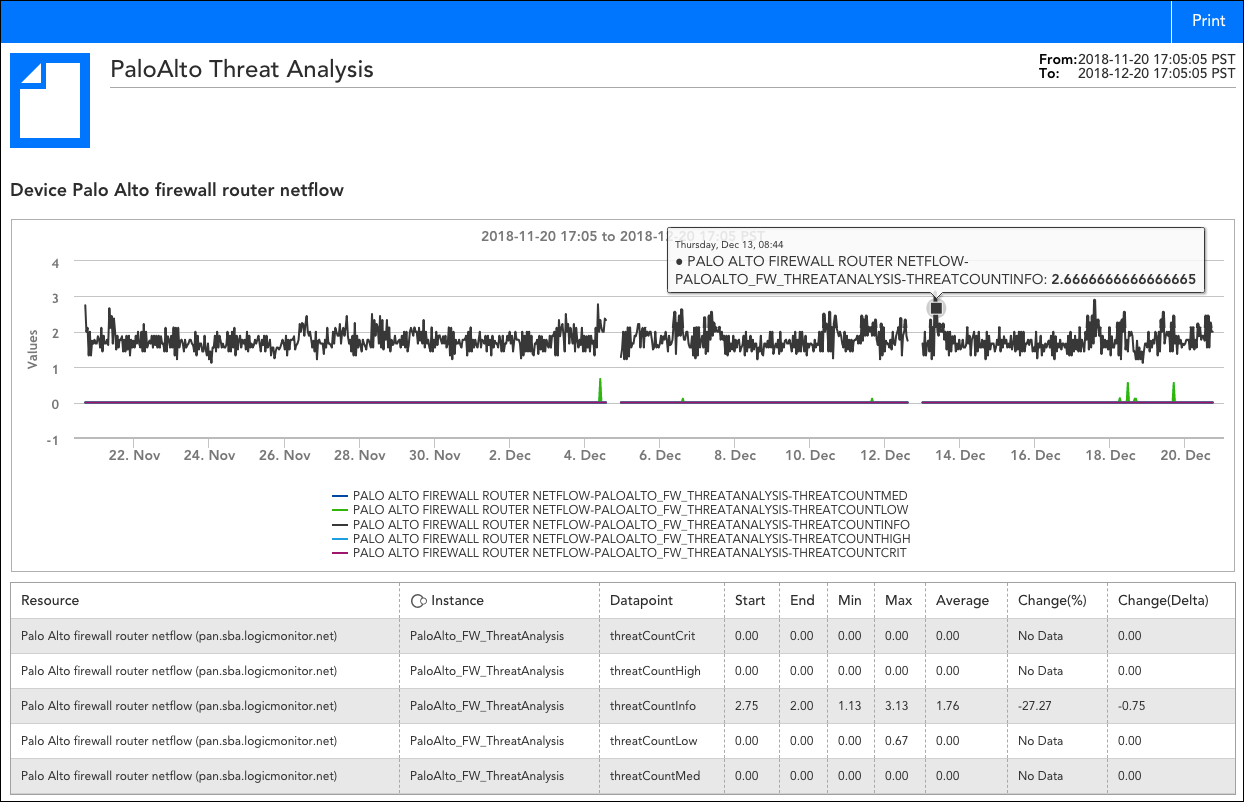
The Resource Metric Trends report can display minimum, maximum, average, change, and sum values for any metric (datapoint) that is available for a resource (e.g. device, cloud resource) or group of resources. This information is presented in a tabular data format and can additionally include graphs per resource, DataSource or datapoint. Because the flexibility of this report allows you to view graphs and numerical data for multiple resources, you may find it useful for quickly reviewing recent performance metrics across a group of resources.
Note: If you’re looking for a report on CPU trends for a group of devices, consider creating the Server CPU report instead.
Configuring a Resource Metric Trends Report
To configure a Resource Metric Trends report, select Reports | Add | Report | Resource Metric Trends. A report dialog appears that allows you to configure various report settings.
Configuring Settings Common to All Report Types
The first four settings that are found in the report dialog (Title, Description, Group, and Format), along with the final setting (Generate this report on a schedule), are universal to all report types. To learn more about these global report settings, see Creating and Managing Reports.
Configuring Resource Metric Trends Report Settings
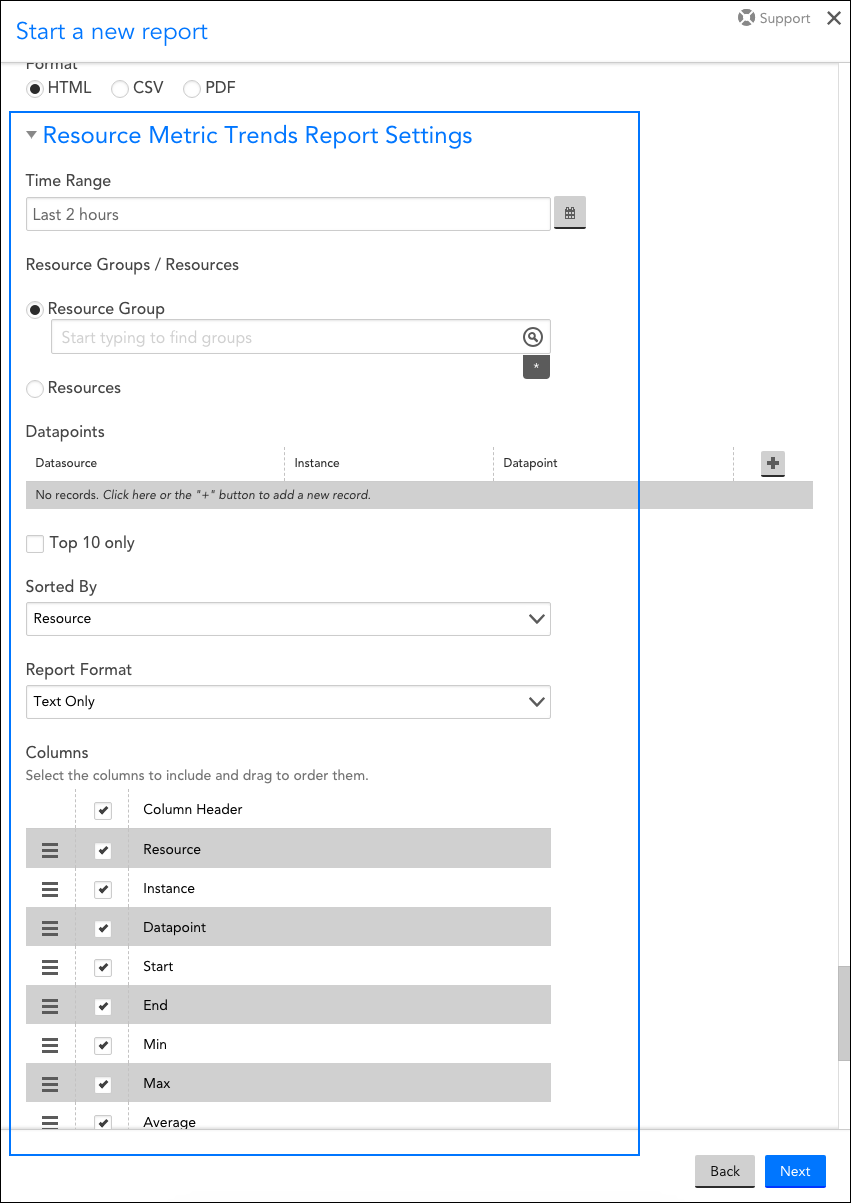
In the Resource Metric Trends Report Settings area of the report configuration dialog, shown and discussed next, specify the metrics you would like to track, as well as the resources for which you would like to track them.
Resource Groups / Resources
From the Resource Groups or Resources field, limit the resources to which this report will apply by designating one or more resource groups or resources. You can use explicit names or glob expressions in these fields.
Note: Multi-glob lookup is available in this field. You can select a combination of both glob and distinct values to specify your resources/resource groups. For more information on LogicMonitor’s support of glob, see Using Glob throughout your account.
Datapoints
Define the datapoints to include in your report. These datapoints will be pulled only from the resource(s) you specified in the previous field.
You can enter datapoint calculations into the Datapoint field, for example: InOctets*8/1000/1000. This is helpful when want to convert the units of your collected data, without defining a datapoint definition.
Top 10 only
Check this option to limit the report’s results to the top ten values.
Scale by units of 1024
By default, the graph is scaled by units of 1000. For certain types of reports, such as storage capacity in bytes, you may want to check this option to scale the units by 1024.
Sorted By
By default, your results will be sorted by resources, but you can use the Sorted By field’s dropdown menu to sort based on instance or datapoint instead.
Report Format
Select whether the report should be text only or include embedded graphs (e.g. one graph per resource, DataSource, Instance, or datapoint).
Columns
Uncheck any columns that you would like to exclude from the report. The columns included in the report determine the types of values (e.g. minimum, maximum, average, etc.) that display for datapoints. To reorder columns, grab the icon to the far left of a column name and drag and drop the column into its new position.
Sample Output
Overview
The Resource Group Inventory report displays the resource (e.g. device, cloud resource) count in each device group (and optionally subgroup), along with any other properties set at the group level. You may find this report useful for at-a-glance views of the number of resources across multiple groups in your LogicMonitor account, or if you want to compare group property values.
Configuring a Resource Group Inventory Report
To configure a Resource Group Inventory report, select Reports | Add | Report | Resource Group Inventory. A report dialog appears that allows you to configure various report settings.
Configuring Settings Common to All Report Types
The first four settings, along with the final setting, that are found in the report dialog (Title, Description, Group, Format, and Generate this report on a schedule) are universal to all report types. To learn more about these global report settings, see Creating and Managing Reports.
Configuring Resource Group Inventory Report Settings
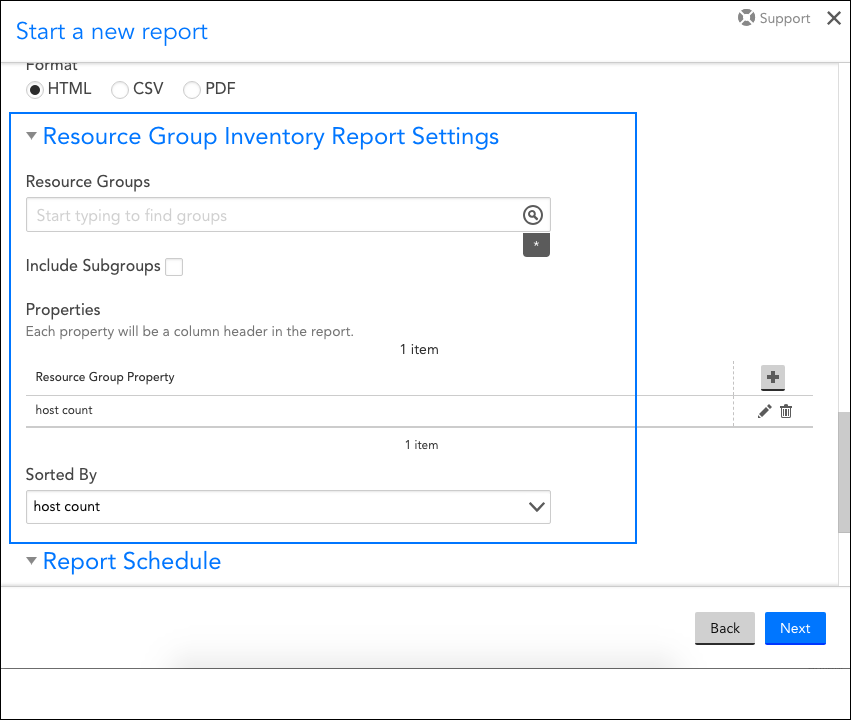
In the Resource Group Inventory Report Settings area of the report configuration dialog, shown and discussed next, specify the properties you would like to return, as well as the groups for which you would like to return them.
Resource Groups
From the Resource Groups field, designate one or more resource groups you would like to inventory.
Include Subgroups
Select the Include Subgroups checkbox to include subgroups of the selected groups in the report’s output.
Properties
From the Properties area of the dialog, choose one or more properties whose values you would like returned for each group/subgroup. By default, the host count property, which displays the number of hosts within the designated groups, is included in this report.
Sorted By
From the Sorted By field’s dropdown menu, select the property that should determine the sort order of the results.
Overview
The Resource Inventory report provides a way to report on any of the defined or discovered properties of a resource (e.g. device, cloud resource) in LogicMonitor. For example, you could report on memory size, OS level, architecture, etc. across a group of devices. Or, you could report on current stats (e.g. state, Id, IP address, region, etc.) for your cloud resources.
Configuring a Resource Inventory Report
To configure a Resource Inventory report, select Reports | Add | Report | Resource Inventory. A report dialog appears that allows you to configure various report settings.
Configuring Settings Common to All Report Types
The first four settings that are found in the report dialog (Title, Description, Group, and Format), along with the final setting (Generate this report on a schedule), are universal to all report types. To learn more about these global report settings, see Creating and Managing Reports.
Configuring Resource Inventory Report Settings
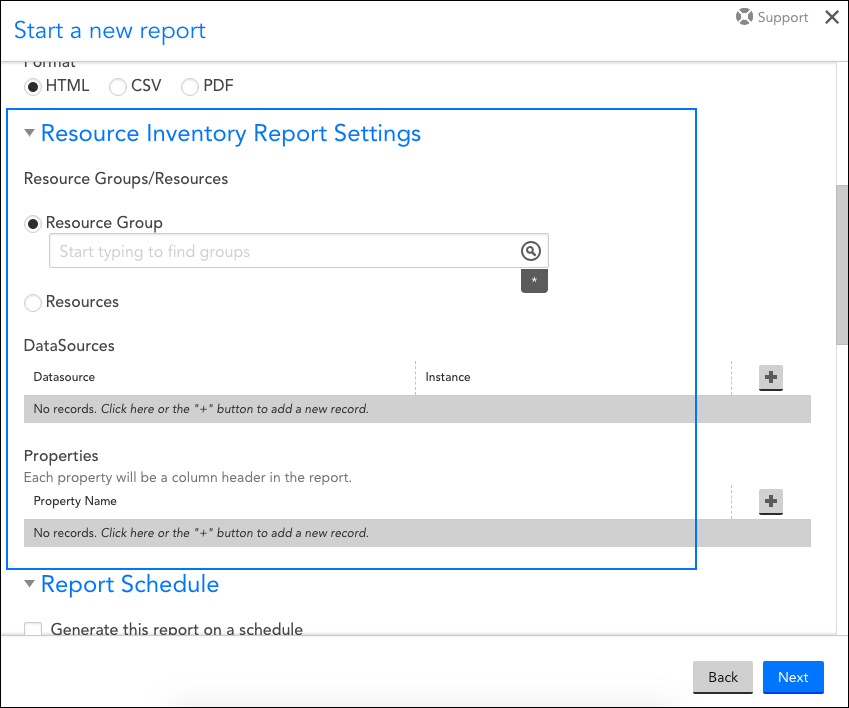
In the Resource Inventory Report Settings area of the report configuration dialog, shown and discussed next, specify the properties you would like to return, as well as the resources and/or instances for which you would like to return them.
Resource Groups/Resources
From the Resource Groups or Resources field, limit the resources to which this report will apply by designating one or more resource groups or resources. You can use explicit names or glob expressions in these fields.
Note: Multi-glob lookup is available here. You can select a combination of both glob and distinct values to specify your resources/resource groups. For more information on LogicMonitor’s support of glob, see Using Glob throughout your account.
DataSources
From the DataSources area of the dialog, optionally enter one or more DataSource/instance pairs to drill down to instance-level properties for the resource group(s) or individual resource(s) selected.
Properties
From the Properties area of the dialog, choose one or more properties whose values you would like returned for each group, resource, or instance. Note that not all resources will support the same properties.
Sorted by
From the sorted by field’s dropdown menu, select the property that should determine the sort order of the results.
Overview
The Alerts Thresholds report allows you to easily see the datapoint thresholds in effect across multiple resources, and shows you where you have overridden global thresholds or disabled alerting at levels other than the global level. You may find this report useful for reviewing:
- The various static and dynamic thresholds in place for a resource or resource instance
- Where global threshold defaults have been overridden by thresholds set at deeper levels in the Resources tree (resource group, resource, or instance level)
- How changes to a datapoint threshold affect other resources
- Which resources have alerting disabled (at the resource group, resource, instance or datapoint level)
Configuring an Alerts Thresholds Report
To configure an Alert Thresholds report, select Reports | Add | Report | Alerts Thresholds. A report dialog appears that allows you to configure various report settings.
Configuring Settings Common to All Report Types
The first four settings, along with the final setting, that are found in the report dialog (Title, Description, Group, Format, and Generate this report on a schedule) are universal to all report types. To learn more about these global report settings, see Creating and Managing Reports.
Configuring Alerts Thresholds Report Settings
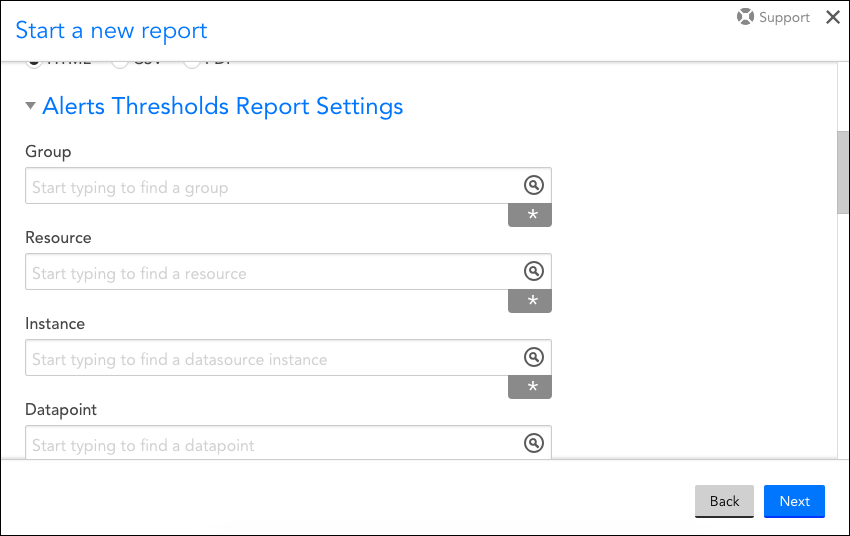
In the Alerts Thresholds Report Settings area of the report configuration dialog, shown and discussed next, specify settings particular to the Alerts Thresholds report.
Group
From the Group field, indicate the group that has resources for which you would like to view thresholds. You can use an explicit name or glob expression in this field, or you can wildcard the entire field to include all groups (i.e. not filter output by group). For more information on LogicMonitor’s support of glob, see Using Glob throughout your account.
Resource
From the Resource field, indicate the resource that has datapoints you would like included in the report. As with the Group field, you can use an explicit name or glob expression in this field, or you can wildcard the entire field to not filter the report’s datapoint threshold output by resource.
Instance
From the Instance field, indicate the instance that has datapoints you would like included in the report. As with the prior two configurations, you can use an explicit name or glob expression in this field, or you can wildcard the entire field to not filter the report’s output by instance.
Datapoint
From the Datapoint field, indicate the datapoint you would like included in the report. As with the prior three configurations, you can use an explicit name or glob expression in this field, or you can wildcard the entire field to include all datapoints that meet the prior configurations.
Sorted By
By default, your results will be sorted by resources, but you can use the Sorted By field’s dropdown menu to sort based on instance or datapoint instead. If “Datapoint” is the selected sorting method, note that the metric’s average is used for sorting.
Only Show Custom Thresholds
When checked, the Only show custom thresholds option limits the report output to only those thresholds whose values deviate from default global thresholds. The level (group or instance) on which these customized thresholds were set will also be displayed.
Note: If you’d like to generate this report for the purpose of highlighting all resources/instances across your portal for which custom dynamic thresholds have been set, check this option and wildcard the Group, Resource, Instance, and Datapoint fields. After running the report, sort the resulting output by the EffectiveThreshold column.
Columns
There are more than 15 columns of data that can be included in the report’s output; by default, LogicMonitor includes five of them. Uncheck those that you would like excluded from the report, and check any others that you would like included. To reorder columns, grab the icon to the far left of a column name and drag and drop the column into its new position.
The Alert report returns a list of all alerts, which can include every individual alert that matches the parameters or a count of the number of times each alert occurred during a specified time period. By reviewing these non-critical alerts in a report, you can reduce the number of alerts you need to be notified of and gain additional insight by seeing alerts in context with other alerts.
You can use an Alert report to do the following:
- Review all the alerts for those resources in scheduled downtime (SDT) and address potential issues before SDT ends.
- Identify alerts that have been active for a long period of time and then tune your thresholds to reduce future occurrences of similar alerts.
- Evaluate how long it takes for users to acknowledge alerts.
- Deliver a daily report that includes all alerts from the past 24 hours.
The report can show you how much a threshold was exceeded, enabling you to determine which thresholds need adjusting.
In addition, You can use this daily report to determine if alert notifications should be routed to email, text, and so on, and adjust your alert rules. - View historical SDT information for your resources to understand whether an alert was generated for a specific resource that was put into SDT for the configured timeframe of the report.
When you configure an Alert report, you configure settings that determine the alerts that are included in the report. For example, you can exclude or include preexisting alerts. A Report Preview displays as a panel to provide you with a preview of what the report will look like when generated. It displays all the alerts that match the settings you configured. You can apply additional filters in the Report Preview to further filter the alerts as needed.
In addition, you can curate an Alert report directly from the Alerts page using the filters to display the alerts you need. For more information, see Managing Alerts from the Alerts Page.
You can choose to generate the report on a schedule or ad-hoc.
Requirements for Configuring an Alert Report
To configure an Alert report, you need a user with “View” and “Manage” for the Reports role permissions. For more information, see Reports Role Permissions.
Configuring an Alert Report
- In LogicMonitor, navigate to Reports.
- Select
 > Add Report > select Add for the Alert report.
- In the Name field, enter a name for the report.
Report names cannot include the operators and comparison functions used in LogicMonitor’s datapoint expression syntax. - (Optional) In the Description field, enter a description for the report.
For example, you can enter a description of the specific purpose of the report. - From Report Group, select the report group where your report is stored.
Matching groups display as you type, and you can select the group from the list. - From Format, select the type of format for the output of the report.
You can select HTML, PDF, or CSV.
- To include alerts prior to the specified date range, but meet all other criteria, toggle Include preexisting alerts.
The Report Preview panel updates to include or remove alerts based on status of the toggle. - To add a column to the Alert report that details the frequency that an alert occurred during the report time range, toggle Summarize alert counts.
This enables you to sort the report by “Alerts” to see the top sources of alerts. You can remediate highly impactful issues or tune datapoint thresholds as needed.
- From Sort By, select an option to sort the alerts.
Note: The options in the Sort By settings are dependent on the status of the Summarize alert counts setting.
The Report Preview panel updates to reflect the sorting option.
Note: Selecting “Severity” automatically sorts by the time the alert began in descending order, similar to the Alerts page. This enables you to sort on both the alert severity level and the time the alert began.
- To sort the alerts, do one of the following:
- To sort the alerts in ascending order, select ACS.
- To sort the alerts in descending order, select DECS.
- In Report Schedule settings, do the following to configure the report to generate on a schedule:
- Toggle Generate this report on a schedule.
- From Frequency, select how frequent you want the report to generate, and then configure when you want the report to generate.
For example, if you configure the report to generate daily, you can choose the time to generate the report each day. If you configure the report to generate weekly, you can choose the day of the week and time to generate the report for the selected date. If you configure the report to generate monthly, you can configure the day of the month and time to generate the report.
Each frequency option provides you a setting for selecting the time zone. - In Recipients Email, enter the name of the user you want to receive the generated report. You can also add recipient groups.
You can enter as many users as needed.
LogicMonitor attempts to match values as you type.
The recipients you add to the report are emailed a generated report based on the format you configured and the email associated with the username.
Note: When configuring a delivery schedule, your report is generated and emailed immediately if it has not been generated within the last 24 hours. After that, emailed delivery only occurs according to the schedule.
Note: A configured maximum value of DataSource instances can require report delivery. If this maximum value is exceeded, a prompt displays prompting you to enter email addresses for report delivery to avoid display delay rather than attempting report viewing.
- In the Report Preview panel, use the following to include or exclude alerts as needed:
- Severity Levels—You can sort the report based on the severity level (for example, “Critical,” “Error,” or “Warning”).
Note: Sorting the Alerts report by severity automatically enables secondary sorting by time began (in descending order). This secondary sorting functionality is similar to the functionality available from the Alerts page, allowing you to simultaneously sort on both the alert severity level (primary sort) and the time the alert began (secondary sort). For more information, see Managing Alerts from the Alerts Page.
- Filters—You can select the filters for the alerts displayed in the report using a variety of criteria (for example, resource, instance, datapoint, severity level, and so on). As you set filter criteria, the alerts displayed in the Report Preview automatically updates.
Recommendation: A maximum of 30,000 alerts are returned in a report. If more than 30,000 alerts match your filter criteria, the resources or groups with the most alerts are automatically excluded from the report. To avoid the issue, ensure to sufficiently narrow your filters.
- Clear—You can clear the applied filters.
- Time Range—You can select the duration of time you want the report based on.
- Column Settings—You can reorder columns or add custom columns as needed for your report.
Note: LogicMonitor supports the addition of columns that represent host properties only or custom tokens.
- To save the report, do one of the following:
- The report saves to the Report Group you selected.
If you configured the report to generate on a schedule, the report generates and sends to recipients based on the frequency you configured. - Select Save and Run
The report saves to the Report Group you selected and generates a report based on the format you configured.
If you configured the report to generate on a schedule, the report generates and sends to recipients based on the frequency you configured.
- The report saves to the Report Group you selected.
Threshold Limits
Adhoc Requests Thresholds (Limit for number of items)
| CSV | HTML | |
| 85000 | 30000 | 2000 |
Scheduled Requests Thresholds
| CSV | HTML | |
| 720000 | 30000 | 4000 |

