Uptime does not mean availability.
Understanding what these two metrics mean and what they don't can help managed service providers (MSPs) create accurate and transparent agreements.
Unlike physical stores and organizations that operate during set hours, the IT world never sleeps. Many believe that when an investment is made in technology, it should be accessible at all times—which is virtually impossible to guarantee. Since disruptions occur, organizations should evaluate the services needed to run operations smoothly. For example, what services are required during an IT service outage to ensure minimal disruptions?
This type of evaluation requires organizations to look at several metrics, including a system’s uptime (or reliability) and availability. Although these two metrics are often used interchangeably, they are different.
These two metrics lead us to the uptime myth. Uptime does not mean availability.
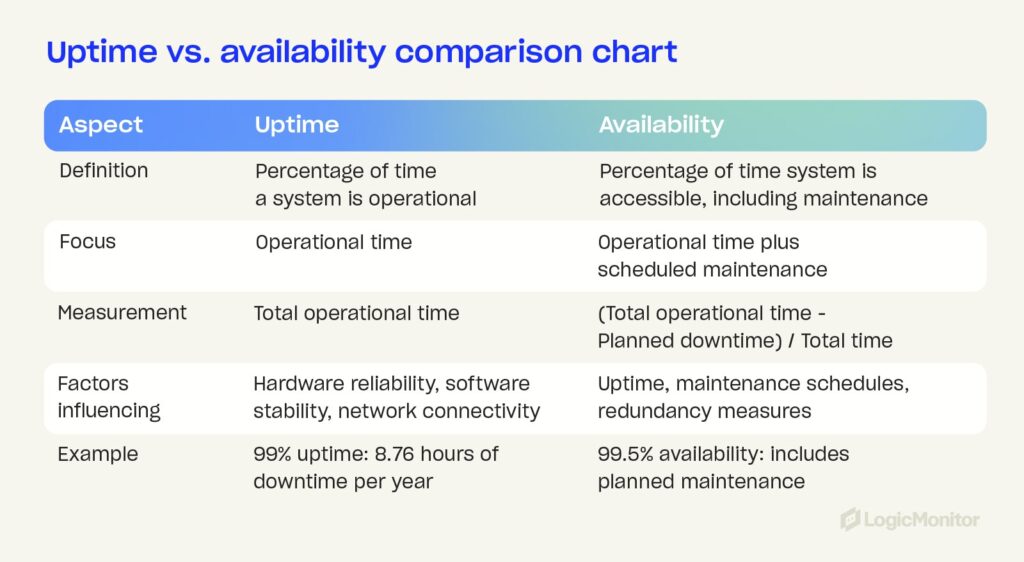
Uptime is the percentage of time a system is up and running. For example, if your app had no downtime in the past month, its uptime is 100%. With a two-hour outage, uptime drops to about 99.72%. Availability includes uptime and maintenance factors. Even if your app runs most of the time, planned maintenance can reduce availability.
Understanding what these two metrics mean and what they don’t can help managed service providers (MSPs) create accurate and transparent agreements.
Key takeaways
Uptime measures the percentage of time a system is operational under normal conditions.
Availability includes both uptime and scheduled maintenance, reflecting overall system reliability.
The watermelon effect describes metrics that appear satisfactory externally but reveal underlying issues upon closer inspection.
The concept of the Five Nines (99.999% uptime) is a significant selling point but challenging to achieve consistently.
What is uptime?
Uptime refers to the percentage of time a system is ready for operation under normal circumstances. This metric measures system, solution, or infrastructure reliability and commonly refers to a computer.
So, uptime is how long a machine has been working and available, expressed as a percentage of time. However, uptime does not necessarily mean all services and applications are available and ready for use.
When looking at a service-level agreement (SLA), guaranteed uptime is determined by past performance. However, it does not indicate what will happen in the future.
So yes, uptime can be an indicator of availability, but it is by no means a guarantee.
The Great Google Outage of 2014 is an excellent example of how 100 percent uptime is impossible. During this outage, service to Google applications, such as Google+ and Gmail, was down for 25-55 minutes, affecting approximately 10 percent of users. This example shows the conflict that exists between IT reality and consumer expectations. In the years to follow, moree outages occurred for Google, Facebook, Instagram, Azure, Salesforce, and more. Regardless, consumer expectations remain high.
IT professionals know that 100-percent uptime is a myth, which is why technology is so essential when aiming to deliver a level of service availability that ensures positive customer experiences.
What is availability?
In contrast, availability measures the proportion of time a system is accessible and operational, factoring in both uptime and scheduled maintenance. It reflects overall service reliability, accounting for active operation and planned downtime. This metric is critical when a team is working remotely.
Data shows that 16 percent of companies worldwide are now 100 percent remote, and since 99 percent of people would choose this option for the rest of their lives, even if it were just part-time, this percentage will likely rise in the coming years.
When comparing these two metrics, consider the difference between uptime and availability as OEE (overall equipment effectiveness) and TEEP (total effective equipment performance).
Understanding both of these metrics is important because incorrect assumptions can be costly. Viewing these metrics incorrectly will often lead to a poor experience. Service providers will meet the thresholds in their agreement, but the level of service will be lower than the customer expected.
This phenomenon is what’s referred to as the watermelon effect.
Outputs can meet defined targets, but the outcome is not achieved, leading to unhappy customers.
Diving deeper into the watermelon effect
The watermelon effect is the byproduct of thinking your IT metrics meet all requirements. However, the customer has a poor experience. Metrics look green on the outside, but on the inside, they are red.
SLA reports can look good, leaving the MSP happy. In contrast, customers aren’t satisfied and take their business elsewhere. Customer experience is essential, so an MSP should never underestimate the importance of support metrics.
The greater the level of transparency around the end-user experience, the easier it is for IT teams to focus on helping the end-users. Diving deeper into “red” metrics helps IT teams focus on what matters most. The best thing to do is lean in fast and hard, maximizing the time to fix problematic metrics before a project or quarter ends.
So, even if uptime metrics are met, it’s critical to consider customer experience if clients feel the value of a service is still missing. If engagement dips, the driving forces that encourage change drop, and businesses cannot accurately improve the matters that matter most to customers today.
The key is to identify issues before they become problems. An observability platform such as LogicMonitor can help achieve this.
“The watermelon effect shows metrics that look good on the outside but hide internal issues.”
The concept of the Five Nines
“Five Nines” refers to an uptime or availability rate of 99.999 percent. For example, the availability level “1 Nine” signals 90 percent uptime, which equates to 36.5 days of downtime per year. As availability levels increase, so does the associated uptime. When companies advertise “5 Nines” availability, this refers to an uptime measurement of 99.999 percent or approximately 5.26 minutes of downtime annually.
The Five Nines of uptime and availability is a significant selling point, which is why suppliers market a 99.999 percent uptime SLA. The issue is that, in some cases, each additional Nine added to an uptime or availability score does not necessarily guarantee greater reliability. It’s more important for customers to focus on the supplier or service provider based on their capabilities.
As a managed service provider, this is where you can shine.
For example, working with customers to develop a business continuity plan can make a difference when disruptions occur. To achieve the Five Nines, you must consider both equipment and personnel. Uptime and availability are determined by equipment not going down — these metrics are also affected by how quickly the response is when components fail. A business continuity plan is imperative.
This requires a proactive approach, such as using automated tools to better respond to unexpected events.
Although it’s important to be aware of critical metrics and company stats, SLAs can be reasonably meaningless when customers seek an accurate measurement tool. Companies must look at the bigger picture to gauge the value of an agreement. SLAs require a certain level of commitment. Boasting a 99.99 percent SLA is excellent, but this commitment is challenging to meet if there isn’t enough staff to assist when an issue occurs. So, the higher the number of Nines, the more resources are required.
This type of agreement often leads to a gray area; compensation is usually minimal or non-existent when issues occur. For example, cloud providers frequently provide customers with service credits if an outage occurs. However, these credits do not generally cover the costs. For example, an outage can negatively affect a company’s ability to trade or sell, resulting in lost revenue or a damaged reputation.
The “four-hour SLA response window” is another variable that businesses must be aware of when creating a disaster recovery plan. Suppliers often include this four-hour window in their terms and conditions, and while it sounds ideal, it doesn’t mean issues will be fixed within that window. Instead, it means the supplier will begin troubleshooting within that time. As a result, systems can be offline longer and often are.
SLAs vs. SLOs
To ensure outstanding customer service, some MSPs no longer offer guarantees on SLAs but instead set Service Level Objectives (SLOs). SLOs are internal goals measured by Service Level Indicators (SLIs), which track performance against objectives like uptime. For example, an MSP might aim for 99.96% uptime on hosted servers. This approach helps measure compliance and avoid disputes.
It’s also beneficial to create different SLAs for various workloads. High-priority services, such as cloud infrastructure, may require 5+ Nines for greater functionality, while low-priority workloads can tolerate lower performance levels. Essentially, SLAs are external commitments, often with penalties for non-compliance, while SLOs are internal targets that help manage service quality effectively.
How are uptime metrics and availability metrics tracked?
Calculating uptime and availability metrics is possible but can be challenging to measure accurately. Network uptime, for example, refers to the time a network is up and running. This is tracked and measured by calculating the ratio of uptime to downtime across 365 days, which is then expressed as a percentage.
Here is an example of how to calculate network uptime:
24 hours/day x 365 days/year = 8,760 hours/year
Number of hours your network is up and running per year ÷ 8,760 hours x 100 = Yearly uptime percentage.
So, if your network is down for 7 hours during the year, network uptime would be:
8,753 ÷ 8,760 = 0.9992
0.9992 x 100 = 99.9.2 percent
Again, uptime is directly related to past performance, which is why challenges arise. For example, a cloud solution with a 99.999 SLA commitment may be available. However, vulnerabilities and even cyberattacks can cause outages beyond the vendor’s control. If the service is affected for days, its availability will decrease.
When measuring availability, the measurement is driven by time loss.
When measuring reliability (uptime), the measurement is driven by frequency and the impact of failures.
Businesses can also use monitoring services to track server uptime consistently.
“Availability encompasses both uptime and scheduled maintenance, reflecting true system reliability.”
Case study: Stripe’s 99.9999% uptime during BFCM weekend
Overview: Stripe, a leading online payment service provider, achieved an impressive 99.9999% uptime during the 2022 Black Friday and Cyber Monday (BFCM) weekend. This is only ~31.5 seconds of downtime annually, demonstrating their exceptional infrastructure and meticulous planning.
Key achievements:
Platform uptime: Maintained 99.9999% uptime during BFCM, handling over 20,000 requests per second and processing more than $3 billion in transactions daily.
CTO insight: David Singleton, Stripe’s CTO, noted that even a 5-minute downtime could lead to significant revenue losses in the tens of millions.
Strategies for success:
Workload and capacity planning
Simulation and load testing: Stripe conducted extensive simulations and load testing to prepare for BFCM traffic. They determined the necessary infrastructure capacity by ramping up traffic and analyzing system behaviors.
Peak load handling: Their infrastructure handled over 20,000 requests per second during peak times, justifying the investment in robust capacity planning.
Availability and uptime SLA
Ambitious targets: While a 4 or 5 Nines uptime is common, Stripe exceeded expectations with six Nines during BFCM, maintaining a 90-day average uptime of five Nines.
Calculation of downtime: Using the power of 10 trick, Stripe calculated downtime to ensure they met their availability targets. For example, 3 Nines availability results in approximately 1.44 minutes of daily downtime.
API performance
PaymentIntents API: Achieved a 99.9999% success rate through rigorous stress testing, ensuring high responsiveness and minimal errors even under peak traffic conditions.
Lessons learned:
Workload and capacity planning: Essential for managing high traffic and ensuring system reliability.
Stress testing: Critical for identifying potential issues and ensuring the system remains robust under peak loads.
Setting ambitious targets: Helps in driving the commitment to high availability and reliability.
Conclusion: Stripe’s exceptional uptime during the BFCM period is a testament to their dedication to reliability and scalability. Their approach to workload planning, capacity testing, and ambitious availability targets sets a high standard for other companies facing similar challenges during peak traffic periods.
What other key metrics are relevant surrounding uptime and availability?
When customers evaluate MSPs, they do so using metrics. Relevant metrics are also monitored by those in management roles at MSP organizations. The goal is to ensure they maintain suitable performance levels and actively improve key performance indicators (KPIs).
Uptime is usually covered under service improvement metrics. However, several other metrics are worth paying attention to as an MSP. These metrics leverage data to highlight deciding factors between IT providers.
Renewal rate: Although this metric is not directly associated with uptime and availability, it does indicate whether customers are receiving the service they expect. If the renewal rate is low, it’s time to ask why. What expectations are not being met? While customers may choose not to renew for several reasons, seeking feedback is important.
Customer satisfaction: These scores are strong indicators of customer service quality. Again, diving deeper and focusing on metrics such as uptime and availability can provide greater insight into high-level metrics.
Mean time to notify (MTTN): This is the average amount of time that passes before an MSP notifies a customer about a service outage.
Mean time to repair (MTTR): This is the average time an MSP takes to resolve an issue. To remain competitive, strive for a low MTTR.
In that sense, uptime and availability are essential to consider, but they are not the be-all and end-all of MSP metrics. There is a bigger picture to consider when monitoring managed services.
Which is more important, uptime or availability?
Availability is becoming an important metric based on the transition toward remote work. While both metrics matter, especially when creating SLAs, they are only part of the overall picture. It is not just the metrics that are important, but more so what you do with them.
To improve service uptime and availability, it is essential that customers understand we do not live in a perfect world. Communication is crucial, especially concerning the needs and requirements of customers.
Continuous monitoring is vital in addition to running tests, implementing fail-safes, and working towards getting rid of failure points. Monitoring availability provides clarity, and that is how you build a highly available system.
Is uptime irrelevant?
Achieving 100 percent uptime is an unattainable objective. As discussed, uptime reflects past performance. In that sense, it is a valuable indicator of future availability, but it is not a guarantee — and 100 percent uptime remains virtually impossible.
That is why businesses must focus on project maintenance requirements and potential logistical delays. In doing so, they can more accurately forecast downtime to improve availability. To address consumer expectations, IT teams must anticipate problems and improve visibility to recover faster. Complete coverage, flexible integrations, and deep reporting will remain critical focus areas to achieve this.
Learn how the Minnesota Vikings leveraged LogicMonitor to achieve outstanding IT performance. Dive into the full case study to discover the strategies and solutions that can enhance your uptime and availability.
By Dan Ha
Disclaimer: The views expressed on this blog are those of the author and do not necessarily reflect the views of LogicMonitor or its affiliates.