LogicMonitor vs. Datadog
LogicMonitor combines full-stack visibility, AI-driven insights, and seamless integrations with transparent pricing, eliminating the complexity of Datadog’s modular setup. Optimize your hybrid IT effortlessly with LogicMonitor.
Trusted by leading companies


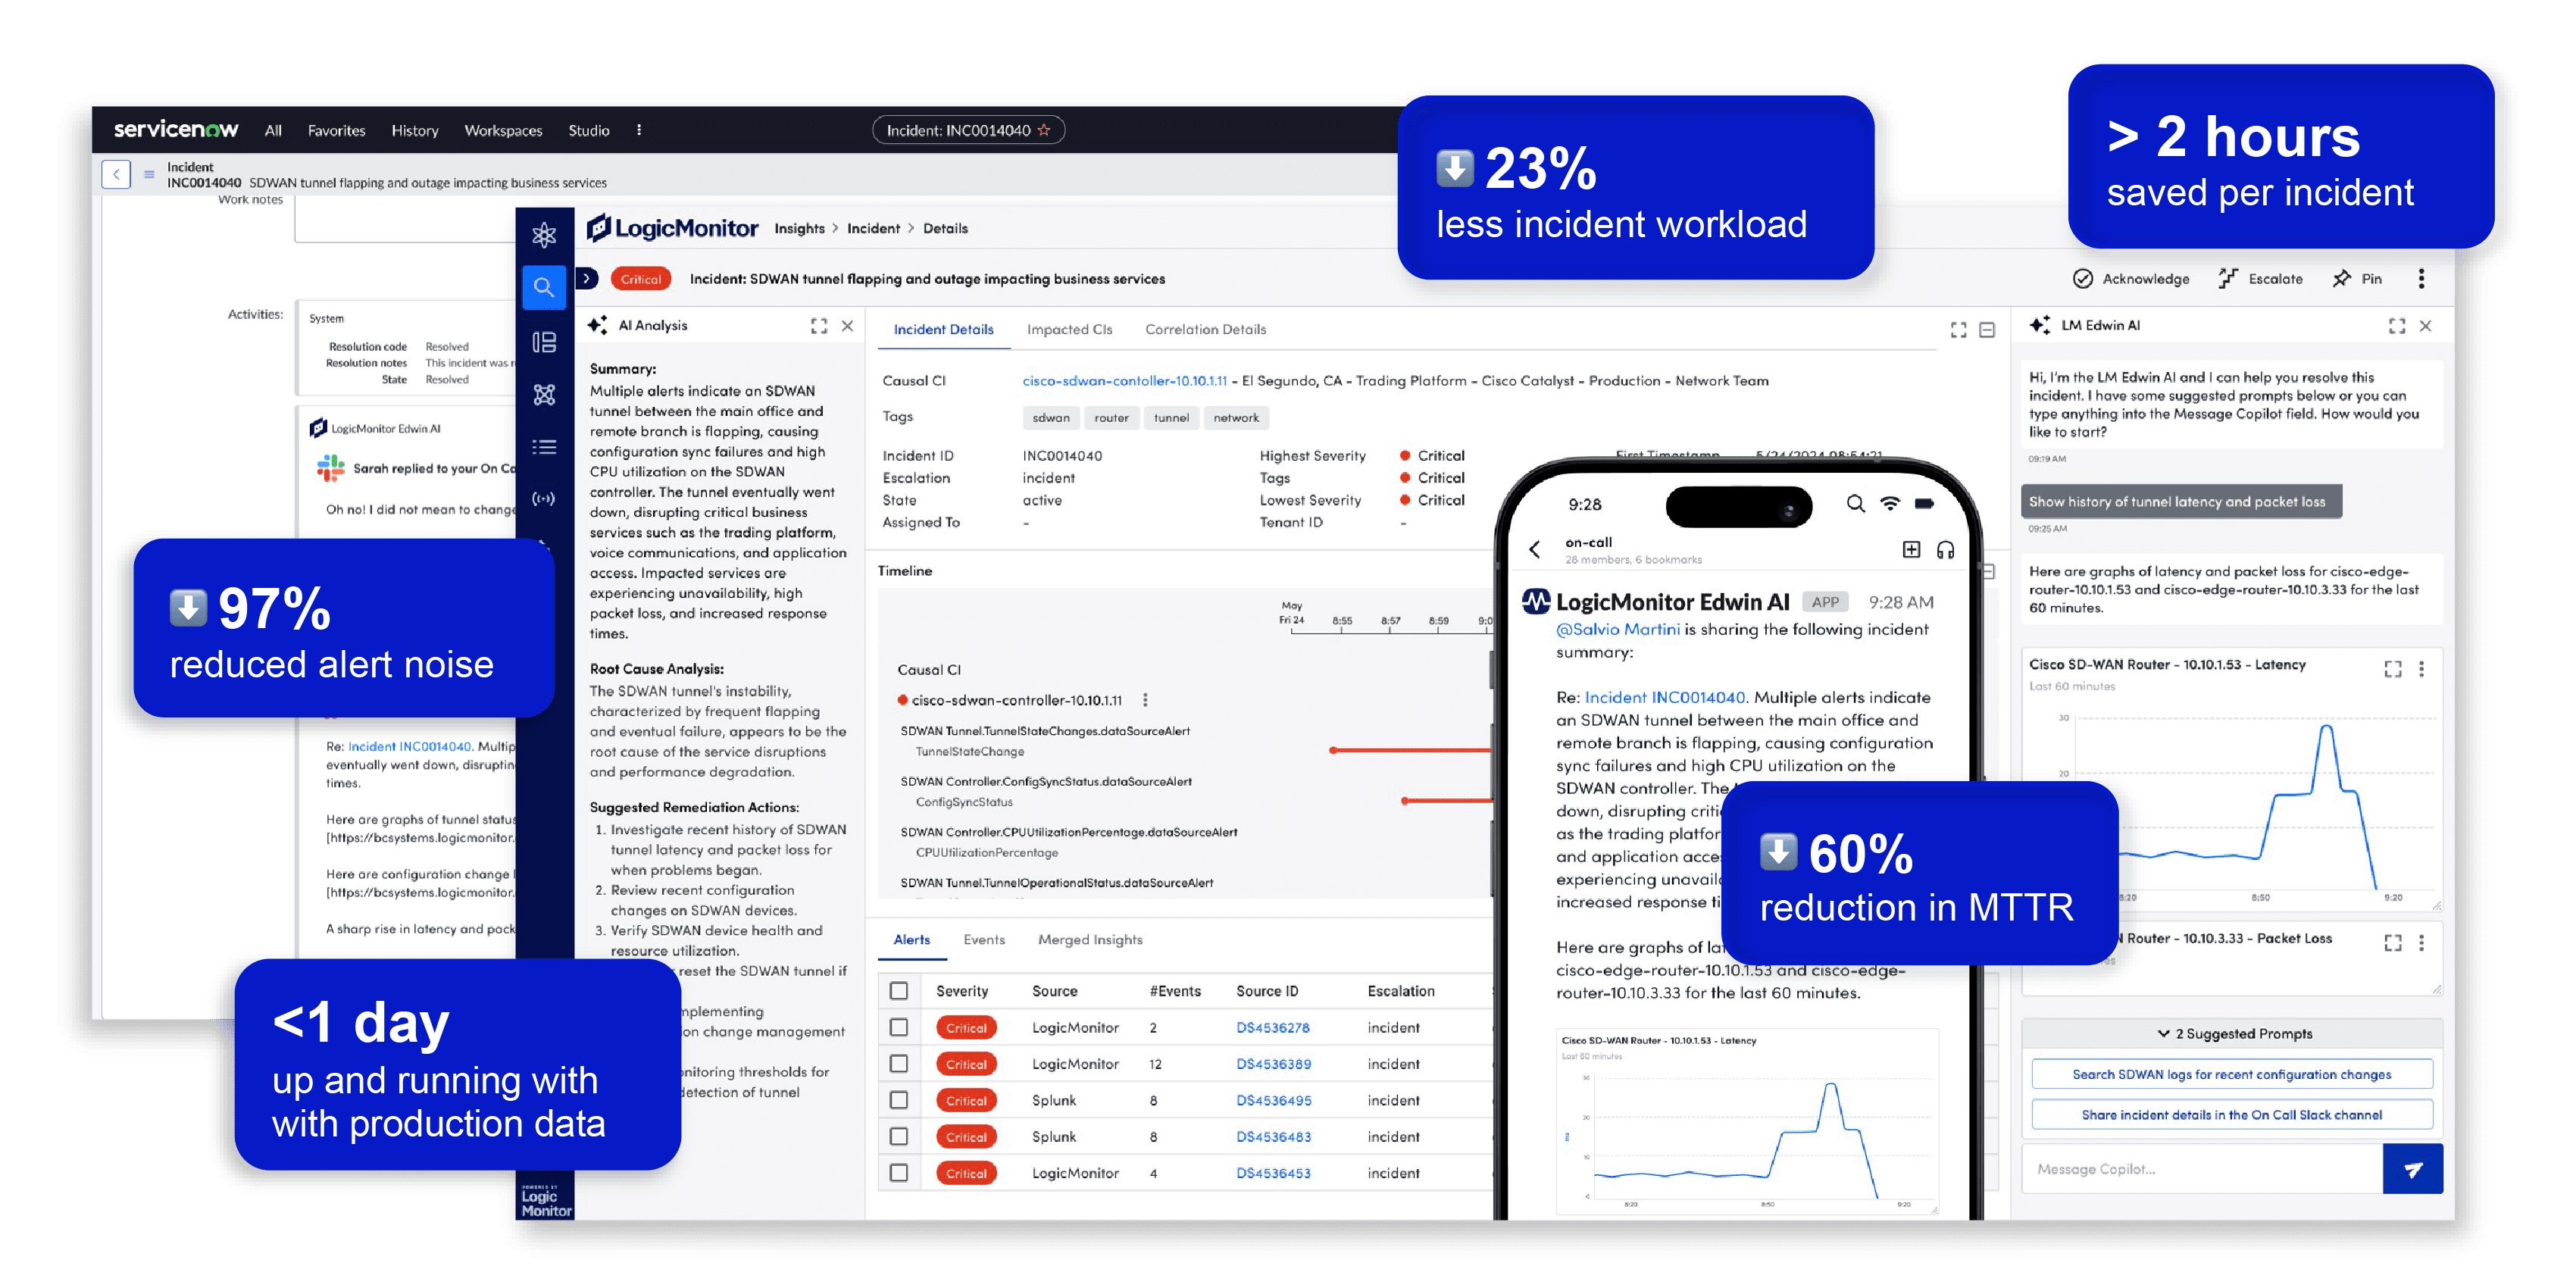
A hybrid observability platform powered by AI
LogicMonitor customers who have switched from Datadog have reduced alert noise by up to 95%, improved MTTR and reduced tool sprawl
- Single pane of glass with full context
- AI-assisted incident resolution and prevention
- Actionable insights tied to business outcomes
- Enterprise scale platform
- Lightweight agentless collectors
- 3,000+ integrations out-of-the-box

Benefits of LogicMonitor vs. Datadog
| LogicMonitor | Datadog |
|---|---|
|
Unified platform for hybrid IT monitoring. |
Multiple modules needed for full observability. |
|
Agentless setup simplifies deployment. |
Heavy reliance on agents adds complexity. |
|
Transparent, predictable pricing. |
Modular pricing with surprise overages. |
|
Effortless scalability for large environments. |
Per-host pricing becomes cost-prohibitive. |
|
3,000+ pre-built integrations. |
Integrations often need extra modules. |
|
AI-driven alerts for faster issue resolution. |
Lacks AI-powered root-cause analysis. |
|
Full-stack visibility across IT systems. |
Focused on applications, limited hybrid coverage. |
|
Pre-built dashboards for instant insights. |
Requires complex custom dashboards. |
|
Built-in log analysis with alert correlation. |
Manual log correlation adds overhead. |
|
Automated topology mapping. |
Requires manual setup. |
|
Predictive AI minimizes downtime. |
Lacks proactive issue prevention. |
|
Granular RBAC with enhanced security. |
Basic RBAC with fewer options. |
|
Intuitive interface for easy adoption. |
Steep learning curve for advanced users. |
|
Resource-efficient monitoring. |
Resource-heavy agent architecture. |
|
Faster deployment for quicker ROI. |
Slower deployment due to agent reliance. |
|
Longer data retention included. |
Limited retention unless upgraded. |
|
NetFlow and traffic analysis included. |
Requires third-party tools for traffic analysis. |
|
Seamless container and microservices monitoring. |
Error-prone configurations for containers. |
|
Distributed tracing with OpenTelemetry. |
APM restricted to highest-paid tier. |
DISCLAIMER: Feature comparison is based on each vendor’s most recent version available as of March 2025. Information is based on data collected from public websites and forums, third party validated customer reviews, analyst papers, and product datasheets.
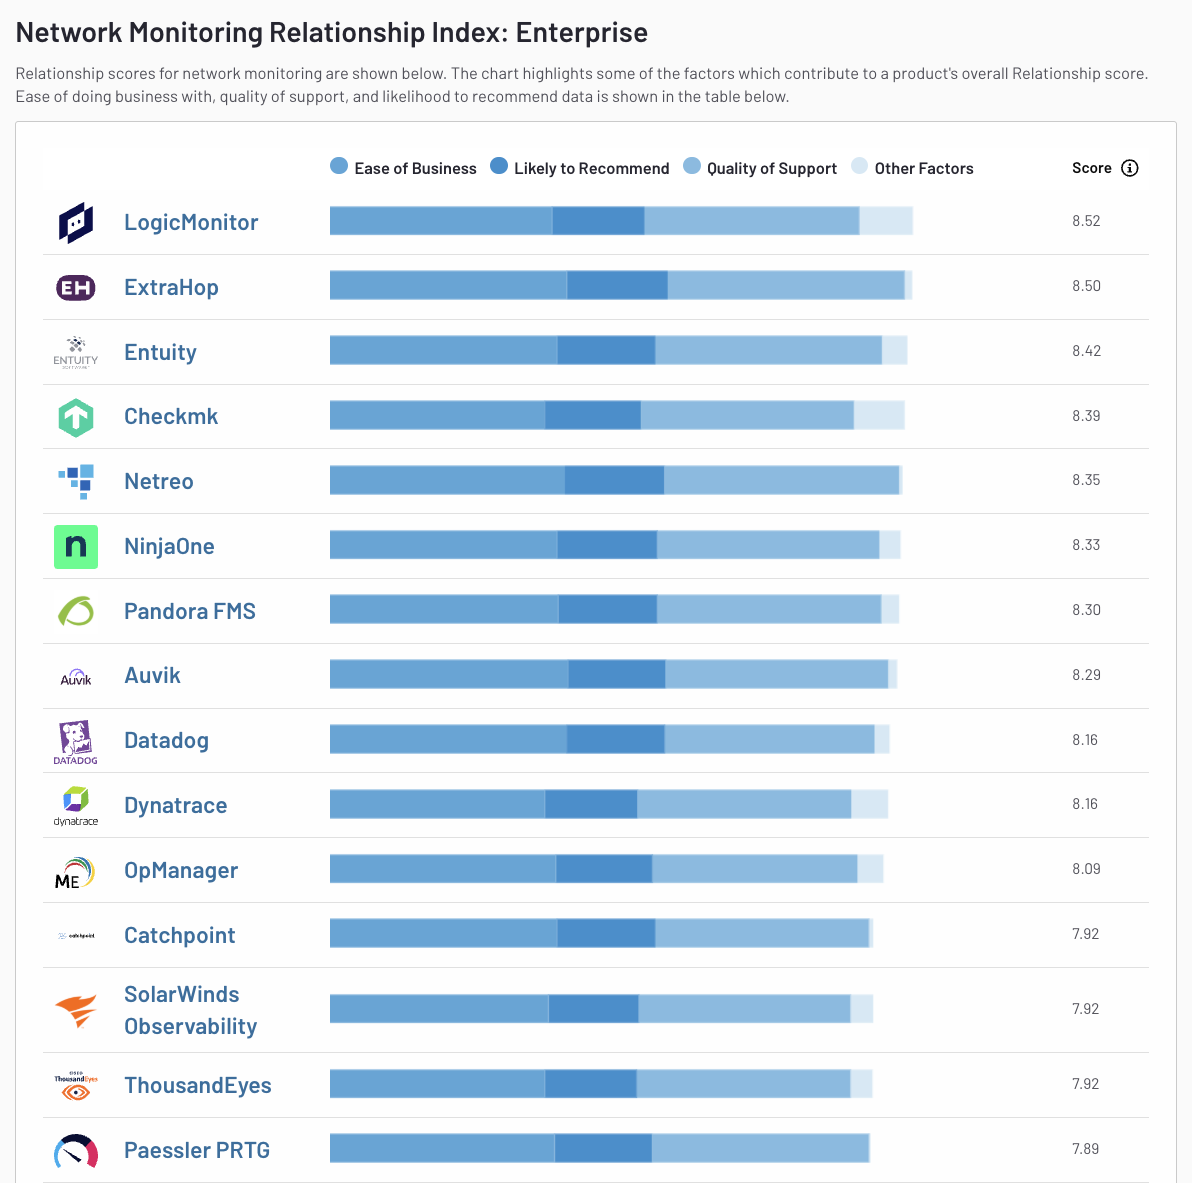
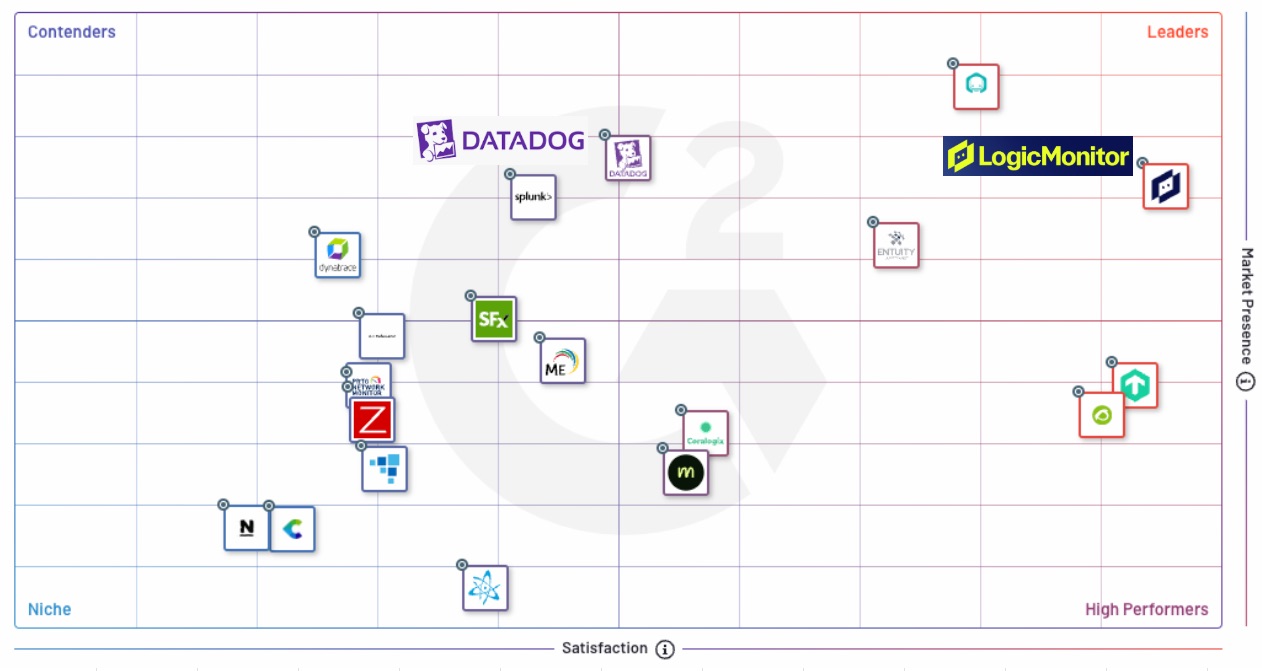
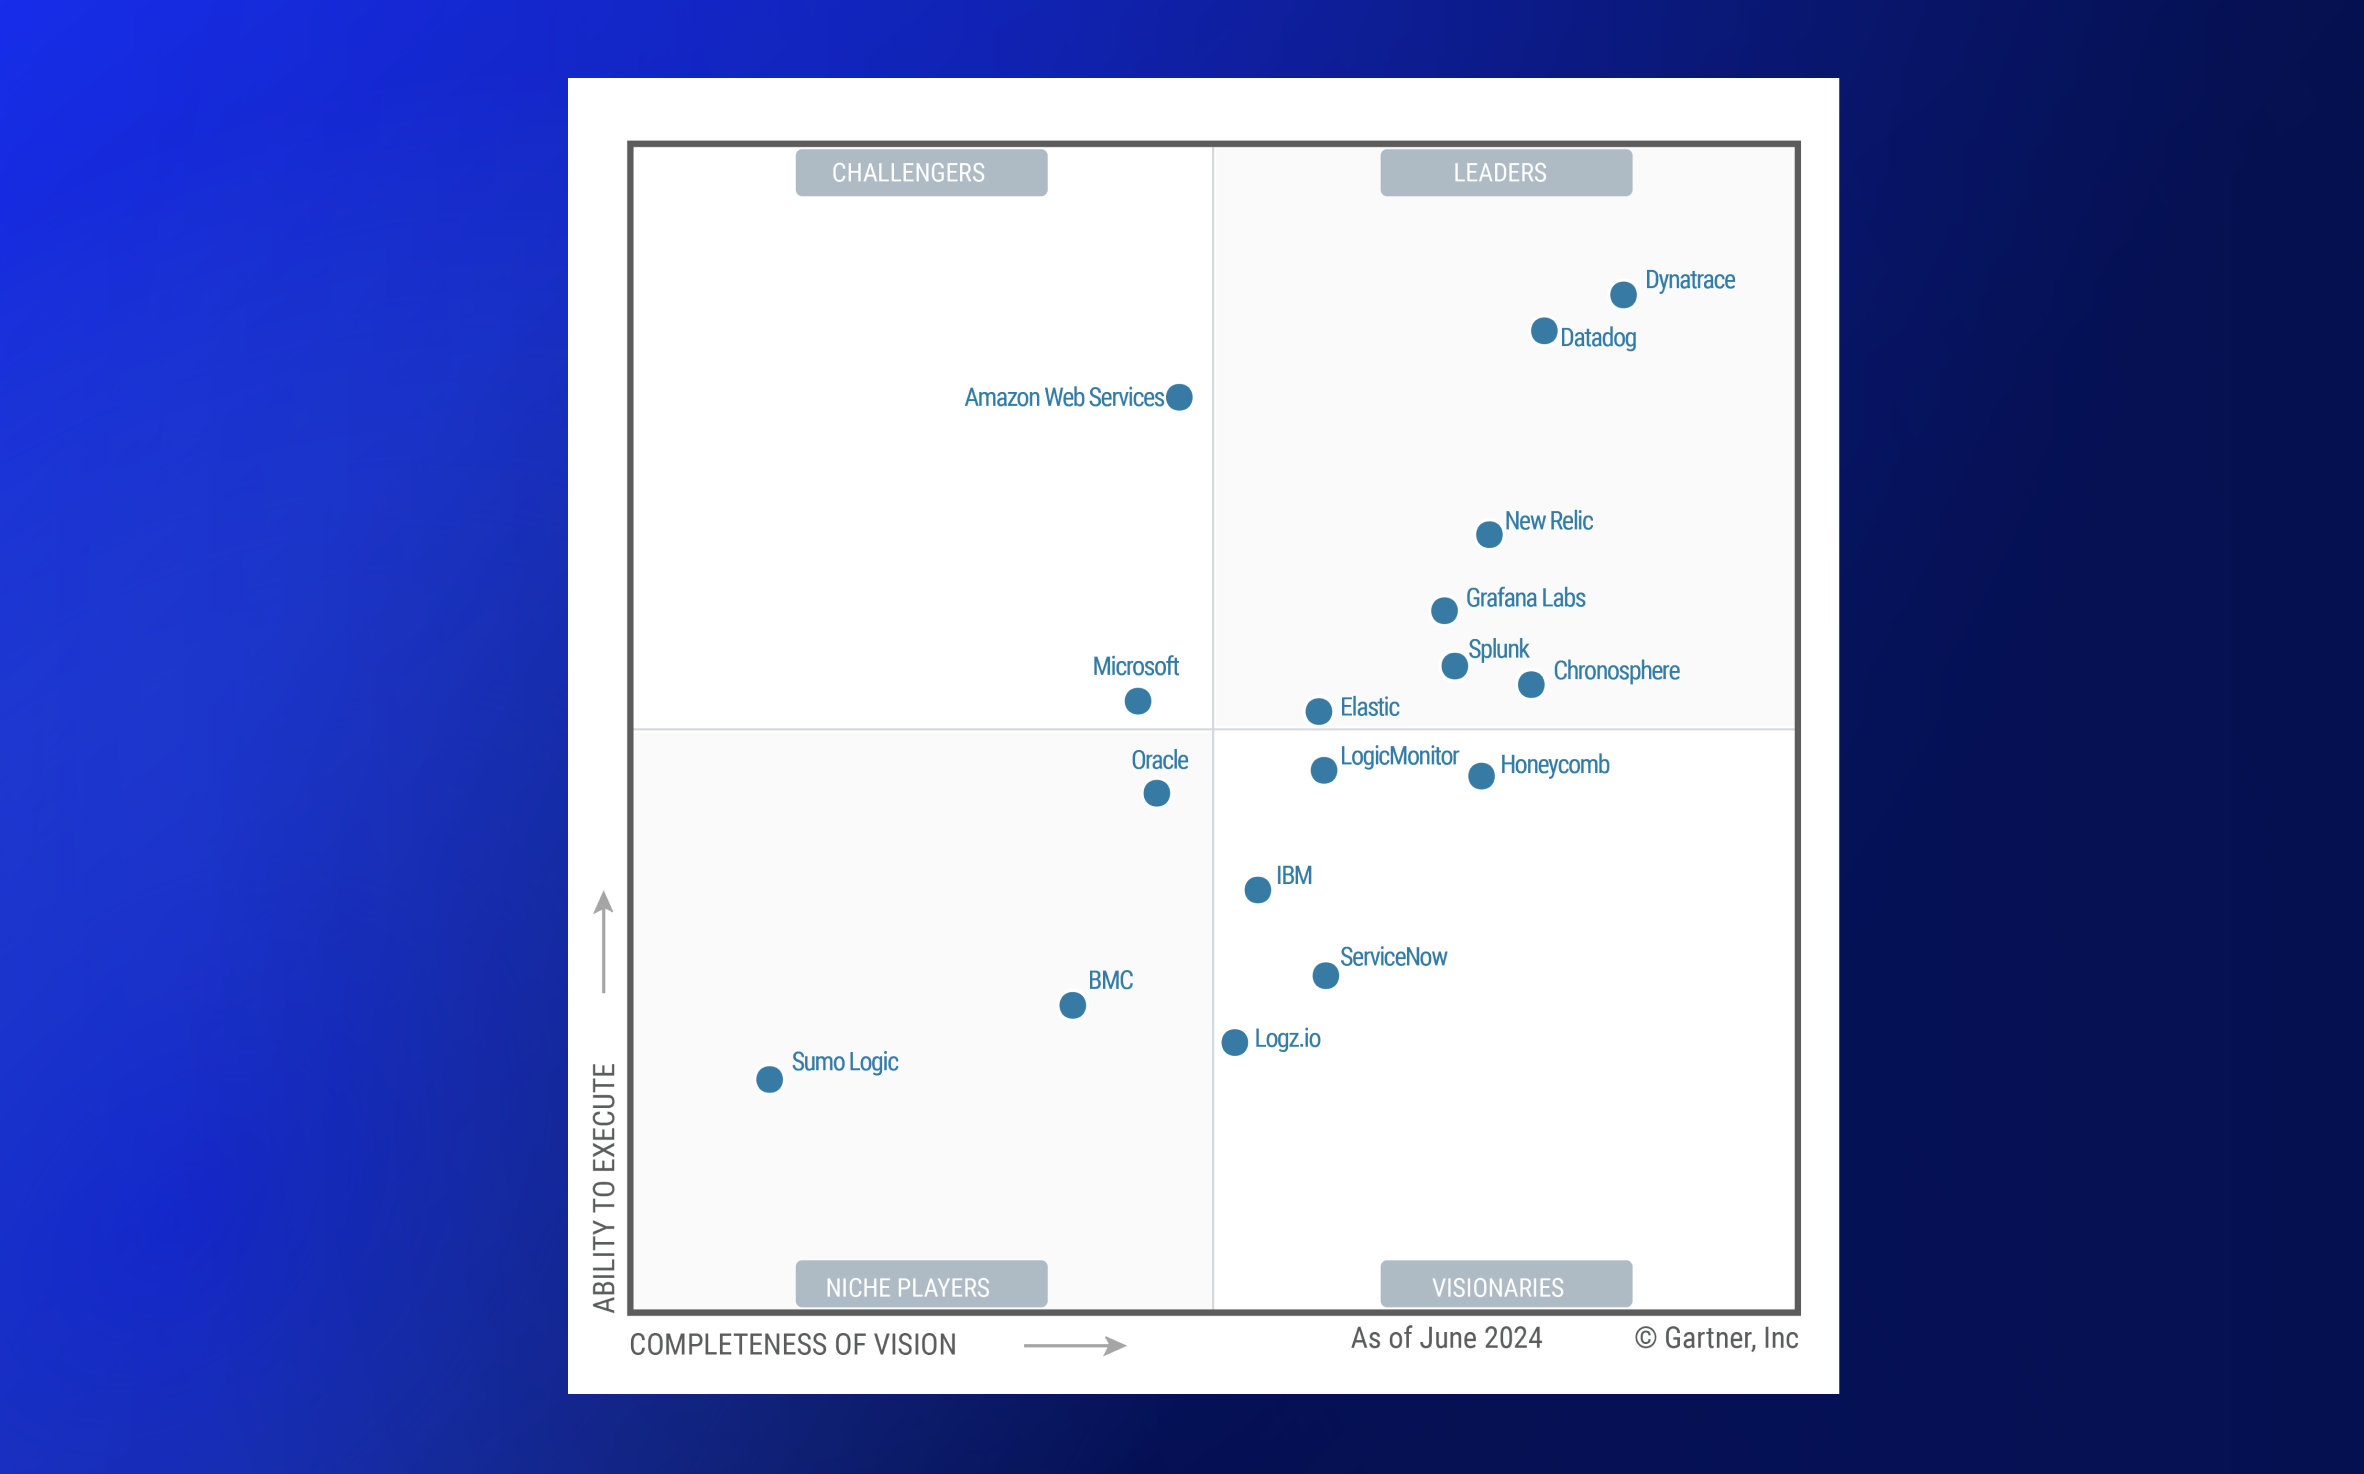
Our Trust Scores
Not just a platform. A true partner.


Rating from Gartner Peer Insights and Customer Satisfaction leader on G2
4.5/5
Rated “Excellent” and an “Editor’s Choice” by PCMag
Excellent
The highest NetPromoter score of any IT Infrastructure Management provider
Highest
LogicMonitor vs. other competitors
Get Started
Contact us today to learn how LogicMonitor can help you shift your IT operations approach from reactive firefighting to proactive incident prevention.