Web checks in Kubernetes: a simple alternative to Prometheus Blackbox Exporter
Control the health of your Kubernetes cluster with LogicMonitor Web Checks. Learn more.
6 min read
April 19, 2023
In this article
NEWSLETTER
Subscribe to our newsletter
Get the latest blogs, whitepapers, eGuides, and more straight into your inbox.
Thank you!
Your video will begin shortly
SHARE
In this article
The continued adoption of Kubernetes, a leading container orchestration platform, increases the demand to monitor these complex environments accurately and efficiently. Maintaining optimal performance and ensuring quick issue resolution are vital aspects of efficient Kubernetes management. While Prometheus Blackbox Exporter has been a popular choice for monitoring internal Kubernetes service endpoints, it comes with inherent limitations that can impede your ability to maintain the peak performance of your applications.
LogicMonitor Web Checks is an advanced feature designed to address these limitations and enhance your Kubernetes monitoring experience. In this article, we will discuss the capabilities of Web Checks and demonstrate how they are a great alternative to Prometheus Blackbox Exporter in monitoring the health of your services in your Kubernetes cluster.
Overview of Prometheus Blackbox Exporter
Prometheus Blackbox Exporter is a probing tool that monitors network endpoints using protocols like HTTP, HTTPS, TCP, and ICMP. It can send probes to services running within Kubernetes clusters and collect metrics such as response time, latency, and status codes. However, Prometheus Blackbox Exporter has some limitations:
Limited configurability: It lacks flexibility in customizing probe configurations and aggregating results.
No native dashboard support: Prometheus Blackbox Exporter does not provide native dashboard functionality, requiring external tools such as Grafana for visualization.
Manual setup and maintenance: The setup process is complex and requires manual intervention, increasing the risk of errors.
LogicMonitor Website Monitoring: Web Checks
Web Checks is a powerful feature available in the LogicMonitor Website Monitoring product that enables you to monitor the health of services running in a collector-accessible location. In the case of our container monitoring product, LM Container, the collector service runs within your Kubernetes cluster. Therefore, the Kubernetes Web Checks can access the endpoints internal to the cluster, delivering real-time insights into service performance and availability. Some key benefits of LogicMonitor Web Checks include:
Comprehensive monitoring: Web Checks supports a wide range of protocols, such as HTTP, HTTPS, REST APIs, and custom scripts, providing deeper visibility into your applications.
Easy deployment and maintenance: Web Checks can be quickly set up and managed through the LogicMonitor UI, simplifying the monitoring process.
Advanced alerting capabilities: You can configure alerts based on specific conditions, ensuring timely detection and resolution of issues.
Seamless integration with LogicMonitor dashboards: Web Checks can be easily integrated with custom dashboards for enhanced visualization and monitoring.
Web Checks in Kubernetes
To get started with monitoring service endpoints in Kubernetes, please follow our installation guide to install LM Container services in your Kubernetes cluster. In this example, we will cover the steps to add a periodic HTTP check to a Cluster IP service running in the cluster at the address: my-nginx.default. To deploy NGINX as a Cluster IP service, follow the steps in the Kubernetes guide on connecting applications with services.
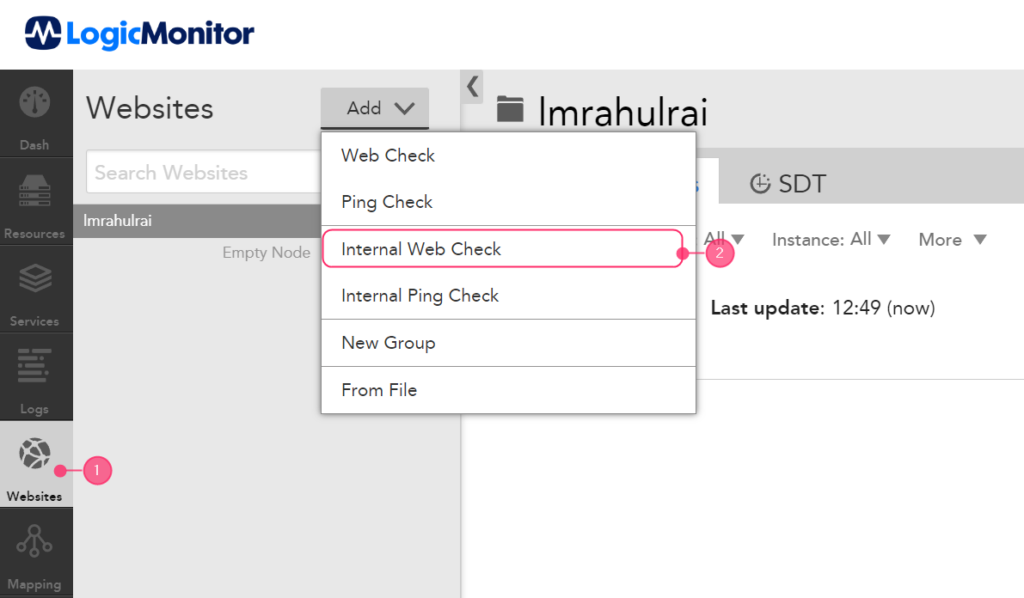
In your LM Portal, Click on Websites on the left-hand menu, and then select the Internal Web Check option under the Add menu as follows:
The next step is to configure the Web Check. Assuming that you have deployed the service “my-nginx” in the “default” namespace, start by entering the name of the Web Check and its root URL, which is my-nginx.default:
The NGINX service can accept HTTP GET requests on the default endpoint. It is possible, however, to specify a custom path for the probe request in the wizard.
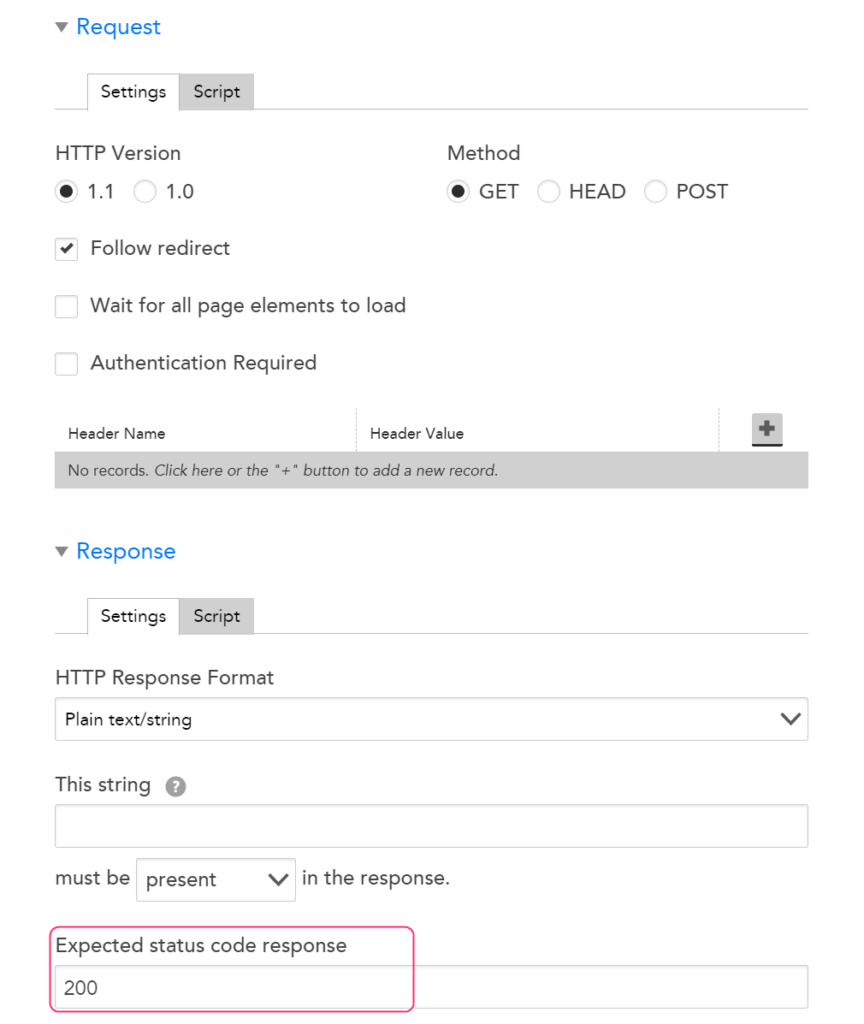
Next, expand the Request and Response panels to explore the options for configuring the probe request and the expected response.
In this exercise, you will check the response for HTTP status code 200 (OK). To establish this condition, enter “200″ in the Expected status code response field as shown below:
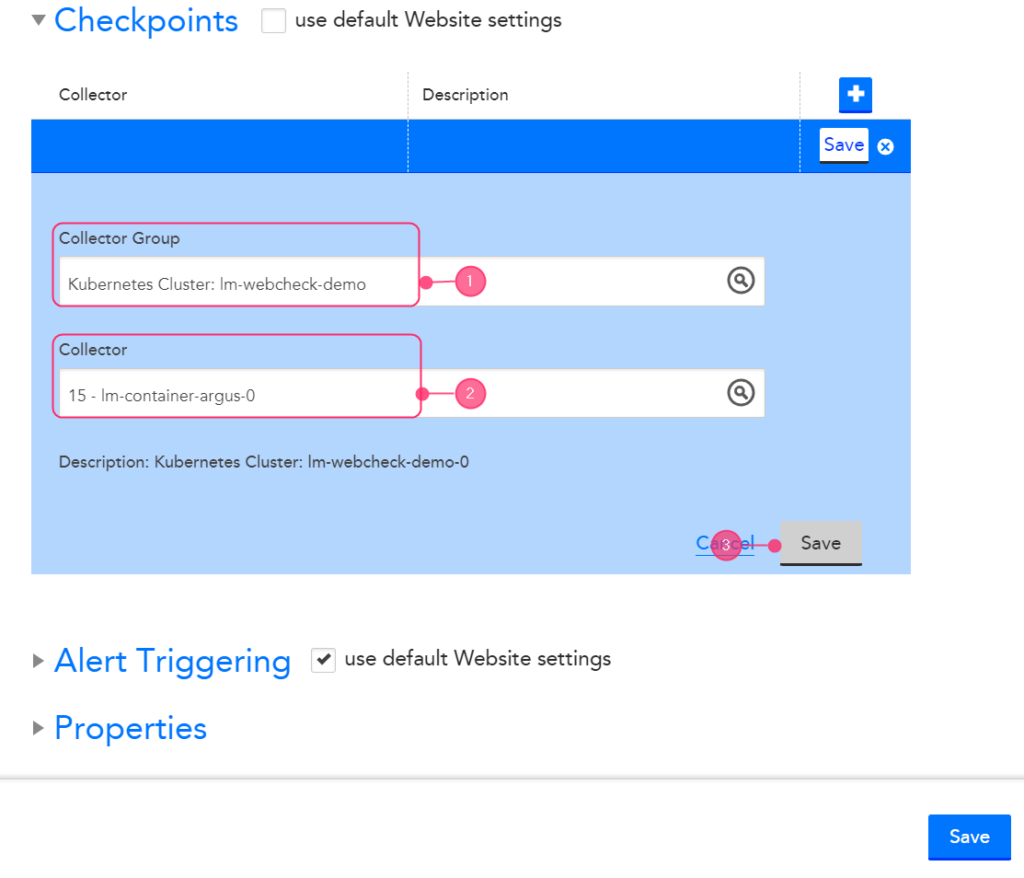
Expand the Checkpoints panel to reveal the options for mapping this Web Check to a collector. The chosen collector will then be scheduled to run this Web Check periodically.
Please select your collector group and Kubernetes collector from the list of options presented as follows. Click on the Save button to save the preferences:
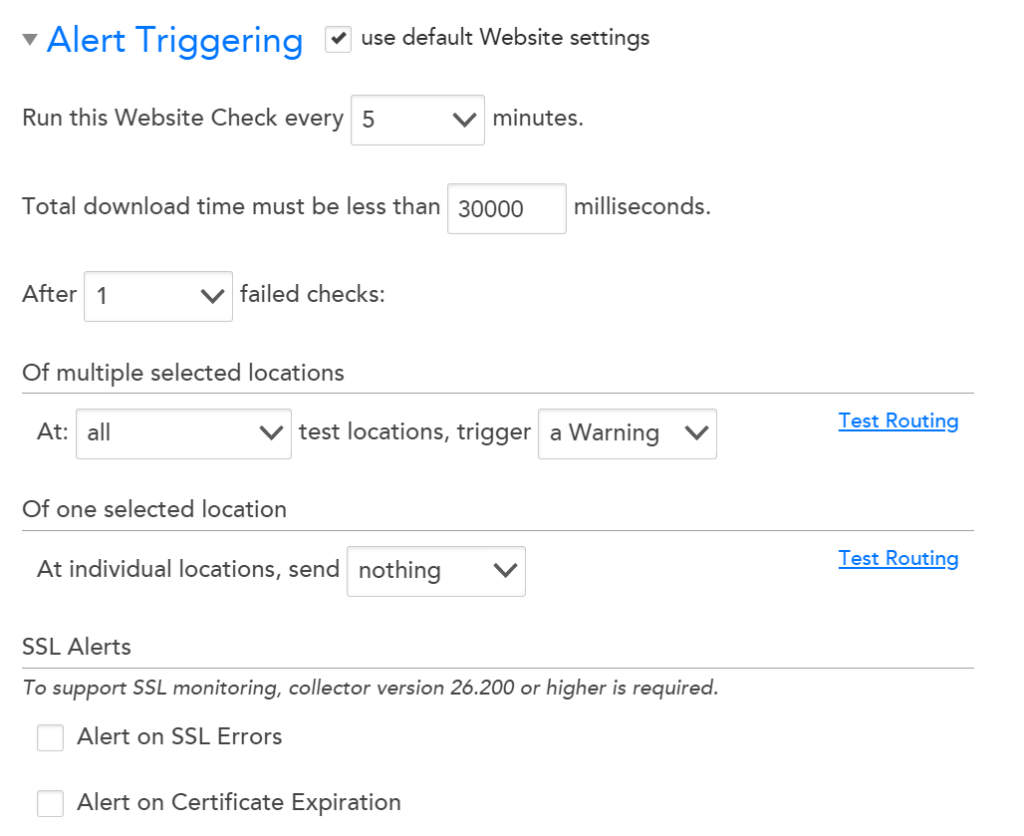
The final step in the setup is to configure the periodicity and conditions of the check and the alert conditions. In the Web Check, various options are available to configure the desired alert trigger behavior, including waiting for a specific duration before reporting an error and alerting on SSL issues.
Let the other options stay at their defaults, schedule the check every five minutes, and click the Save button.
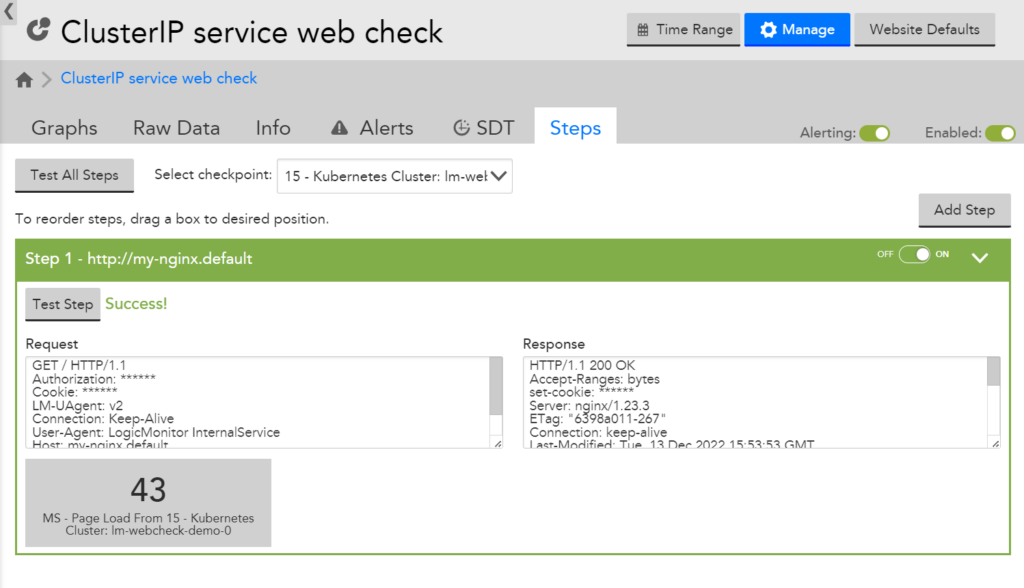
After the check is scheduled on the collector, you can click on the Steps tab and view the steps in the Web Check. You can add more steps to the Web Check from this section to make it more comprehensive.
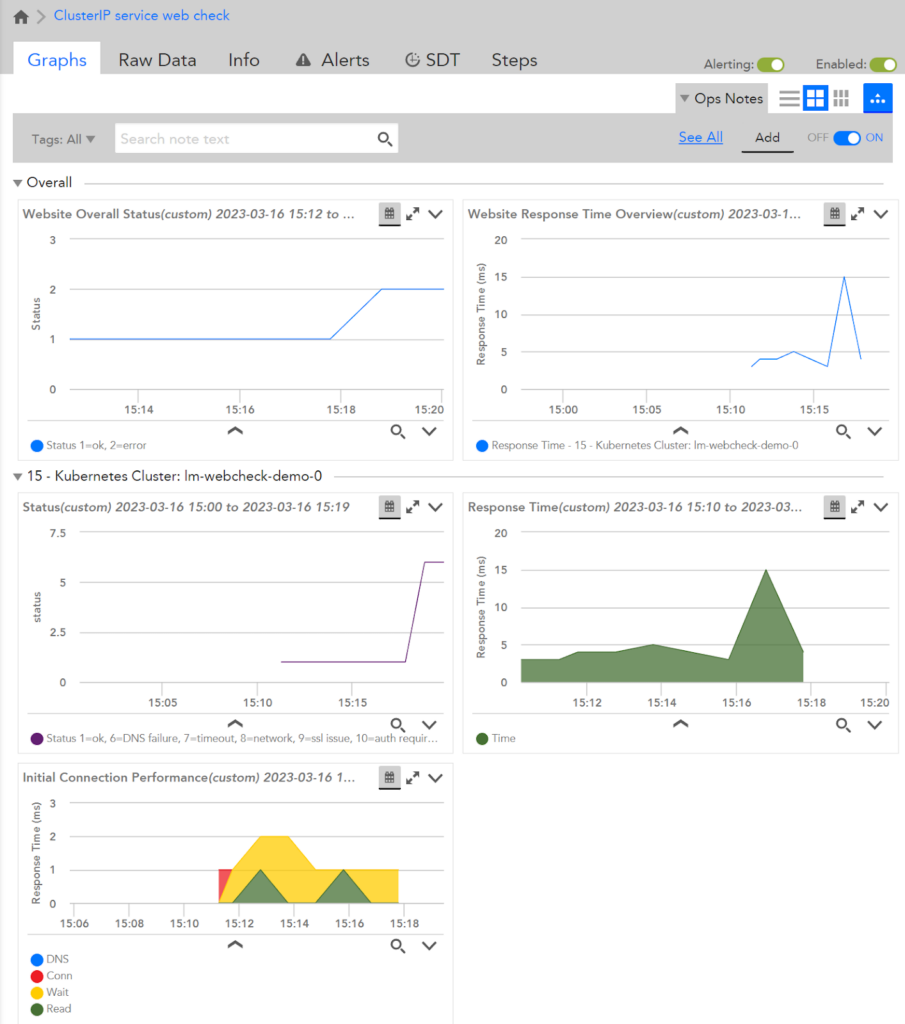
You can find the default graphs reporting check status and other supplementary information under the Graphs tab. In addition, you can easily add the graphs available in this section as widgets to a new or existing dashboard to display metrics and visualize trends.
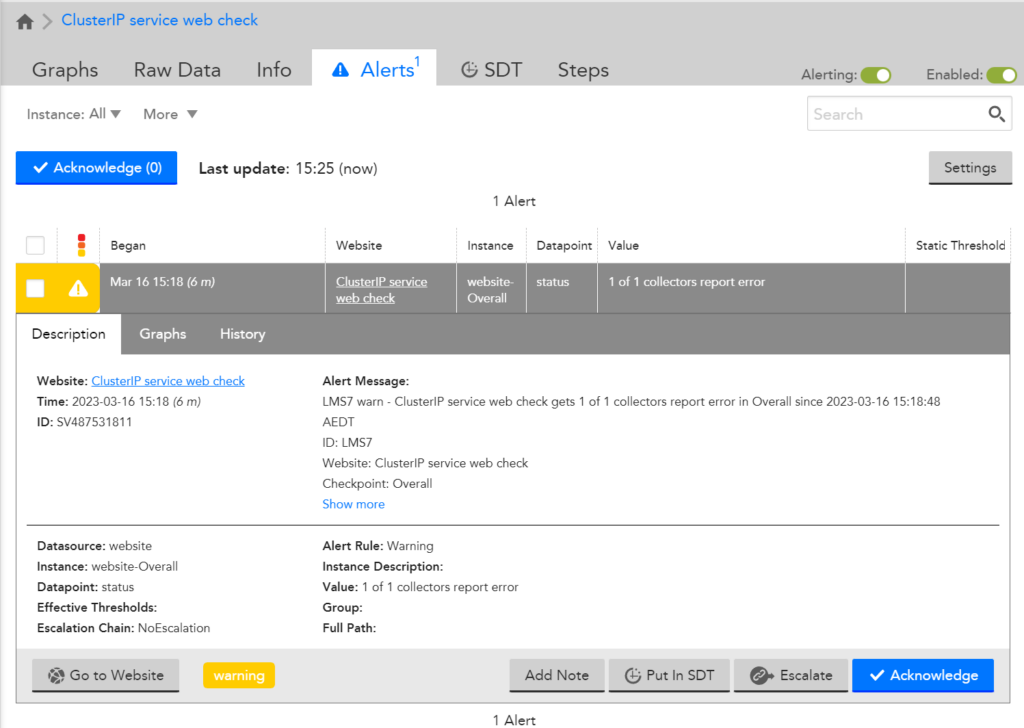
You can trigger an alert by deleting the “my-nginx” service, which will cause the Web Checks to fail. Following that, you will receive alerts on your portal informing you of the error. An example of a failed Web Check alert is shown in the following screenshot:
Please remember to delete the Web Check from your LM Portal and the resources from your cluster to avoid unexpected costs.
Comparing Web Checks and Prometheus Blackbox Exporter
While both Web Checks and Prometheus Blackbox Exporter offer endpoint monitoring capabilities for Kubernetes clusters, some key differences make Web Checks a better choice:
Configurability: Web Checks provide greater flexibility in customizing probe configurations and aggregating results, whereas Prometheus Blackbox Exporter has limited configurability.
Dashboard support: Web Checks seamlessly integrates with customizable dashboards, while Prometheus Blackbox Exporter requires external tools for visualization.
Deployment and maintenance: Web Checks can be easily deployed and managed through the LogicMonitor UI, simplifying the monitoring process. In contrast, Prometheus Blackbox Exporter demands manual setup and maintenance.
Advanced alerting: Web Checks allow you to configure alerts based on specific conditions, ensuring timely detection and resolution of issues. Prometheus Blackbox Exporter lacks this level of granularity in its alerting capabilities.
Conclusion
Monitoring your Kubernetes cluster is crucial for maintaining high performance and ensuring quick issue resolution. While Prometheus Blackbox Exporter has been a popular choice for Kubernetes endpoint monitoring, it has some limitations that can be addressed using LogicMonitor’s Web Check feature. Web Checks offer comprehensive monitoring, easy deployment and maintenance, advanced alerting capabilities, and seamless dashboard integration, providing better visibility and control over the health of your Kubernetes cluster. By adopting Web Checks, you can overcome the shortcomings of Prometheus Blackbox Exporter and enhance your endpoint monitoring experience.