You can customize the CloudWatch DataSources if you cannot find the desired metrics via LogicMonitor’s CloudWatch coverage and LogicMonitor’s Collector. Some of the ways you can customize CloudWatch DataSources include:
- Adding or modifying dimensions for the metrics collected: You can easily add the dimensions to the metric paths for existing DataSource definitions. In some cases, where dimension values are dynamic and not static, an Active Discovery method is the most efficient way to “discover” the dimension values as instances and monitor the associated metrics. For more information, see What is Active Discovery?
- Adding new metrics to be collected: If you publish your custom metrics to AWS CloudWatch, you can quickly modify existing LogicMonitor AWS DataSources or create new AWS DataSources to collect these metrics.
Prerequisites
- An AWS account that is integrated with LogicMonitor. For more information, see AWS environment to LogicMonitor.
Customizing AWS CloudWatch DataSources
To add dimensions to a new or an existing DataSource, complete the following steps:
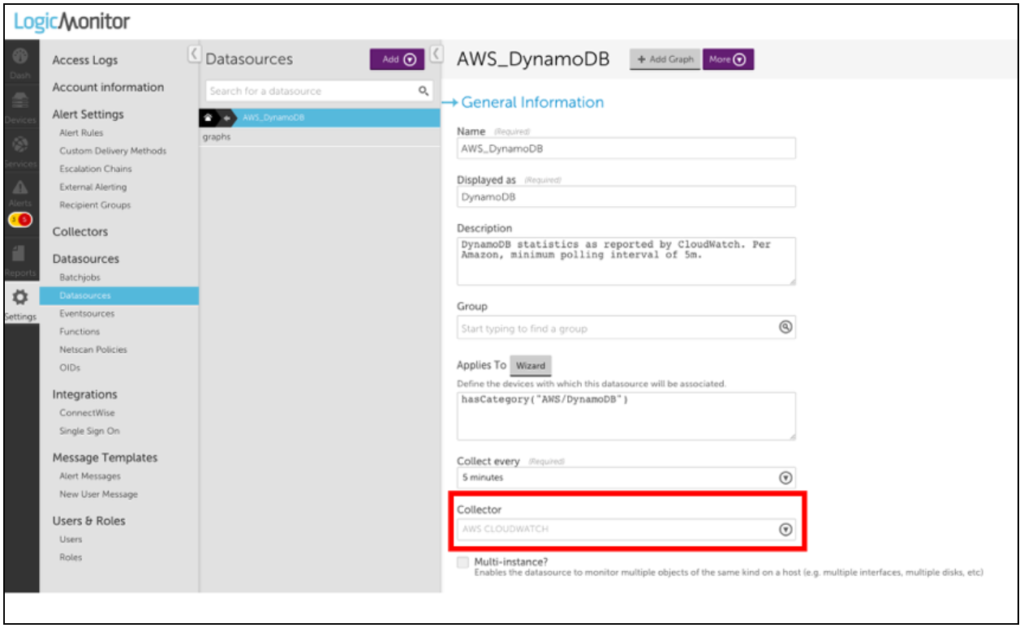
1. Navigate to Settings > LogicModules > DataSources and search for AWS Datasources.
Note: Most of LogicMonitor’s AWS Datasources are already configured to query the CloudWatch API. If the Collector field has a value of AWS CLOUDWATCH, then you can easily modify or clone it to collect your custom metrics.
2. Select the datapoint for which you want to collect the custom data.
Note: You must select Normal datapoints to add dimensions.
3. Click the Settings icon, next to the selected datapoint.
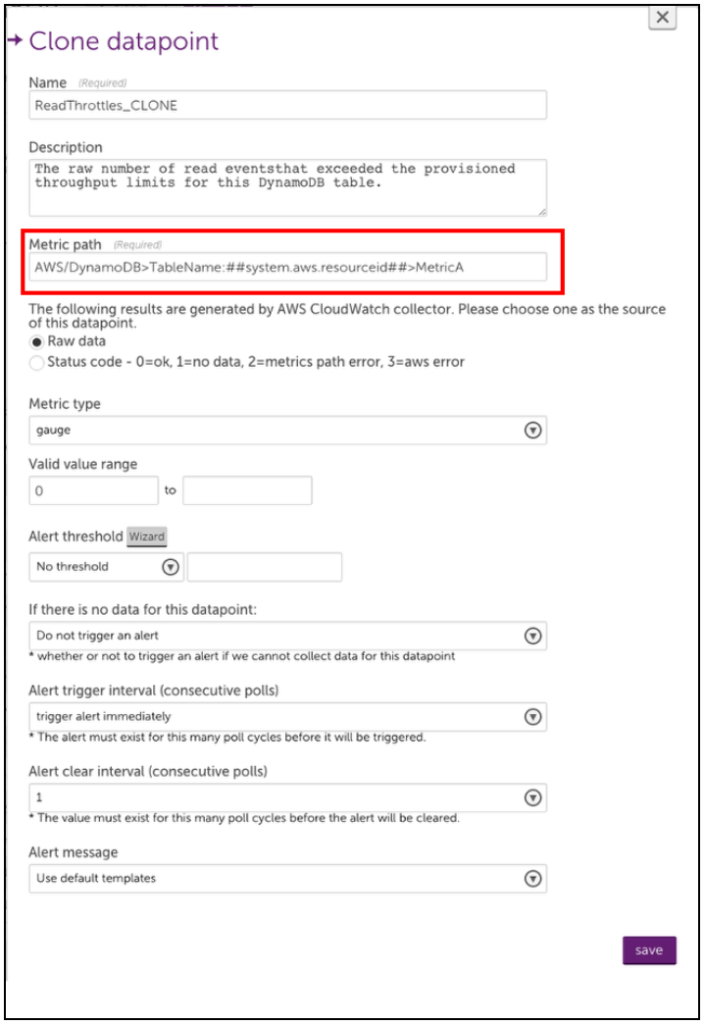
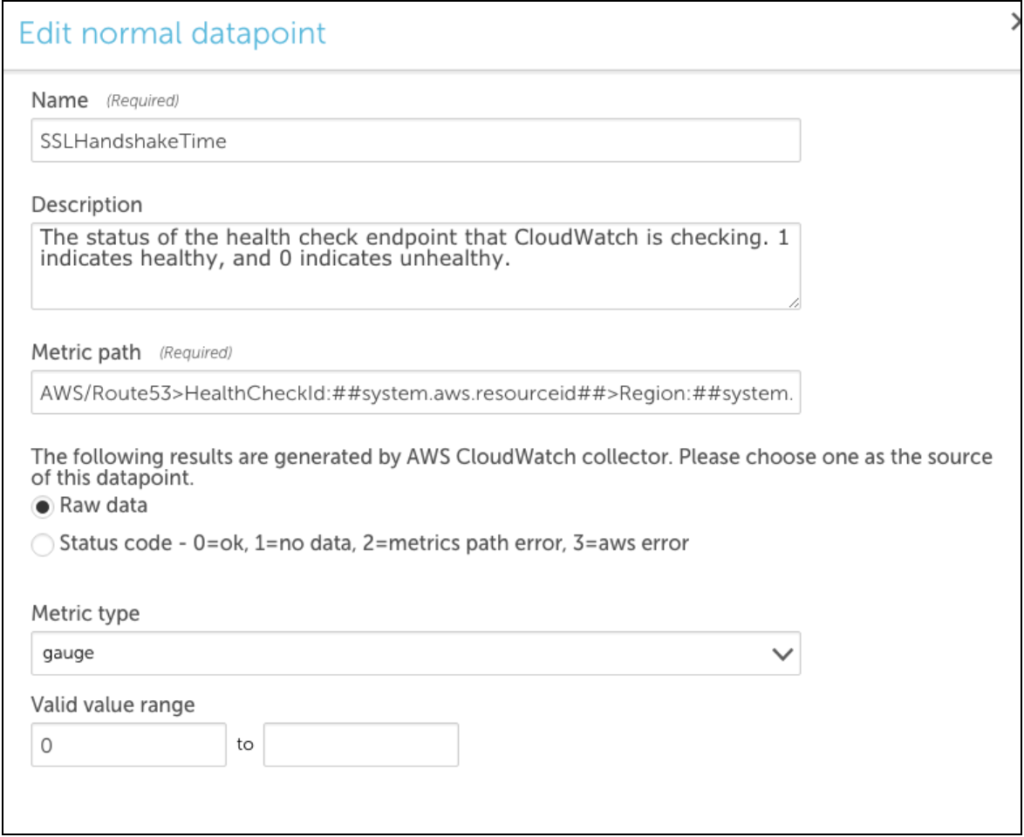
4. On the Edit Normal Datapoint dialog box, click Clone.
5. Rename the cloned datapoint and edit the metric path.
The syntax for the Metric path is:
Namespace>Dimensions>Metric>AggregationMethod
Where Dimensions should be one or more key-value pairs in this format:
DimensionName1:DimensionValue1>DimensionName2:DimensionValue2
Note: Because spaces are allowed in CloudWatch metric names, white spaces in the metric path will be interpreted by LogicMonitor as a space in the specified name. Avoid using spaces where they aren’t included in your CloudWatch metrics. Also, some metrics may not have an aggregation method or may only expose certain aggregation methods. The easiest way to ensure that you construct the metric path correctly is to use an AWS tool such as the AWS CLI to list metrics. After doing so, you can edit the Metric Path for a cloned or new datapoint.
Note: You can use an equal sign “=” to delimit the key-value pairs when the metric path in AWS CloudWatch contains a colon “:”.
For example, you can define the metric path for an AWS SES datasource with:
AWS/SES>ses:configuration-set=##system.aws.resourceid##>Send>Average
6. Save your new datapoint and then save the DataSource. LogicMonitor will automatically begin collecting this data for any AWS device that the edited DataSource is applied to.
Note: You can define custom AWS Cloudwatch metrics that include “greater than” and “less than” characters in the metric path. But because the “>” character is interpreted as a dimension separator, you need to substitute the “” characters with “[[” and “]]” respectively. For example, the metric path cloudwatch>path should be entered as cloudwatch]]path within LogicMonitor.
Example 1
The following example illustrates adding a datapoint to the AWS_Route53 DataSource to monitor SSLHandshake Time. This is not a custom CloudWatch metric, this was recently introduced by AWS and will be added automatically to the AWS_Route53 DataSource. However, the process for editing or adding the datapoints to AWS DataSources is illustrated.
A list-metrics with the AWS CLI displays the following:
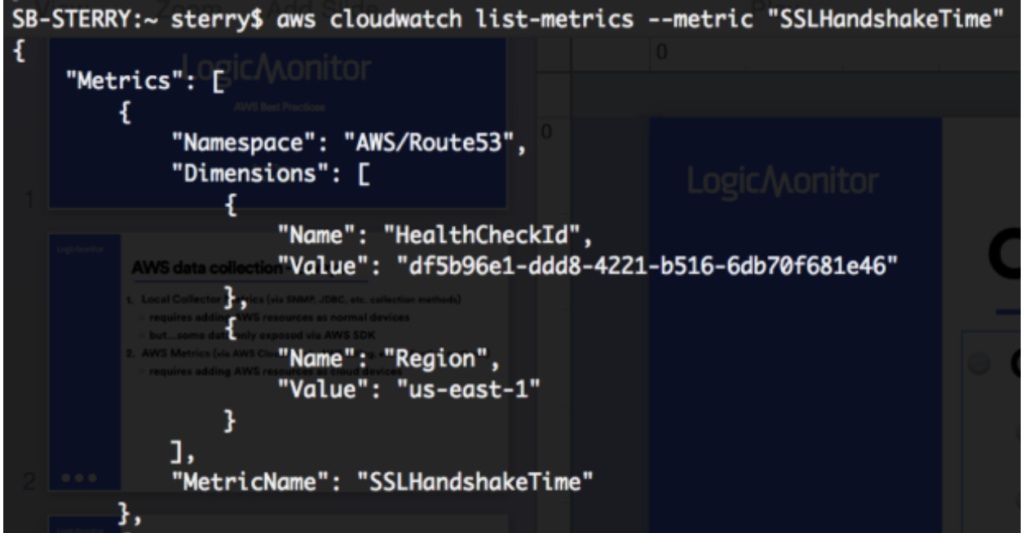
You can clone an existing datapoint for the AWS_Route53 DataSource and change the metric path to the following:
AWS/Route53>HealthCheckId:##system.aws.resourceId##>Region:##system.aws.region##>SSLHandshakeTime>Average
Example 2
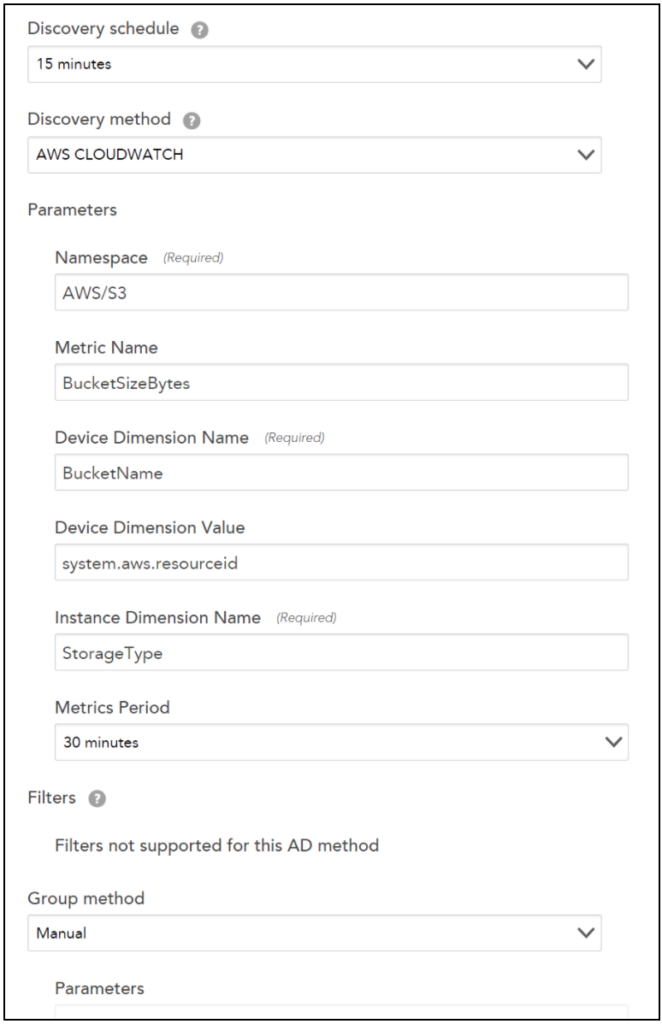
The following example illustrates how to create a multi-dimensional DataSource using the Active Discovery method. Two dimensions are required, viz the device dimensions and the instance dimensions.
The device dimension specifies under which device the instances are displayed in LogicMonitor.
For example: If you are creating a multi-dimensional S3 bucket DataSource. You must enter BucketName and ##system.aws.resourceid## for Device Dimension Name and Device Dimension Value fields respectively.
The instance dimension discovers instances and will always contain ##wildvalue## value in the metric path. So, for S3 bucket DataSource example, you will enter StorageType in the Instance Dimension Value field.
Note: For editing the metric paths for datapoints that are using the Active Discovery method, a standard metric path is followed for Cloudwatch in LogicMonitor:
Namespace>Dimensions>Metric>AggregationMethod
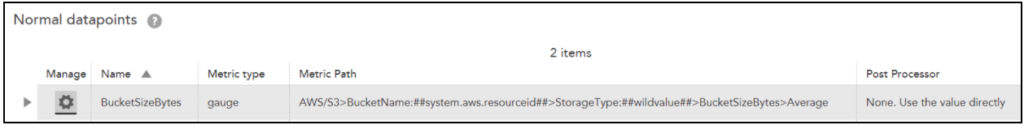
Let’s continue with the S3 bucket DataSource example. Following will be the metric path:
AWS/S3>BucketName:##system.aws.resourceid##>StorageType:##wildvalue##>BucketSizeBytes>Average
Troubleshooting
Typically, issues arise because of the following:
1. Incorrect Metric Path Syntax. Consider using a tool like the AWS CLI to confirm the syntax is correct.
Note: You can use the AWS CLI to verify the names of the metrics, dimensions, and aggregation types. For more information, see AWS services that publish CloudWatch metrics.
2. Incorrect Aggregation Method. Is the aggregation method you are trying to use valid for the desired Metric?
3. Insufficient Permissions. Sometimes, custom CloudWatch metrics can require permissions beyond what you may have provisioned to your LogicMonitor user.
You can identify which specific issue is occurring with the Poll Now functionality for your DataSource – you can find the Poll Now option on the Raw Data tab. On the Raw Data tab, the request that LogicMonitor makes to AWS for your DataSource, as well as any errors AWS returns is displayed.
LM Cloud offers custom event integrations that enable you to see AWS, GCP, and Azure-specific events in LogicMonitor and correlate events (such as EC2 instance state change notifications, CloudTrail logs, or Azure Activity logs) with performance data.
The setup and details of these integrations largely vary for GCP, and Azure, so refer to the following sections for additional information.
Visualizing Azure Activity Logs in LogicMonitor
You can use an Azure function to send Azure Activity Logs. You may find this useful for correlating monitoring trends and events that occurred in your Azure account.
Setup Instructions
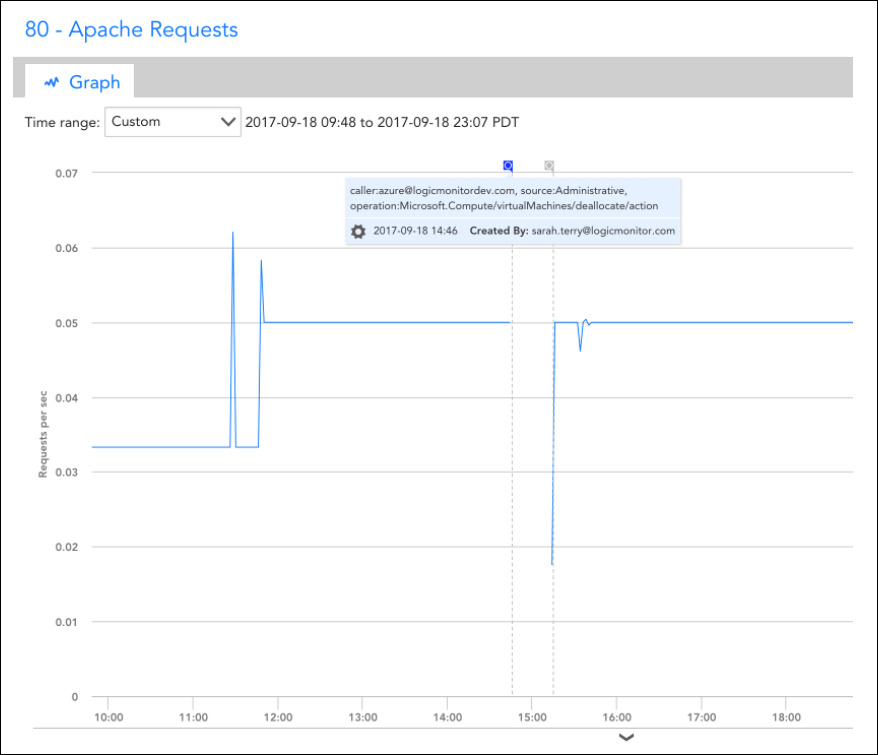
The event integration is based on an Azure Function. Specifically, you’ll need to add the Function and set up an Azure Activity Log alert rule that triggers the Function based on desired activity log events. The Function, when triggered, will use LogicMonitor’s REST API to add the events as Ops Notes for the specific devices to which they relate. Once the Ops Notes have been created for monitored resources that have associated events, you’ll see them on all device and dashboard graphs for those resources. You can further filter the events that show up using the Ops Notes panel.
Assuming you already have monitored Azure resources in LogicMonitor, you’ll need to perform the following steps to setup the integration:
1. Create a set of API tokens in your LogicMonitor account that the integration will use. For more information, see API Tokens.
Note: For using these API tokens, the user must have permission to manage all devices to create OpsNotes. We recommend creating a designated API user for the integration.
2. Add a new Azure Function App.
Note: Functions can be viewed or created from within the App Services section. Once created, you must add an HTTPTrigger Powershell Function within the App.
3. Add the following script to the HTTP Trigger PowerShell Functions:
# POST method: $req
$requestBody = Get-Content $req -Raw | ConvertFrom-Json

$caller = $requestBody.data.context.activityLog.caller
$source = $requestBody.data.context.activityLog.eventSource
$time = $requestBody.data.context.activityLog.eventTimestamp
$operation = $requestBody.data.context.activityLog.operationName
$resourceId = $requestBody.data.context.activityLog.resourceId
$resourceGroup = $requestBody.data.context.activityLog.resourceGroupName

Write-Output $resourceId | Out-String

<# account info #>
$accessId = 'API_ID'
$accessKey = 'API_KEY'
$company = 'LM_ACCOUNT'

$encoded = [uri]::EscapeDataString($resourceId)

<# Get Devices request details #>
$httpVerb = 'GET'
$resourcePath = '/device/devices'
$queryParams = '?filter=systemProperties.name:system.azure.resourceid,systemProperties.value:' + $encoded

Write-Output $queryParams | Out-String

<# Construct URL #>
$url = 'https://' + $company + '.logicmonitor.com/santaba/rest' + $resourcePath + $queryParams

<# Get current time in milliseconds #>
$epoch = [Math]::Round((New-TimeSpan -start (Get-Date -Date "1/1/1970") -end (Get-Date).ToUniversalTime()).TotalMilliseconds)

<# Concatenate Request Details #>
$requestVars = $httpVerb + $epoch + $resourcePath

<# Construct Signature #>
$hmac = New-Object System.Security.Cryptography.HMACSHA256
$hmac.Key = [Text.Encoding]::UTF8.GetBytes($accessKey)
$signatureBytes = $hmac.ComputeHash([Text.Encoding]::UTF8.GetBytes($requestVars))
$signatureHex = [System.BitConverter]::ToString($signatureBytes) -replace '-'
$signature = [System.Convert]::ToBase64String([System.Text.Encoding]::UTF8.GetBytes($signatureHex.ToLower()))

<# Construct Headers #>
$auth = 'LMv1 ' + $accessId + ':' + $signature + ':' + $epoch
$headers = New-Object "System.Collections.Generic.Dictionary[[String],[String]]"
$headers.Add("Authorization",$auth)
$headers.Add("Content-Type",'application/json')

<# Make Request #>
$response = Invoke-RestMethod -Uri $url -Method $httpVerb -Header $headers

<# Print status and body of response #>
$status = $response.status
$body = $response.data

Write-Output "Status:$status"

$deviceId = $body.items.id

Write-Output $deviceId | Out-String

If ($deviceId -ne $Null) {

#####################################

<# Add Ops Note request details #>
$httpVerb = 'POST'
$resourcePath = '/setting/opsnotes'
$data = '{"note":"caller:' + $caller + ', source:' + $source + ', operation:' + $operation + '","tags":[{"name":"Azure Activity Log"}],"scopes":[{"type":"device","deviceId":"' + $deviceId + '"}]}'

<# Construct URL #>
$url = 'https://' + $company + '.logicmonitor.com/santaba/rest' + $resourcePath

<# Get current time in milliseconds #>
$epoch = [Math]::Round((New-TimeSpan -start (Get-Date -Date "1/1/1970") -end (Get-Date).ToUniversalTime()).TotalMilliseconds)

<# Concatenate Request Details #>
$requestVars = $httpVerb + $epoch + $data + $resourcePath

<# Construct Signature #>
$hmac = New-Object System.Security.Cryptography.HMACSHA256
$hmac.Key = [Text.Encoding]::UTF8.GetBytes($accessKey)
$signatureBytes = $hmac.ComputeHash([Text.Encoding]::UTF8.GetBytes($requestVars))
$signatureHex = [System.BitConverter]::ToString($signatureBytes) -replace '-'
$signature = [System.Convert]::ToBase64String([System.Text.Encoding]::UTF8.GetBytes($signatureHex.ToLower()))

<# Construct Headers #>
$auth = 'LMv1 ' + $accessId + ':' + $signature + ':' + $epoch
$headers = New-Object "System.Collections.Generic.Dictionary[[String],[String]]"
$headers.Add("Authorization",$auth)
$headers.Add("Content-Type",'application/json')

<# Make Request #>
$response = Invoke-RestMethod -Uri $url -Method $httpVerb -Body $data -Header $headers

<# Print status and body of response #>
$status = $response.status
$body = $response.data | ConvertTo-Json -Depth 5

Write-Output "Status:$status"
Write-Output "Response:$body"
}4. Get the function URL (upper right of function text) – you’ll need to add this to your Azure Activity Log alert rule.
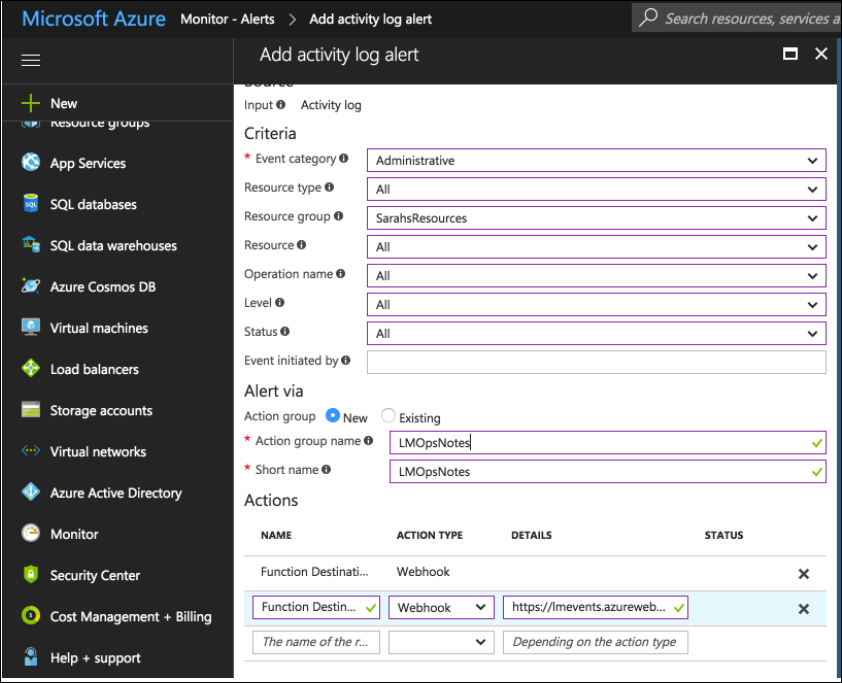
5. Within the Monitor service, select the Alerts section and configure an activity log alert that matches the events you want to see in LogicMonitor. You must add a new Action of type Webhook, and add the Function URL as the description.
Once the steps are complete, all Azure Activity Logs that match your rule configured in step 5 should be added as LogicMonitor Ops Notes for the specific monitored resources to which they relate to which they relate.
LogicMonitor automatically adds Dashboards and Reports when you add an AWS, Microsoft Azure, or GCP account into monitoring. This provides you with instant visibility into your cloud environments and includes both overview and service-specific views. These automatically generated Dashboards and Reports provide a starting point based on best practices, but you can customize them for your specific environment.
The information displayed in the Dashboards and Reports will depend on the services you select for monitoring. For example, If you have not provided S3 bucket information in which your billing data is stored, the Billing widgets will not be displayed on an AWS Overview dashboard.
Currently, auto-generated Dashboards and Reports are only added for new AWS, Microsoft Azure, and GCP accounts added into LogicMonitor.
A Dashboard group and a Report group are automatically generated and added for AWS, Microsoft Azure, or GCP accounts into LogicMonitor. Automatically generated Dashboards and Reports are placed in auto-generated Dashboard and Report groups, respectively. Dashboard and Report groups are named based on the name you assigned the AWS, Microsoft Azure, or GCP account in LogicMonitor.
For example, when you add a new AWS account named ‘Prod AWS’, a Dashboard group named ‘Prod AWS Dashboards’ and a Report group named ‘Prod AWS Reports’ is generated.
The following Dashboards and Reports are currently auto-generated for AWS, Microsoft Azure, and GCP accounts:
Cloud environment overview
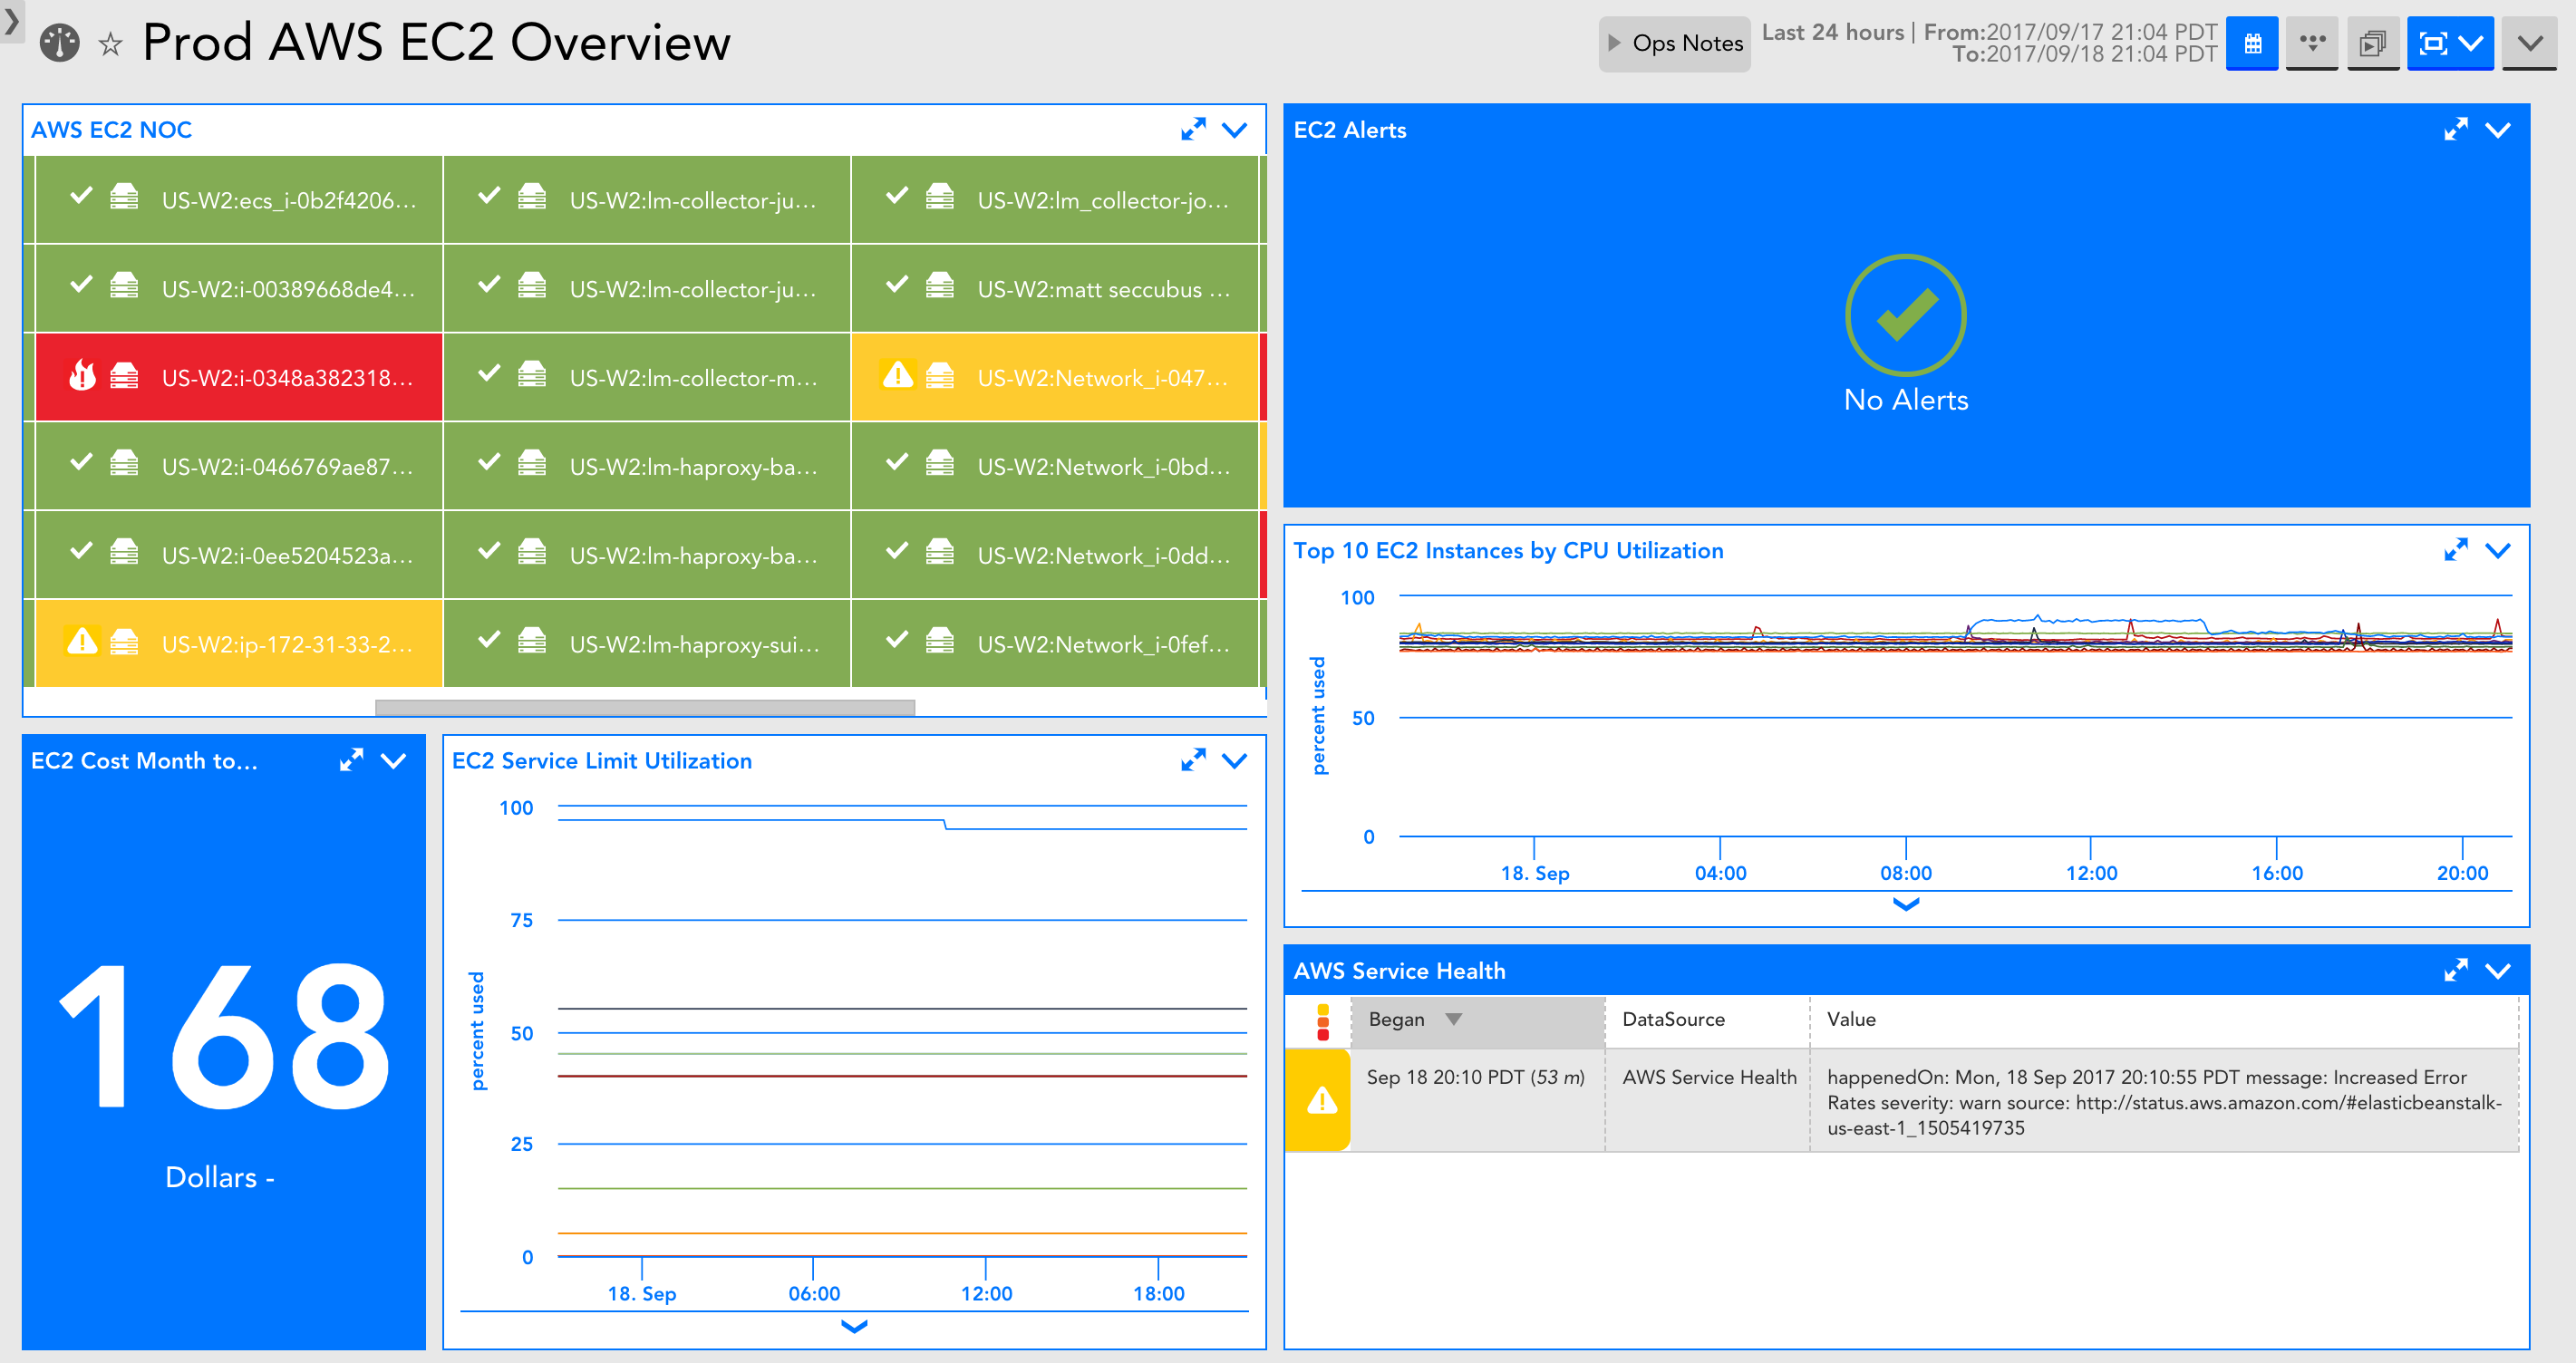
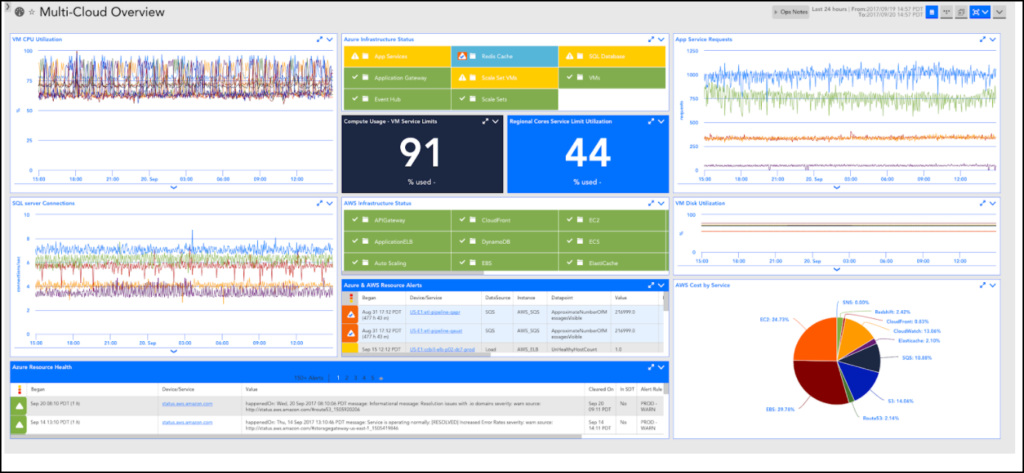
An overview dashboard is added for all new cloud accounts. The dashboard includes an overview of your cloud environment. Also, the dashboard displays the service-specific NOC status, any alerts, any reported cloud availability disruptions, and billing data (if you have selected billing for monitoring). You can use this dashboard to share with execs or as a starting point to narrow down and localize where an issue is coming from during troubleshooting.
Service-specific dashboards for EC2 and EBS
Each service-specific dashboard includes a NOC of the resources, the cost related to the service, any service limit utilization that can be displayed, relevant service alerts, critical metrics for the service, and any issues with the cloud provider availability.
Service Utilization across services
Reports are auto-generated for new cloud accounts you add into LogicMonitor and can display information that is better suited to report format. The report format makes it easy to share information across teams, or you can review reports every week.
If you’re an existing customer, you may already be monitoring AWS or Microsoft Azure resources with LogicMonitor. The steps to take advantage of LogicMonitor Cloud Monitoring features largely depend on how you are monitoring AWS, Azure, or GCP resources now. Identify the scenario that matches your own, and follow the steps corresponding to that scenario:
- Currently monitoring both Collector and CloudWatch metrics–I am monitoring AWS EC2 instances and Azure VMs as traditional LogicMonitor resources, and I’ve already added my AWS, Azure, or GCP account into LogicMonitor.
- Currently monitoring only Collector metrics–I am monitoring AWS EC2 instances and Azure VMs as traditional LogicMonitor resources, but I have not added my AWS, Azure, or GCP account into LogicMonitor.
- Currently monitoring only CloudWatch metrics–I’ve added my AWS, Azure, and GCP account into LogicMonitor, but I’ve not added EC2 instances and VMs as traditional LogicMonitor resources to get local Collector metrics.
Currently Monitoring Both Collector and CloudWatch Metrics
If you already have cloud VMs added as traditional LogicMonitor resources and already have your cloud account into LogicMonitor, you can do the following to consolidate monitoring for your VMs and take advantage of cloud monitoring features:
- Enable monitoring via local Collector in your existing AWS, Azure, or GCP account–Lets you see Collector metrics in the same view in which you already see CloudWatch and Azure Monitor API metrics.
This will result in duplicate monitoring of the Collector data (once for the traditional version of the device and now once for the cloud version of the device). The best option is to monitor the cloud VM in duplicate like this for as long as you want to retain historical data for, and then remove the non-cloud version of the device.
During your free trial period of LogicMonitor Cloud Monitoring, this duplicate monitoring will not cost you, and at the end of it, you can choose to:- Delete the traditional version of resource (would lose history older than 6 months) – provides you with a unified view. Deleting these resource will impact any dashboard, report, or alerting configurations associated with the resource.
- Turn off local Collector monitoring for AWS EC2 instances, Azure VMs, or GCP compute engines and keep the traditional version of resource. In this case, you continue to maintain separate views.
- Import new LogicModules–Gets additional monitoring for resources, cloud provider availability, and billing.
- (Optional) Set up Cloud Logs – Enables you to get event data as logs and troubleshoot faster with anomaly detection and log or metric correlation. For more information, see these instructions for Setting up AWS Logs Ingestion, Setting up Azure Logs Ingestion, Setting up GCP Logs Ingestion.
Currently Monitoring Only Collector Metrics
If you have not added an AWS or Azure account into LogicMonitor, you can do the following to get more visibility into your cloud VMs:
- Add your AWS, Azure, or GCP account into LogicMonitor – Enables you to get account level metrics (such as service limits, cloud provider availability) and monitor Collector data. You can also choose to see CloudWatch and Azure Monitor data in the same view, while taking advantage of LogicMonitor’s automated discovery. If CloudWatch or Azure Monitor data is not desired, the EC2 or Azure Virtual Machines datasources can be disabled.
Enabling monitoring via local Collector will result in duplicate monitoring of the Collector data (once for the traditional version of the device and now once for the cloud version of the device). The best option is to monitor the cloud VM in duplicate like this for as long as you want to retain historical data for, and then remove the non-cloud version of the device.
During your free trial period of LogicMonitor Cloud Monitoring, this duplicate monitoring will not cost you, and at the end of it, you can choose to:- Delete the traditional version of resource (would lose history older than 6 months) – provides you with a unified view. Deleting these resource will impact any dashboard, report, or alerting configurations associated with the resource.
- Turn off local Collector monitoring for AWS EC2 instances, Azure VMs, or GCP compute engines and keep the traditional versions of resources. In this case, you continue to maintain separate views
- Turn off local Collector monitoring for AWS EC2 instances and Azure VMs, but continue to monitor other AWS and Azure services and account level data.
- Import new LogicModules – Gets additional monitoring for resources, cloud provider availability, and billing.
- (Optional) Set up Cloud Logs – Enables you to get event data as logs and troubleshoot faster with anomaly detection and log or metric correlation. For more information, see these instructions for Setting up AWS Logs Ingestion, Setting up Azure Logs Ingestion, Setting up GCP Logs Ingestion.
Currently Monitoring Only CloudWatch Metrics
If you already have an AWS, Azure, or GCP account monitored in LogicMonitor, you can do the following to take advantage of the LogicMonitor Collector and get more visibility into your cloud VMs:
- Enable monitoring via local Collector in your existing AWS, Azure, and GCP account – Lets you see Collector metrics in the same view in which you already see CloudWatch and Azure Monitor API metrics.
- Import new LogicModules – Gets additional monitoring for resources, cloud provider availability, and billing.
- (Optional) Set up Cloud Logs – Enables you to get event data as logs and troubleshoot faster with anomaly detection and log or metric correlation. For more information, see these instructions for Setting up AWS Logs Ingestion, Setting up Azure Logs Ingestion, Setting up GCP Logs Ingestion.
Monitoring your Microsoft Azure environment with LogicMonitor helps you to manage performance and identify potential faults. Add LogicMonitor to your Azure environment to monitor the state of your Azure deployment, underlying services, and license usage.
Requirements
You must register your LogicMonitor account as an app with Microsoft Azure Entra ID in your Azure console before adding Azure to LogicMonitor. For more information, see Register an application with the Microsoft identity platform from Microsoft Azure.
You need the following credentials from this process when finished:
- Azure Tenant ID–Directory (tenant) ID from Azure > App Registrations > Overview.
- Azure Client ID– Application (client) ID from Azure > App Registrations > Overview.
- Azure Secret Key–Value from Azure > App Registrations > Certificates & Secrets > Client Secrets.
Adding Your Azure Environment to LogicMonitor
After you register LogicMonitor in your Azure environment, you can add Azure to LogicMonitor for monitoring and logs. For more information, see Sending Azure Logs.
Use the following steps to add the required information about your Azure App Registration:
1. Navigate to Resources > Add > Cloud Account.
Note: If you’re using the New UI Preview toggle, go to Resources > Add [+] > Cloud and SaaS.
2. Select Azure > Add.
3. On the Name page, enter a Name and Description for your Azure account. These fields determine how your Azure resource is displayed throughout the LogicMonitor environment.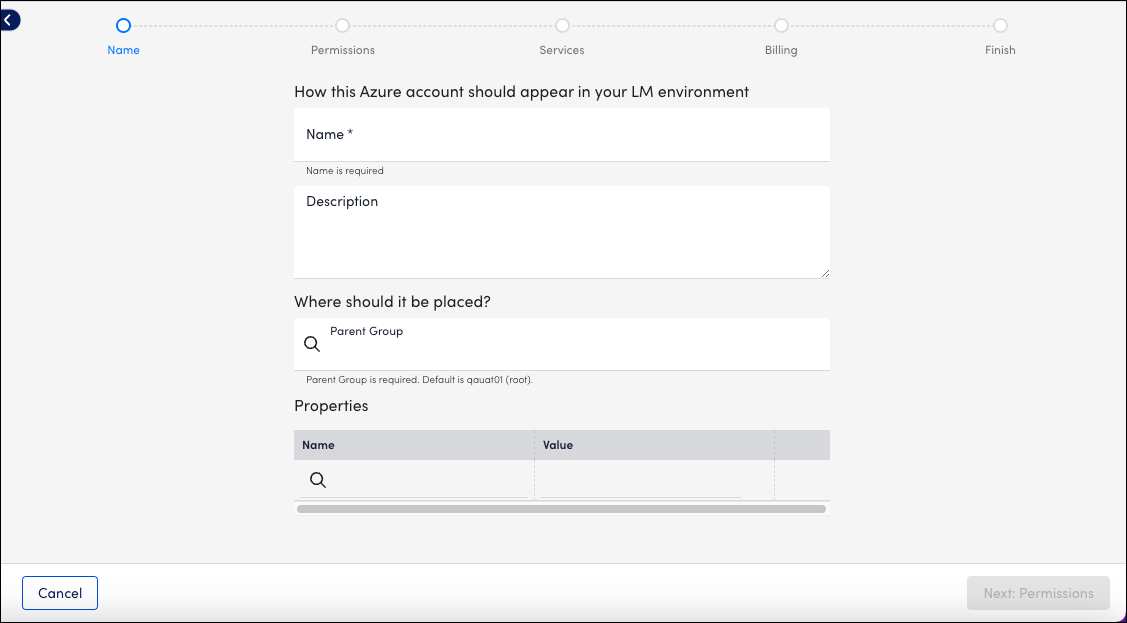
4. To place the new resource into an existing group, select the group from Parent Group field. You can type to search. The default value is root, or the first level of the Resources Tree.
5. (Optional) You can enter key-value pair properties by entering a Name and Value. Or, you can select from a list of existing properties. For more information, see Instance and Resource Properties.
6. Select Next: Permissions.
7. On the Permissions page, enter the Azure Tenant ID, Azure Client ID, and Azure Secret Key.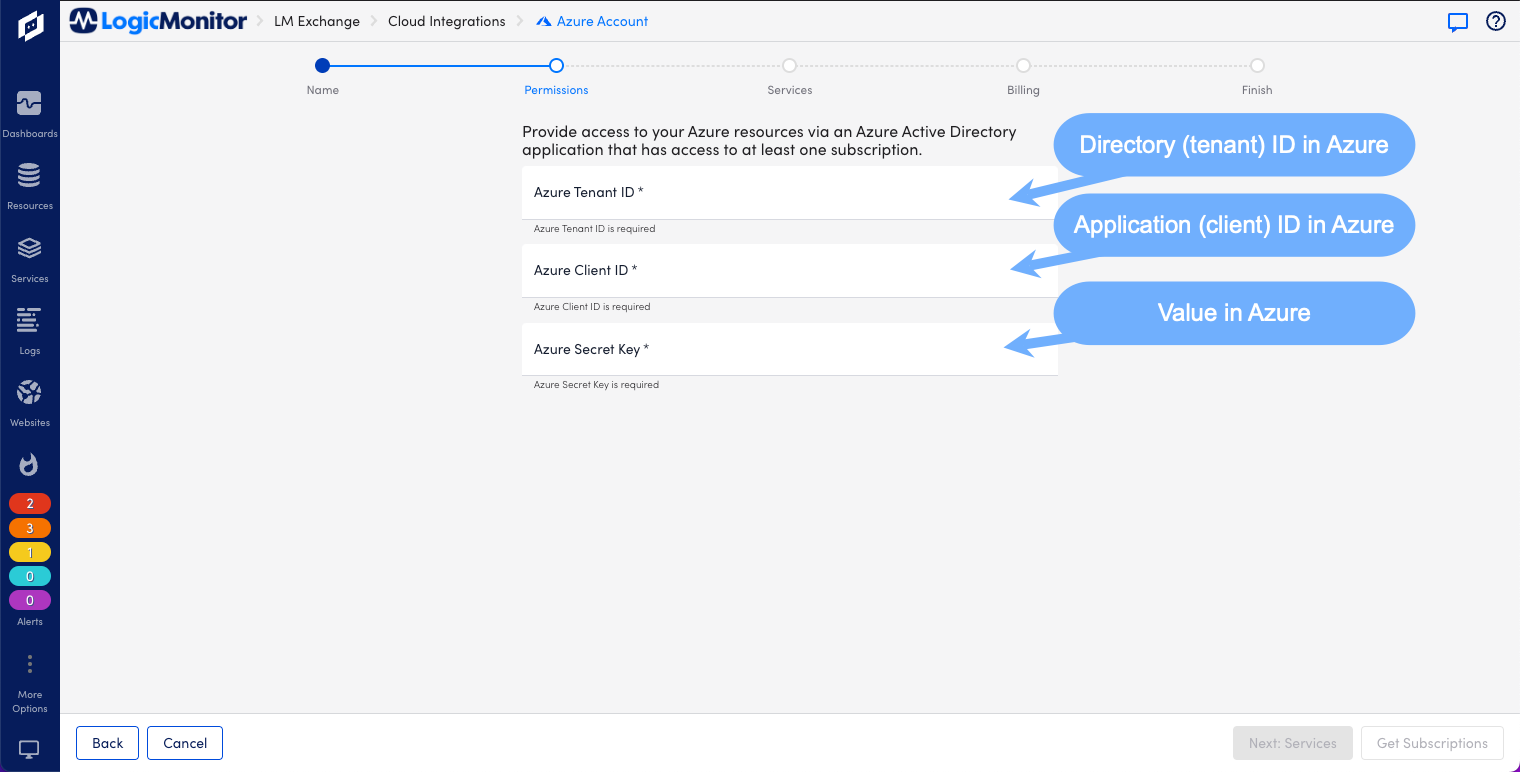
8. Select Get Subscriptions. All subscriptions available to LogicMonitor based on the permissions you’ve configured are listed. If you don’t see the subscriptions you expect, verify that the application you created in Azure has reader permissions for those subscriptions.
9. Select Next: Services.
10. On the Services page, enable or disable the Azure services listed to customize monitoring your environment.
Note: If you’re adding LogicMonitor services for Backup Protected Items or Recovery Protected Items, you need to make configuration changes to the Recovery Service Vault and Log Analytics Workspace in Microsoft Azure. For more information, see Forwarding Backup and Recovery Events.
11. Select Test Permissions to authenticate.
12. Select Next: Billing.
13. On the Billing page, enter the Subscriptions ID, Offer ID, and Monthly Billing Date. 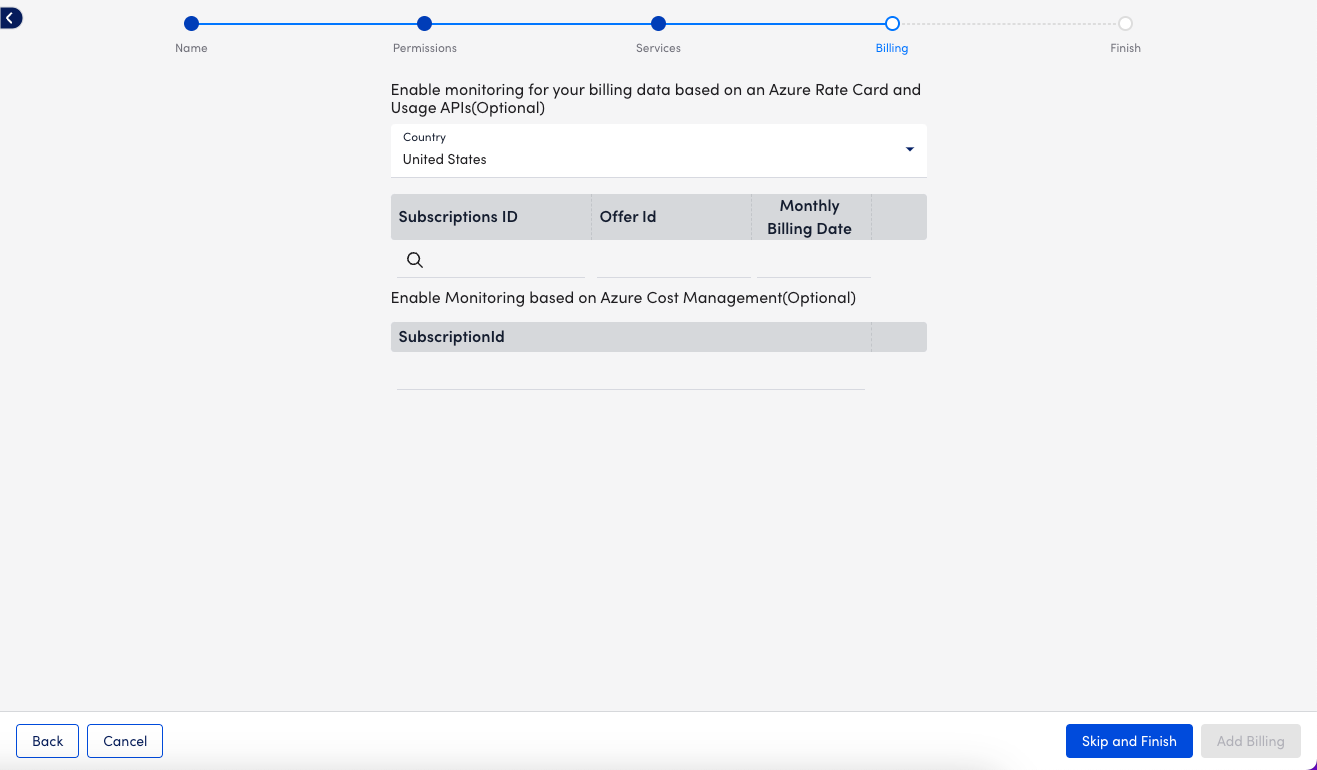
Note: You have the option to provide Billing details using Azure Rate Card or Azure Cost Management. LogicMonitor recommends using Azure Cost Management whenever possible. For Azure Cost Management, enter the Subscription ID from Azure > Subscriptions > Overview. For Rate Card, go to Azure > Subscriptions > Settings > Billing Properties > Microsoft Azure Plan to view your plan’s Subscription ID, Offer ID, and Monthly Billing Date. For more information, see Monitoring Azure Billing.
14. Select Add Billing and then select View Azure Resources to finish.
Configuring Azure Services in LogicMonitor
- Navigate to Resources and select the Azure resource that you added.
- Select Manage and then select the Services tab.
- Select Default Settings.
- On the Global Settings tab:
- NetScan Frequency: Select the preferred frequency for scheduling NetScans.
- Automatically delete terminated Azure resources if they are no longer available in the cloud portal: Enable to automatically remove “dead” instances. You can also select whether this happens immediately or after a specified period during, where no data is received for the instance. This does not remove resources terminated prior to adjusting this setting. These resources must be deleted manually.
- Automatically disable alerting for terminated Azure resources if they are no longer available in the cloud portal: Select this option to disable alerting for terminated instances. This ensures that you will not receive any alerts once instances are terminated if they are not scheduled to be automatically deleted.
Note: LogicMonitor intelligently and automatically stops Azure Monitor API data collection once instances are terminated. This option ensures that you do not receive alerts for traditional Collector DataSources like Ping.
- (Optional) If you are configuring monitoring preferences for the Virtual Machine service, enable Enhanced Detection on the Discovery Settings tab to improve detection. You do not need to set a custom NetScan frequency if you enable this option.
- In the Monitored Regions section, you can enable or disable the regions that you want to monitor.
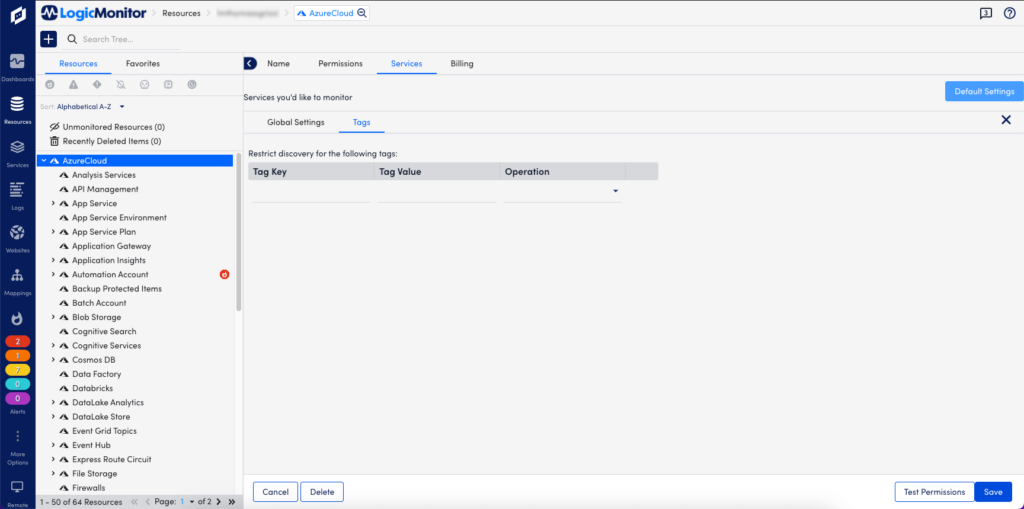
- Select the Tags tab. To monitor Azure instances for a particular service, you can tag those instances from your Azure portal and then apply a tag filter in LogicMonitor. If you specify a tag filter, only Azure resources that meet the filter criteria will be added to your LogicMonitor account. The criteria is as follows:
- You can use glob expressions with the tag filter. For example:
tag value = prod* - Resources are discovered when they contain one or more tags specified with an include operation, and not with any of the exclude tags.
- The tag filter is case sensitive.
- You can use glob expressions with the tag filter. For example:
- Select Save.
For a list of Azure services monitored, see Cloud Services and Resource Units. Due to how Azure generates metric data, there may be a delay before logs and metrics appear in LogicMonitor. This delay time varies based on the type and size of the data gathered from Azure.
LM Cloud provides seamless setup and API-based monitoring of AWS, GCP, and Microsoft Azure environments. It also supports business-critical SaaS applications, such as Office 365, Salesforce, Zoom, or any supported by Atlassian Statuspage.io. It includes a fast, three-step setup wizard that automatically discovers, applies, and scales monitoring for your entire Cloud ecosystem. LM Cloud offers executive-level dashboards and deep-dive technical insights into AWS, GCP, and Microsoft Azure together with other infrastructure on one unified platform.
Cloud Monitoring Strategy
The Cloud monitoring strategy includes the following components critical to measuring the overall health and performance of your Cloud infrastructure.
| Component | Description |
| Resource Performance and Events | Performance data, such as metrics for CloudWatch, Azure Monitor, and LogicMonitor Collector (Application, OS-level, and custom). Event data, such as CloudWatch Events and Azure Activity Log Events. |
| Cloud Provider Availability | Availability data, such as data provided by AWS and Azure status RSS feeds. Data is measured by the LogicMonitor Collector, and scheduled maintenance events. Service Limit Utilization data. |
| Spend and Billing Information | Return On Investment (ROI) metrics, including spend data per region, service, or tag. Reserved instances offer expiration dates. |
Cloud Data Collection
LogicMonitor collects data using the following methods:
- Application program interface (API) offered by the Cloud provider
- LogicMonitor Collector
A LogicMonitor Collector is not required for LM Cloud, but it provides more comprehensive monitoring for your Cloud resources. It offers OS-level, application, and custom metrics for AWS EC2 instances and Azure VMs, which are not available through their monitor APIs. For example, a collector installed within AWS monitors Apache running on any EC2 instance and traditional OS-level metrics such as disk usage and memory usage (not reported with AWS CloudWatch). The collector also offers Cloud provider availability checks. For more information, see About the LogicMonitor Collector.
Cloud Monitoring Setup Wizard
Cloud monitoring begins with a setup wizard that automatically discovers your Cloud account and adds it to your LogicMonitor resources. The wizard collects permissions, services, and billing information about your Cloud account. Once the information you provide is submitted and verified, your Cloud environment is added to the LogicMonitor Resources page. There are setup wizards for:
Cloud Resources
Cloud resources automatically discovered by the setup wizard are displayed on the Resources page. DataSources that are pre-configured to perform API calls and queries are automatically applied to discovered resources. If you have a collector deployed within your Cloud environment, traditional collector DataSources based on SNMP or WMI, are also automatically applied to discovered resources. Cloud resources are displayed in the Resources Tree as follows:
| Resource | Description |
| Cloud Account Group | Top-level group that contains all monitored Cloud resources and services. This group uses the name provided in the setup wizard.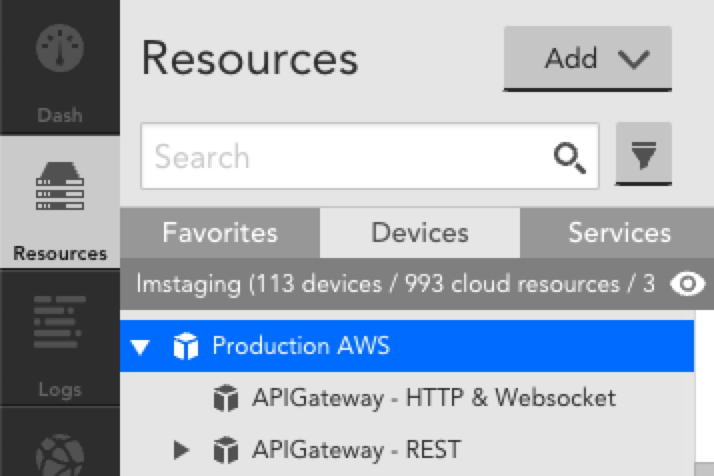 |
| Cloud Service Group | Service-level group that includes all resources for a specific Cloud service. Each service may include: * Resource or resource group * DataSource or DataSource group * Instance or instance group 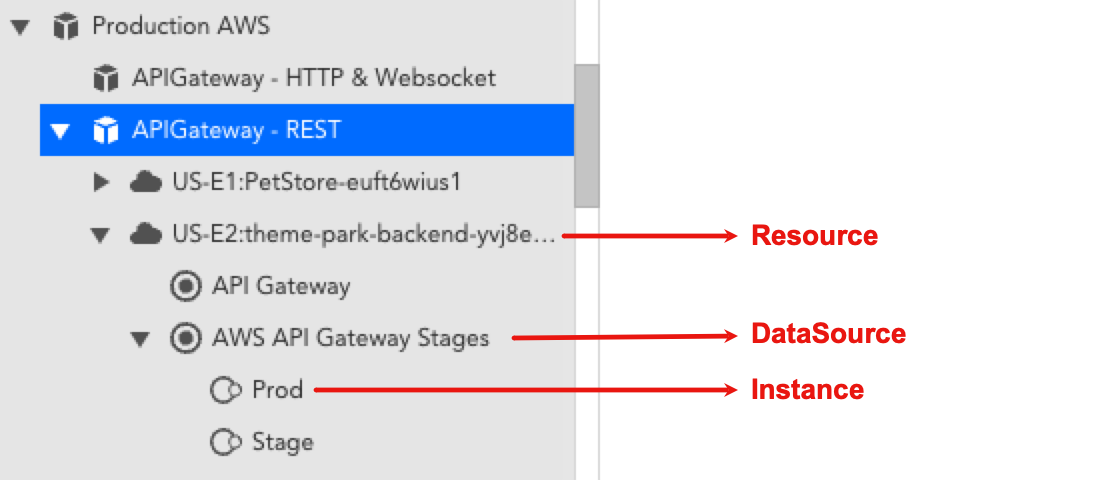 |
| Cloud Account Resource | Account-level resource that displays Cloud account information that is not tied to a specific service. This resource is named based on the name provided in the setup wizard and includes information about: * Account-level health * Service limit utilization * Provider service disruptions or outages 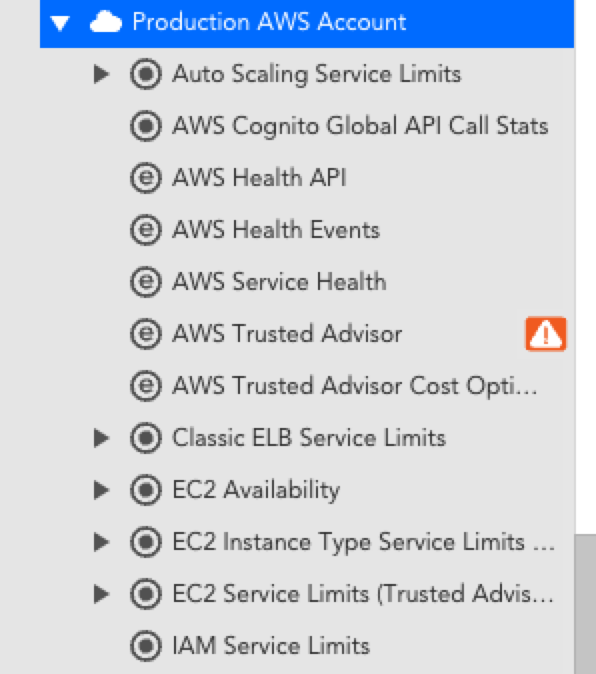 |
Billing Monitoring
You can monitor billing information about your Cloud accounts. For more information:
Dashboards and Reports
LogicMonitor automatically creates dashboards and reports when you add an AWS, Microsoft Azure, or GCP account into monitoring. This provides you with instant visibility into your cloud environments and includes both overview and service-specific views. These dashboards and reports provide a starting point based on best practices, but you can customize them for your specific environment. For more information, see Dashboard Overview.
The following dashboards and reports are auto-generated for AWS, Microsoft Azure, and GCP accounts:
- Cloud environment overview
- Service-specific dashboards for AWS EC2 and EBS
- Service utilization
Note: The information displayed depends on the services you select for monitoring. A dashboard group and a report group are automatically generated and added for AWS, Microsoft Azure, or GCP accounts into LogicMonitor. Dashboard and report groups are named based on the name you assigned the AWS, Microsoft Azure, or GCP account in LogicMonitor.
Cloud Resource Tagging and Filtering
Tags are key-value pairs (metadata) that you set in your Cloud provider console (AWS, Azure, GCP). You can use tags to help identify and organize your Cloud resources.
Tags
Once resources are discovered and added to LogicMonitor, any tags associated with those resources are added as resource properties. You can access tags in LogicMonitor by navigating to the Cloud resource and selecting Manage > Services > Default Settings > Tags.
Note: Tags are case-sensitive. For more information about tags, refer to the Cloud provider documentation for AWS, Azure, or GCP respectively.
Tag Filters
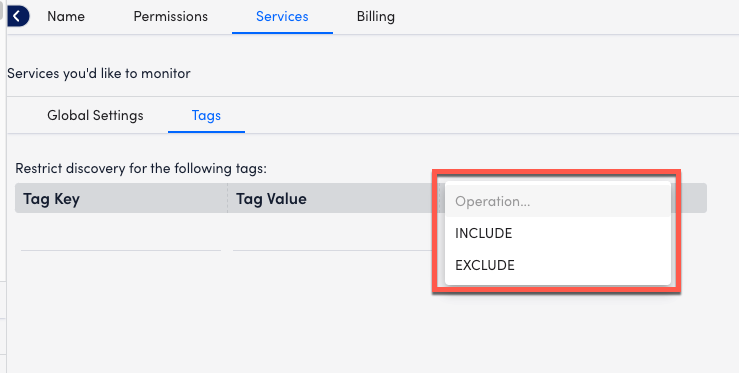
Using tag filters, you can determine which Cloud resources are auto-discovered by LogicMonitor. You can perform Include or Exclude operations on the Tag Key and Tag Value that you enter. Glob expressions are also supported for tag filtering. For more information, see Using Glob Expressions.
Tag Formatting
Tags are added and displayed as device properties in the following format:system.<cloud-provider-name>.tag.NAME=VALUE
NAME and VALUE refer to the name and value of the tag, respectively. Tag filters are case sensitive. For example, the following table displays how LogicMonitor property names correspond to an AWS tag name:
| LogicMonitor Property Name | AWS Tag Name |
| system.aws.tag.team | team |
| system.aws.tag.aws:cloudformation:stack-name | aws:cloudformation:stack-name |
Tag Referencing
You can reference tags throughout your LogicMonitor account. For example, to create a dynamic group of AWS resources that have a specific tag, you could use the following AppliesTo (custom query):
system.aws.tag.NAME=~“VALUE”
Note: If a tag name or value contains special characters, you will need to use the getPropValue function in the AppliesTo field. For more information, see AppliesTo Scripting Overview.
Monitored Locations
Locations, also referred to as regions or zones depending on the Cloud provider, are the geographical locations of data centers or hubs where Cloud resources reside. These are displayed on the Locations tab on your Resources page. LM Cloud includes the following locations.
Note: For information about monitored services, see Cloud Services and Resource Units.
AWS Locations
| Code | Location |
| af-south-1 | Africa (Cape Town) |
| ap-east-1 | Asia Pacific (Hong Kong) |
| ap-northeast-1 | Asia Pacific (Tokyo) |
| ap-northeast-2 | Asia Pacific (Seoul) |
| ap-south-1 | Asia Pacific (Mumbai) |
| ap-southeast-1 | Asia Pacific (Singapore) |
| ap-southeast-2 | Asia Pacific (Sydney) |
| ap-southeast-3 | Asia Pacific (Jakarta) |
| ca-central-1 | Canada (Central) |
| eu-central-1 | Europe (Frankfurt) |
| eu-north-1 | Europe (Stockholm) |
| eu-south-1 | Europe (Milan) |
| eu-west-1 | Europe (Ireland) |
| eu-west-2 | Europe (London) |
| eu-west-3 | Europe (Paris) |
| me-south-1 | Middle East (Bahrain) |
| sa-east-1 | South America (São Paulo) |
| us-east-1 | US East (N. Virginia) |
| us-east-2 | US East (Ohio) |
| us-west-1 | US West (N. California) |
| us-west-2 | US West (Oregon) |
For more information, refer to the AWS documentation for Regions and Zones.
Azure Locations
| Code | Location |
| australiacentral | Australia (Canberra) |
| australiacentral2 | Australia (Canberra) |
| australiaeast | Australia (New South Wales) |
| australiasoutheast | Australia (Victoria) |
| brazilsouth | Brazil (São Paulo State) |
| canadacentral | Canada (Toronto) |
| canadaeast | Canada (Quebec City) |
| centralindia | India (Pune) |
| centralus | US (Iowa) |
| chinaeast | China (Shanghai) |
| chinaeast2 | China (Shanghai) |
| chinaeast3 | China (Shanghai) |
| chinanorth | China (Beijing) |
| chinanorth2 | China (Beijing) |
| chinanorth3 | China (Hebei) |
| eastasia | Asia (Hong Kong) |
| eastus | US (Virginia) |
| eastus2 | US (Virginia) |
| francecentral | France (Paris) |
| germanycentral | Germany (Frankfurt) |
| japaneast | Japan (Tokyo) |
| japanwest | Japan (Osaka) |
| koreacentral | Korea (Seoul) |
| northcentralus | US (Illinois) |
| northeurope | Europe (Ireland) |
| norwayeast | Norway (Oslo) |
| southafricanorth | South Africa (Johannesburg) |
| southcentralus | US (Texas) |
| southeastasia | Southeast Asia (Singapore) |
| southindia | India (Chennai) |
| switzerlandnorth | Switzerland (Zürich) |
| uaenorth | UAE (Dubai) |
| uksouth | UK (London) |
| ukwest | UK (Cardiff) |
| westcentralus | US (Wyoming) |
| westeurope | Europe (Netherlands) |
| westus | US (California) |
| westus2 | US (Washington) |
| westus3 | US (Arizona) |
For more information, refer to the Azure documentation for Azure geographies.
GCP Locations
| Code | Location |
| africa-south | Africa (Johannesburg) |
| asia-east1 | Asia (Taiwan) |
| asia-east2 | Asia (Hong Kong) |
| asia-northeast1 | Asia (Tokyo) |
| asia-northeast2 | Asia (Osaka) |
| asia-northeast3 | Asia (Seoul) |
| asia-south1 | Asia (Mumbai) |
| asia-south2 | Asia (Delhi) |
| asia-southeast1 | Asia (Singapore) |
| asia-southeast2 | Asia (Jakarta) |
| australia-southeast1 | Australia (Sydney) |
| australia-southeast2 | Australia (Melbourne) |
| europe-central2 | Europe (Warsaw) |
| europe-north1 | Europe (Hamina) |
| europe-west1 | Europe (St. Ghislain) |
| europe-west2 | Europe (London) |
| europe-west3 | Europe (Frankfurt) |
| europe-west4 | Europe (Eemshaven) |
| europe-west6 | Europe (Zurich) |
| europe-west8 | Europe (Milan) |
| europe-west9 | Europe (Paris) |
| europe-west10 | Europe (Berlin) |
| europe-west12 | Europe (Turin) |
| europe-southwest1 | Europe (Madrid) |
| me-central1 | Middle East (Doha) |
| me-central2 | Middle East (Dammam) |
| me-west1 | Middle East (Tel Aviv) |
| northamerica-northeast1 | North America (Montréal) |
| northamerica-northeast2 | North America (Toronto) |
| southamerica-east1 | South America (Osasco) |
| southamerica-west1 | South America (Santiago) |
| us-central1 | US (Iowa) |
| us-east1 | US (South Carolina) |
| us-east4 | US (Virginia) |
| us-east5 | US (Columbus) |
| us-west1 | US (Oregon) |
| us-west2 | US (California) |
| us-west3 | US (Utah) |
| us-west4 | US (Nevada) |
| us-south1 | US (Dallas) |
For more information, refer to the GCP documentation for Regions and zones.
Similar to how the Poll Now feature can be used to troubleshoot traditional, local Collector-based LogicModules, you can use Poll Now to troubleshoot CloudWatch data collection. Remember that CloudWatch data is collected via a LogicMonitor maintained Collector. Poll Now provides the visibility you need to identify potential issues in data collection, such as permission issues or DataSource mis-configurations. Examples of when you may find Poll Now useful include:
- Troubleshooting DataSources configured to collect custom CloudWatch metrics
- Troubleshooting a lack of non-custom CloudWatch metrics
The Poll Now feature displays on the Raw Data tab:
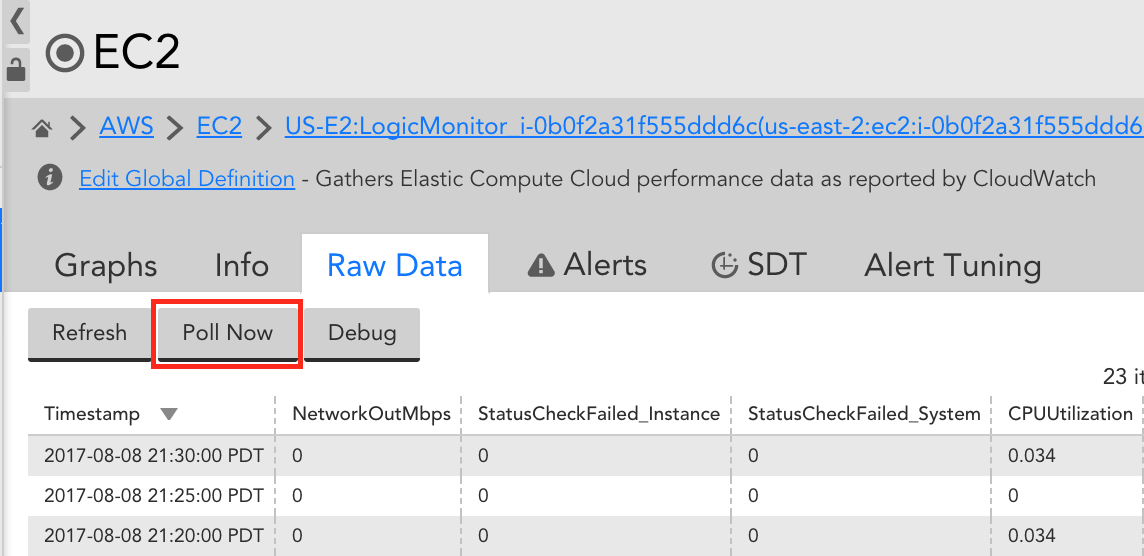
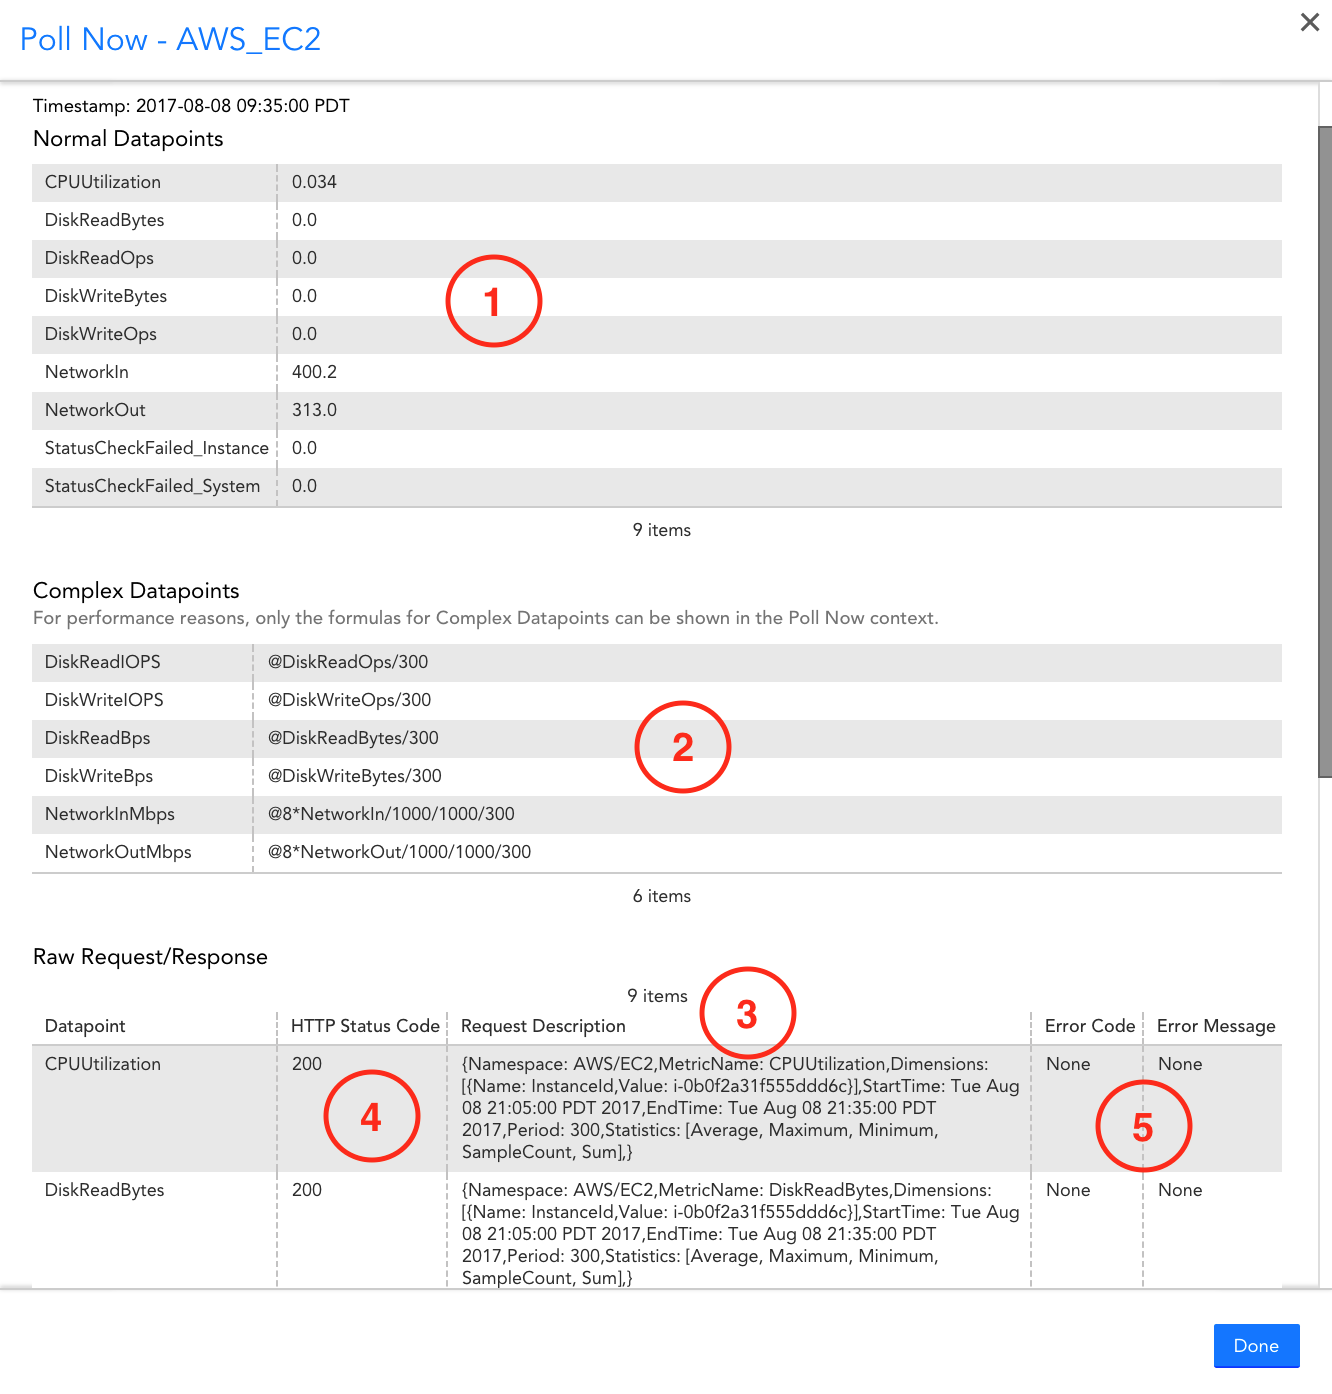
When selected, it will poll AWS CloudWatch and display:
- Data returned
- Complex datapoint expressions
- CloudWatch GetMetricStatistics Request details (including values for tokens present in datapoint metric paths)
- HTTP Status returned by AWS API
- Error message/code returned by AWS API
LogicMonitor’s AWS DataSources leverage the CloudWatch API to collect data for your AWS resources. Depending on which AWS services and how many resources you monitor, you may see CloudWatch costs associated with LogicMonitor’s AWS Cloud Monitoring. LogicMonitor makes one API call per DataSource per Resource. Since the AWS charge is based on the number of datapoints the data is requested for, the CloudWatch costs are dependent on the number of datapoints, polling interval, and how many resources the DataSource applies to. For more information, see the Amazon CloudWatch Pricing information from AWS.
The CloudWatch DataSources poll every one to five minutes (60 min/hour, 24 hours/day, 30 days/month), depending on how often CloudWatch metrics are published for the particular service. You can estimate the costs that LogicMonitor contributes to your CloudWatch Costs (after you surpass the free tier). The following table displays example cost estimates for an AWS service contributed by LogicMonitor for a month:
| AWS Service | Number of Datapoints | Polling Interval (min) | Total Number of Metrics Request per Month (60 min/hour, 24 hours/day, 30 days/month) | CloudWatch Charge Rate | Estimated Additional Cost per Resource per Month |
| API Gateway | 7 | 3 | 100,800 | $0.01 per 1,000 metrics requested | $1.01 |
| CloudFront | 7 | 2 | 151,200 | $1.50 | |
| DynamoDB | 10 | 5 | 86,400 | $0.86 | |
| EBS | 8 | 5 | 69,120 | $0.69 | |
| EC2 | 11 | 5 | 95,404 | $0.95 | |
| EFS | 24 | 3 | 345,600 | $3.46 | |
| S3 | 3 | 1440 | 90 | $0.0009 |
Recommendations to Optimize CloudWatch Costs
The following table lists the recommendations to help manage the contributing costs from LogicMonitor for your CloudWatch costs:
| Recommendation | Description |
| (Applies to monitoring EC2 instances) Use Collector DataSources where possible | Install a Collector in your AWS environment and rely on Collector DataSources instead of the AWS_EC2 CloudWatch DataSource. Disabling monitoring for the AWS_EC2 DataSource reduces costs per instance per month in CloudWatch costs. Note: Any cloud resource monitored with a Collector counts towards a normal device license and not a cloud license. For more information, see Enabling Monitoring via Local Collector. |
| Increase polling intervals | You can increase CloudWatch DataSources polling intervals to poll less frequently, which reduces the number of CloudWatch API calls. Increasing the polling interval impacts alert evaluation. For example, if you change all polling intervals to every ten minutes, you may not know about a possible alert condition for longer. Polling intervals can be changed in the DataSource definition. For more information, see Creating a DataSource. |
| Determine which datapoints are meaningful to you | AWS DataSources can have over 20 datapoints (for example, EFS). If some of those datapoints are not meaningful, you can remove them from the DataSource definition, resulting in fewer CloudWatch API calls. You can clone the existing DataSource, set the appliesTo function to “false()” to prevent duplicated CloudWatch calls, and then remove the unwanted datapoints from the clone. This prevents your changes from being overridden when updating DataSource definitions. |
| Deselect AWS regions to monitor | Deselect the regions that you do not want to monitor. Note: Deselecting the AWS regions deletes the monitoring data. |
| Use tag filter | You can set up tag filtering to allow LogicMonitor to only discover AWS resources with a particular tag applied to them. |
If you use CloudFormation to create and manage entire ‘stacks’ of AWS resources, you should group the resources within each stack together in LogicMonitor. Grouping stack resources will make it easier to create properties, thresholds, SDTs, OpsNotes and more for all resources in the stack. In addition, consider creating a LogicMonitor dashboard for each of your CloudFormation stacks. A dashboard that displays the status and values of the resources within your stack will provide a general overview of the performance of your stack and will help you troubleshoot issues more quickly.
Create a dynamic group based on AWS tags
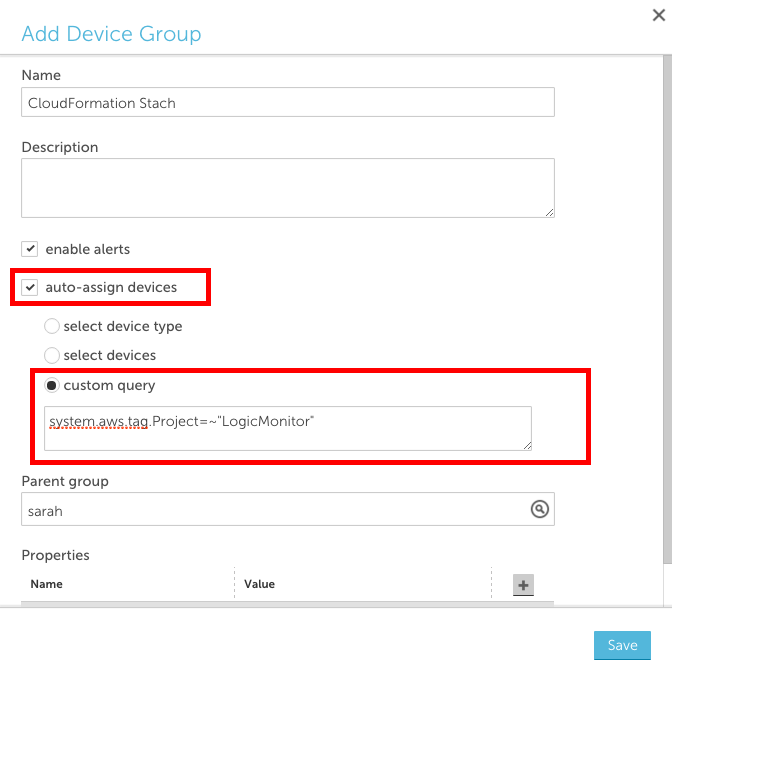
One way to achieve this grouping is to tag your resources in AWS and create a LogicMonitor dynamic group based on those tags. You can use AWS tags to create dynamic groups in LogicMonitor such that all AWS resources with a specific tag are placed in one group. To do this:
- Ensure that the resources in your CloudFormation stack are tagged
- Add a new device group and select the ‘auto-assign devices’ checkbox
- Enter a custom query to match your AWS tag in the following format: system.aws.tag.NAME=~ “VALUE”, where NAME and VALUE should correspond to the AWS tag name and value, respectively.
Create a dashboard for each stack
Consider creating a dashboard for each of your CloudFormation stacks with:
- one or more NOC widgets that display the status of each AWS resource within the stack
- an alert widget that only displays alerts that triggered for resources in the stack
- any relevant custom graph widgets or service status widgets for the AWS resources within the stack
When issues arise, a dashboard dedicated to your stack will allow you to see which components of the stack are performing as expected and which ones aren’t, enabling you to identify issues for the whole stack much more quickly.
Example
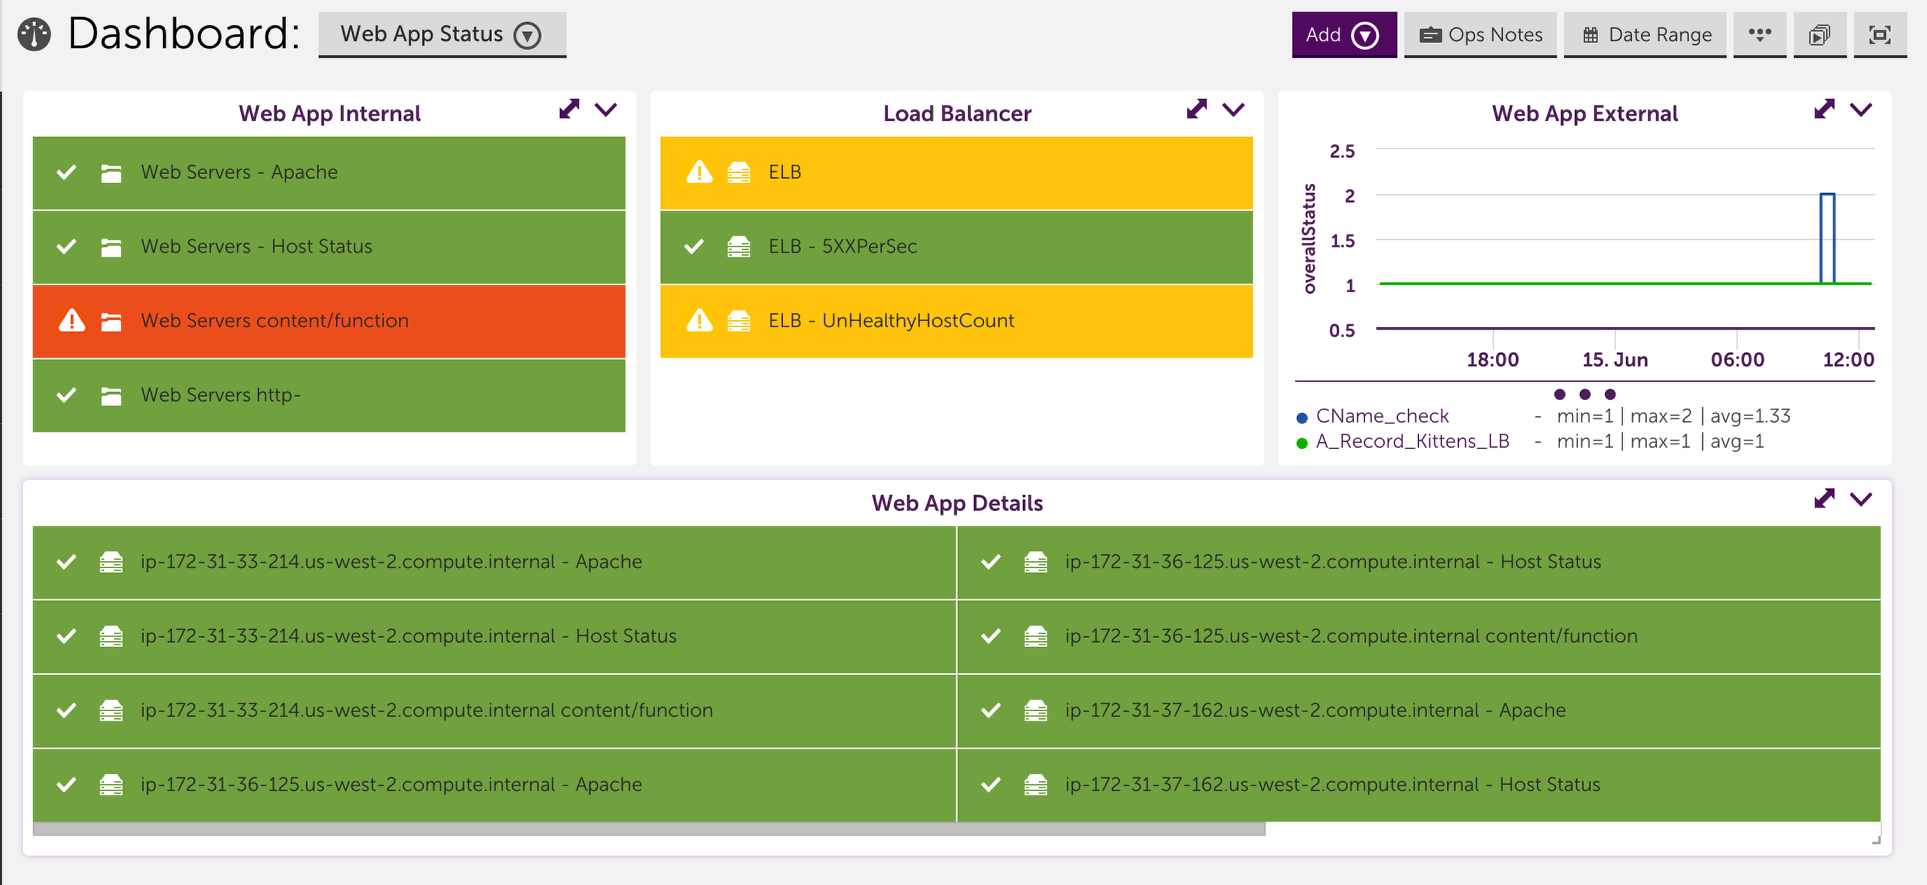
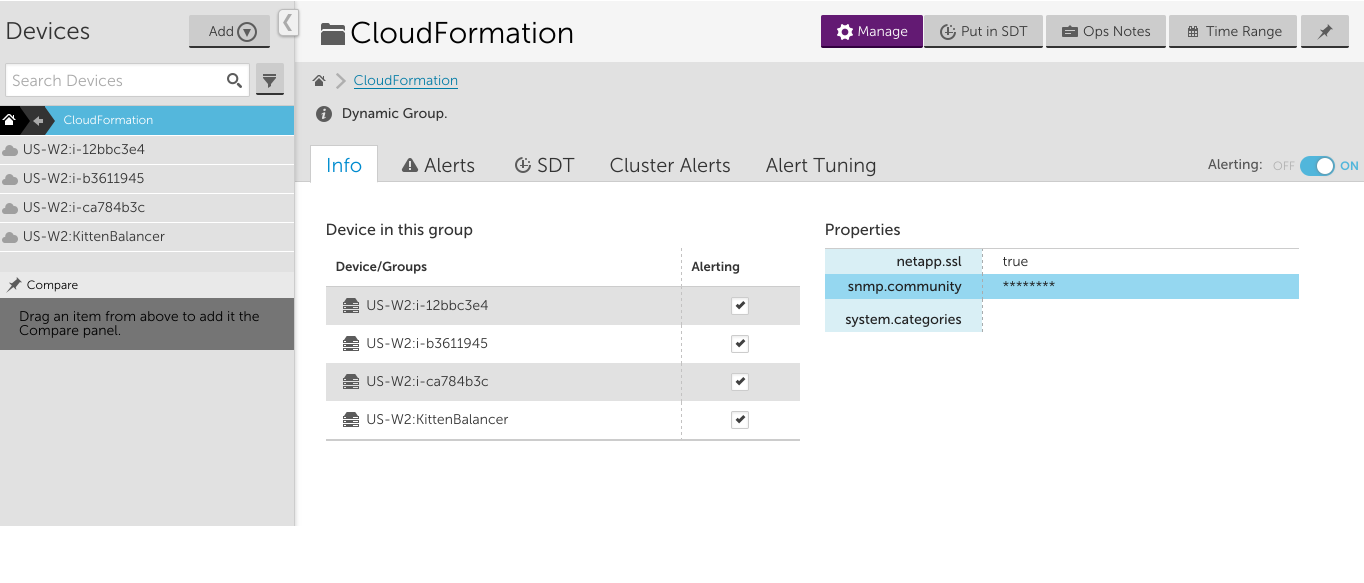
For example, consider the following CloudFormation stack:
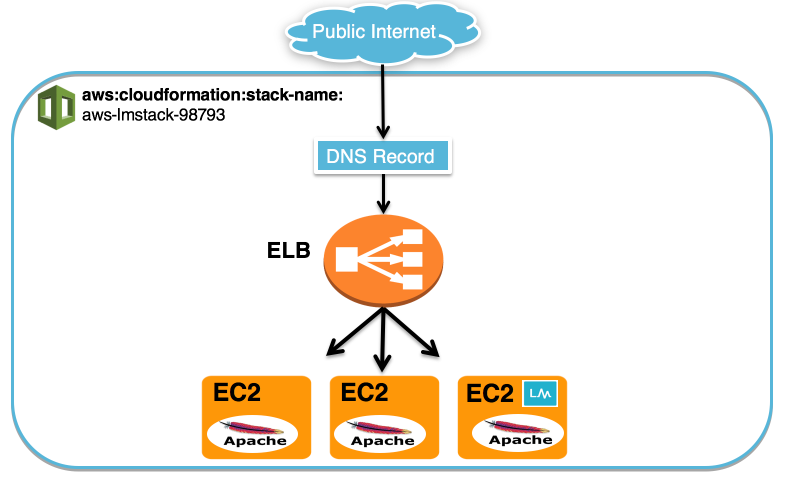
We used CloudFormation to create three EC2 servers, one ELB and a DNS record for our website. We installed Apache on the three EC2 servers and we also installed a collector on one of the EC2 servers so that we could monitor the instances using both LogicMonitor’s AWS monitoring functionality and a local collector.
Each of the EC2 instances and the ELB have a tag added by CloudFormation with Name= aws:cloudformation:stack-name and Value=aws-lmstack-98793. Using LogicMonitor dynamic grouping functionality, we set up group that includes devices with that tag using the following custom query:
system.aws.tagaws:cloudformation:stack-name =~ "aws-lmstack-98793"By grouping the EC2 instances and ELB, we were able to set an snmp.community string property across all three EC2 instances. This would be tedious to do individually for each instance in a stack with a large number of resources. Additionally, grouping stack resources makes it easier to set alert thresholds or schedule an SDT during maintenance for the whole stack.
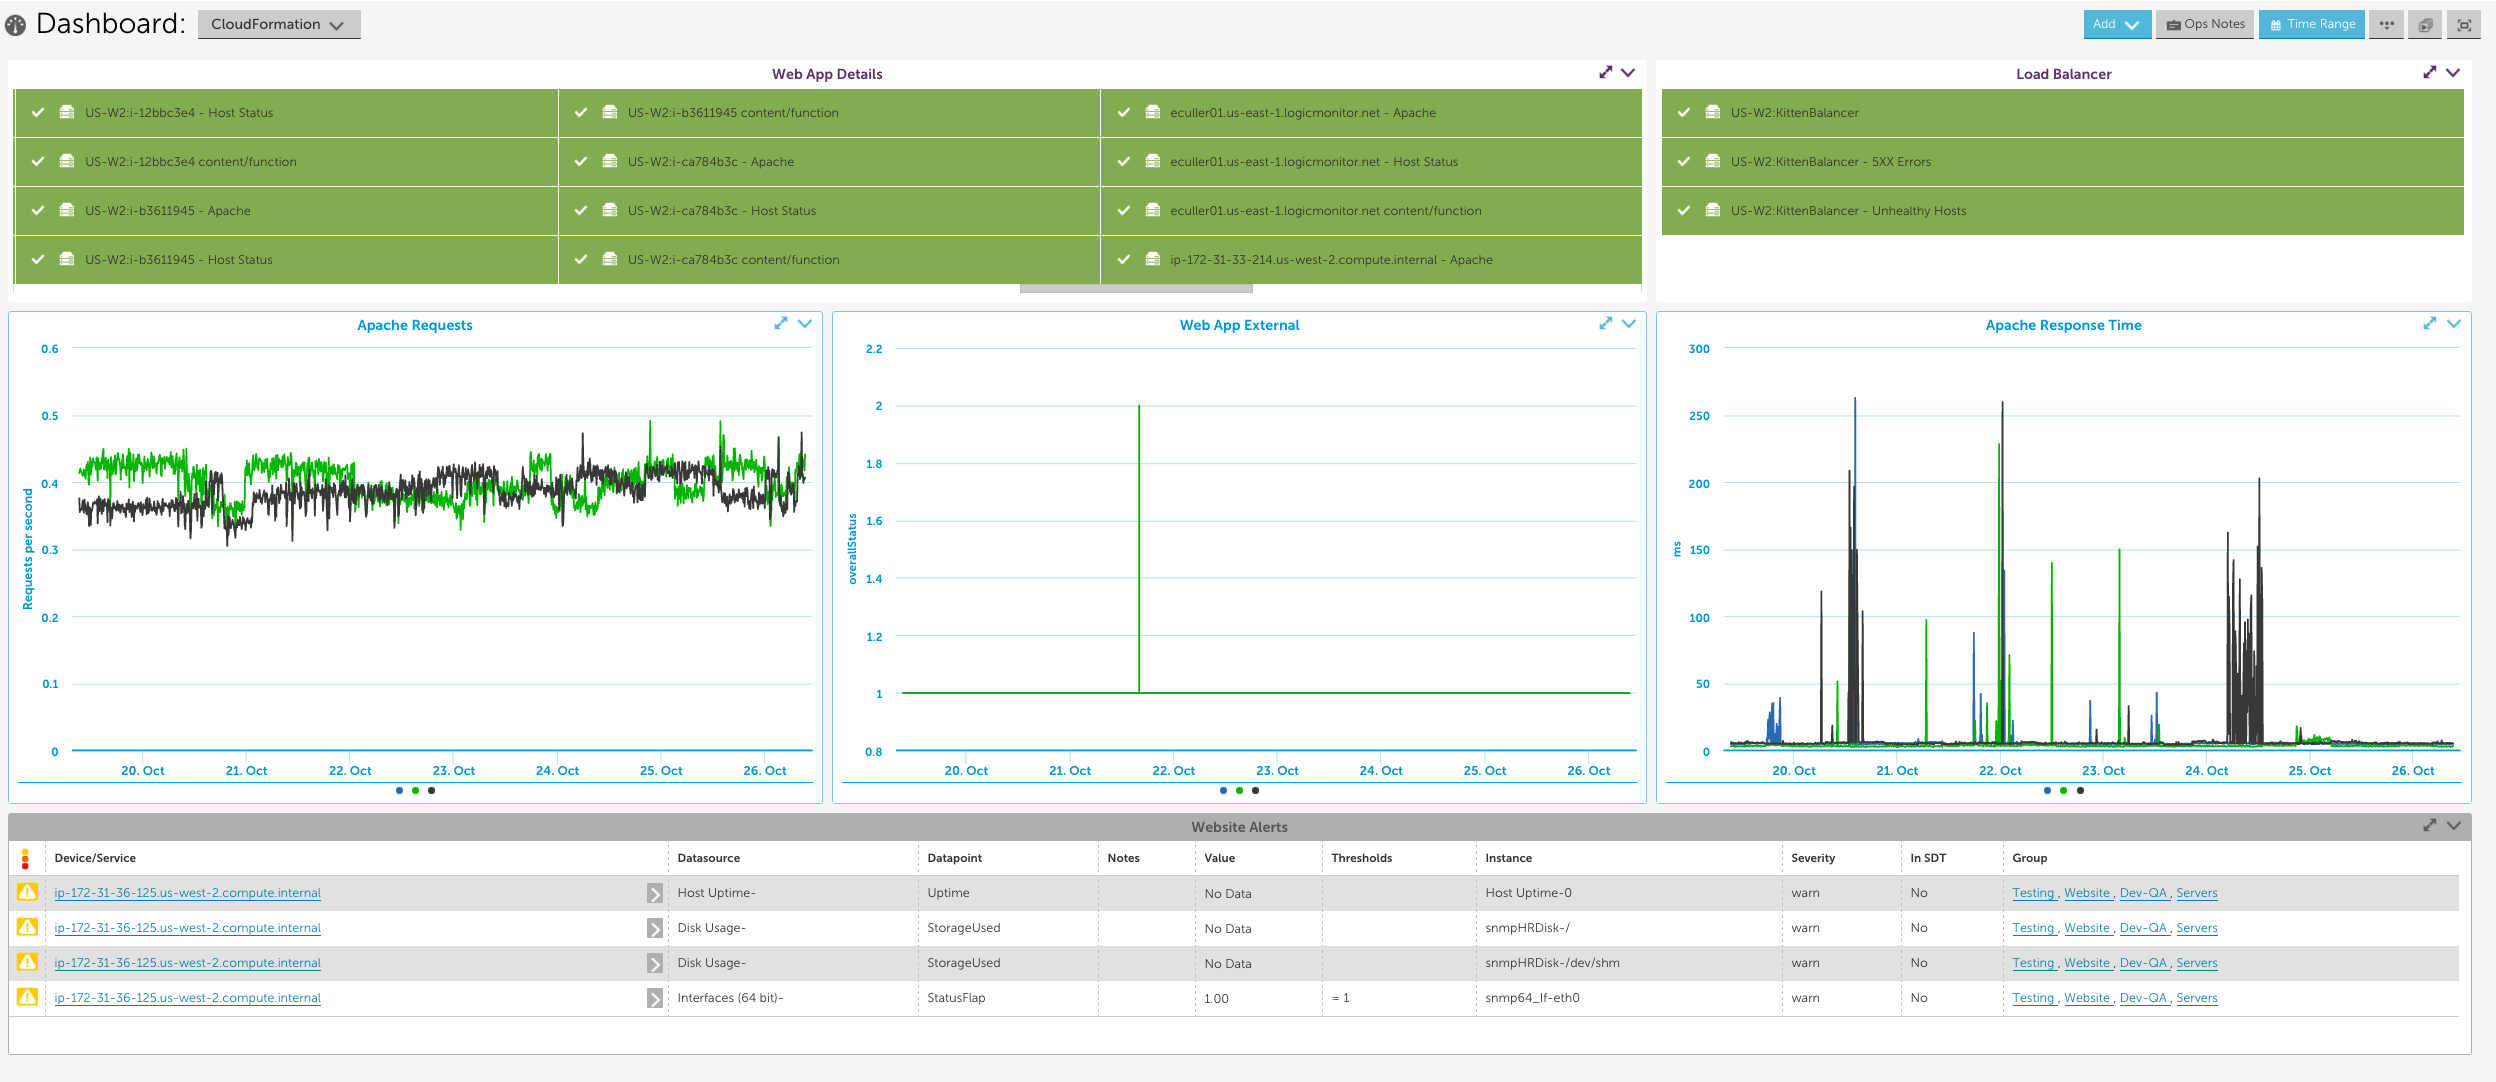
We set up the following dashboard to display the statuses of the EC2 instances, Load Balancer, and website service check, as well as the Apache metrics and any active alerts for our entire stack. Note that in order to monitor Apache using LogicMonitor’s Apache datasources you must install a collector in your local environment.
If your company uses AWS to host applications that support your day to day operations, you should ensure that you set up your monitoring in a way that helps you maximize the uptime of these applications. Specifically, consider the following recommendations:
1. Monitor the server side infrastructure components that your application is running on
Use LogicMonitor’s standard monitoring and AWS monitoring functionalities to comprehensively monitor the different behind the scenes cloud infrastructure components that your application relies on. This includes setting up monitoring for your EC2 instances, ELBs, S3 buckets and any other AWS backend resources your application uses. Comprehensively monitoring these components will enable you to quickly pinpoint the specific components that are causing problems when issues arise.
2. Monitor the middleware used to serve your application
This can usually be accomplished one of two ways:
- Using LogicMonitor’s AWS datasources to monitor the middleware for your cloud infrastructure. As an example of this, you could monitor your RDS MySQL databases utilizing LogicMonitor’s AWS RDS datasources.
- Installing a collector within your AWS environment and using LogicMonitor’s native datasources to monitor the middleware running on your cloud infrastructure. As an example of this, you could monitor your Apache web server by installing a collector on an EC2 instance in your AWS environment, adding your EC2 instances as devices to monitoring and applying LogicMonitor’s Apache datasources.
3. Monitor the application performance from the outside
Its a good idea to monitor what a customer would experience when interacting with your application. Typically, this includes using LogicMonitor’s services checks to monitor your application from outside of your AWS environment. As an example of this, you could perform custom checks on your website that look for the presence of specific text using LogicMonitor’s services. Monitoring your application from the outside ensures that you will be able to differentiate external factors that could potentially prevent outside users from being able to access your application from issues that are occurring within the infrastructure supporting your application.
4. Set up a dashboard that displays the status of each component of your application
Consider setting up a dashboard that reflects your application. This includes setting up widgets to clearly show the status for each of the different monitored components of your application. A dashboard that is strategically set up to reflect your application enables you to look at alerts in the context of your application, allows you to compare which components are working and which aren’t and typically helps you quickly identify which component is causing the underlying issue. For example, the dashboard could include device NOC widgets that display the status of the backend infrastructure and middleware, and a service graph that displays front end performance checks: