Monitoring your AWS CloudFormation stack
Last updated on 27 March, 2023If you use CloudFormation to create and manage entire ‘stacks’ of AWS resources, you should group the resources within each stack together in LogicMonitor. Grouping stack resources will make it easier to create properties, thresholds, SDTs, OpsNotes and more for all resources in the stack. In addition, consider creating a LogicMonitor dashboard for each of your CloudFormation stacks. A dashboard that displays the status and values of the resources within your stack will provide a general overview of the performance of your stack and will help you troubleshoot issues more quickly.
Create a dynamic group based on AWS tags
One way to achieve this grouping is to tag your resources in AWS and create a LogicMonitor dynamic group based on those tags. You can use AWS tags to create dynamic groups in LogicMonitor such that all AWS resources with a specific tag are placed in one group. To do this:
- Ensure that the resources in your CloudFormation stack are tagged
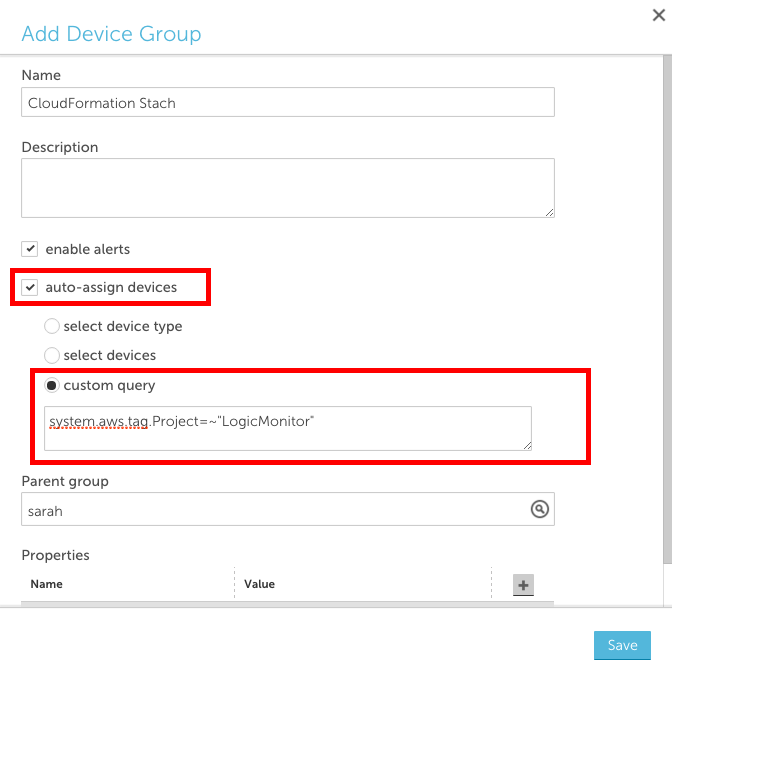
- Add a new device group and select the ‘auto-assign devices’ checkbox
- Enter a custom query to match your AWS tag in the following format: system.aws.tag.NAME=~ “VALUE”, where NAME and VALUE should correspond to the AWS tag name and value, respectively.
Create a dashboard for each stack
Consider creating a dashboard for each of your CloudFormation stacks with:
- one or more NOC widgets that display the status of each AWS resource within the stack
- an alert widget that only displays alerts that triggered for resources in the stack
- any relevant custom graph widgets or service status widgets for the AWS resources within the stack
When issues arise, a dashboard dedicated to your stack will allow you to see which components of the stack are performing as expected and which ones aren’t, enabling you to identify issues for the whole stack much more quickly.
Example
For example, consider the following CloudFormation stack:
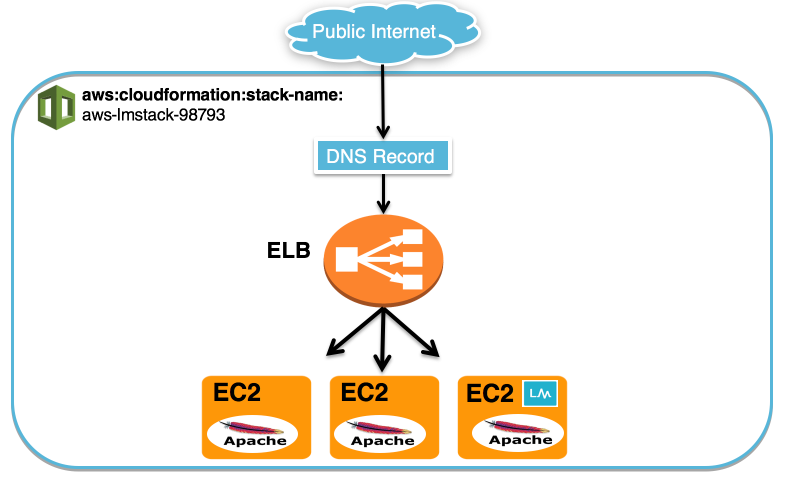
We used CloudFormation to create three EC2 servers, one ELB and a DNS record for our website. We installed Apache on the three EC2 servers and we also installed a collector on one of the EC2 servers so that we could monitor the instances using both LogicMonitor’s AWS monitoring functionality and a local collector.
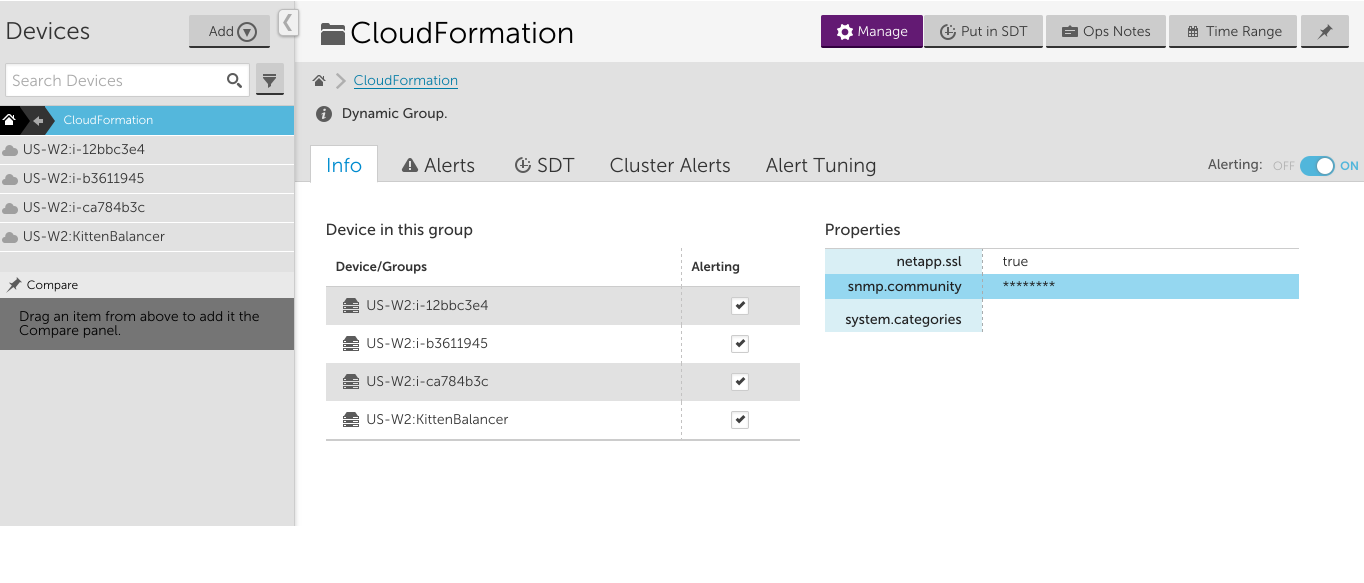
Each of the EC2 instances and the ELB have a tag added by CloudFormation with Name= aws:cloudformation:stack-name and Value=aws-lmstack-98793. Using LogicMonitor dynamic grouping functionality, we set up group that includes devices with that tag using the following custom query:
system.aws.tagaws:cloudformation:stack-name =~ "aws-lmstack-98793"By grouping the EC2 instances and ELB, we were able to set an snmp.community string property across all three EC2 instances. This would be tedious to do individually for each instance in a stack with a large number of resources. Additionally, grouping stack resources makes it easier to set alert thresholds or schedule an SDT during maintenance for the whole stack.
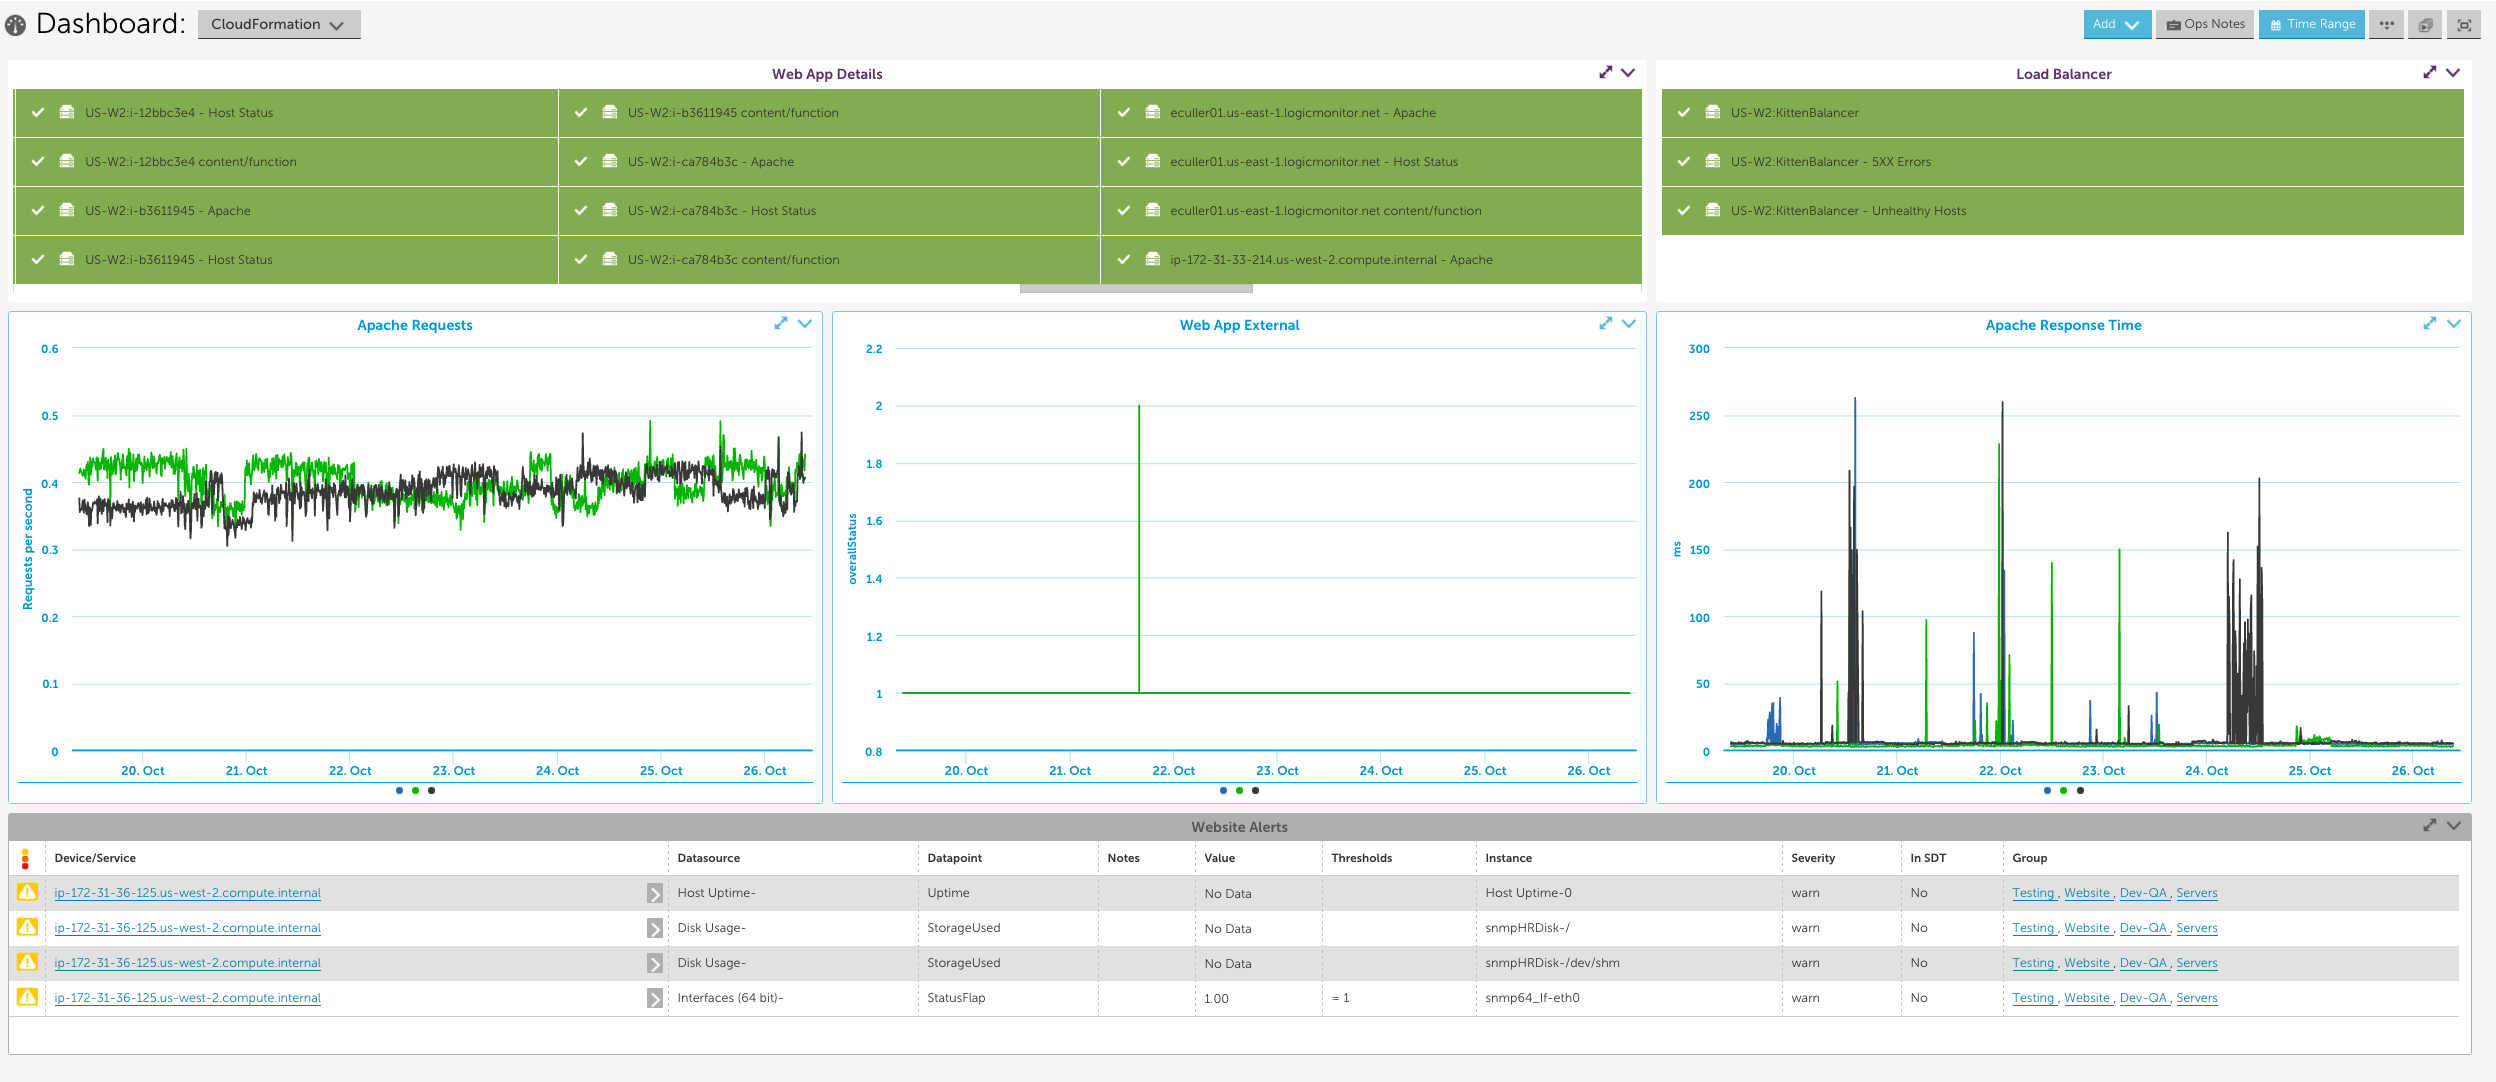
We set up the following dashboard to display the statuses of the EC2 instances, Load Balancer, and website service check, as well as the Apache metrics and any active alerts for our entire stack. Note that in order to monitor Apache using LogicMonitor’s Apache datasources you must install a collector in your local environment.