OpenTelemetry is a project by the Cloud Native Computing Foundation aimed to standardize the way that application telemetry data is recorded and utilized by platforms downstream. This application trace data can be valuable for application owners to understand the relationship between the components and services in their code, the request volume and latency introduced in each step, and ultimately where the bottlenecks are that are resulting in poor user experience.
Use this guide to write a Ruby application emitting traces using the OpenTelemetry Protocol (OTLP) Specification. All you need is a basic understanding of developing applications in Ruby. New to OpenTelemetry? Read more about it.
These instructions will explain how to set up automatic and manual instrumentation for a Ruby service. In order to get started, all you will need:
Ruby installed (2.5+)
In this guide, we will auto-instrument a simple “Hello World” application using Sinatra, a Ruby Domain-specific language (DSL) for creating web apps with minimal effort. Follow along with an existing Ruby project of your own.
Initialize the New Project
mkdir sintara-hello-world
cd sintara-hello-world
vi Gemfile
GemFile
source "https://rubygems.org"
gem "sinatra"
hello.rb
require 'rubygems'
require 'bundle/setup'
    get '/frank-says' do
      'Put this in your pipe & smoke it!'
    end
    get '/hello' do
      'sintara says hello!'
    end
    get '/' do
      'exisitng paths: /hello, /frank-says, /logicmonitor!'
    end
    get '/logicmonitor' do
      'Hello from Logicmonitor!'
    end
Run the Sinatra Server
bundler install
ruby hello.rb
> == Sinatra (v2.1.0) has taken the stage on 4567 for development with backup from Thin
> 2021-11-16 11:44:02 +0530 Thin web server (v1.8.1 codename Infinite Smoothie)
> 2021-11-16 11:44:02 +0530 Maximum connections set to 1024
> 2021-11-16 11:44:02 +0530 Listening on localhost:4567, CTRL+C to stop
The Sinatra server should be up and running. Let’s instrument it to export traces to LogicMonitor’s APM portal.
Install the Open Telemetry Client Gems
The first step is to add the following gems to your Gemfile:
Including opentelemetry-instrumentation-all provides instrumentations for several frameworks such as Rails, Sinatra, and database drivers and HTTP libraries.
Initialization
It’s best to initialize OpenTelemetry as early as possible in your application lifecycle. We will add this in hello.rb
OpenTelemetry initialization:
hello.rb
require 'opentelemetry/sdk'
require 'opentelemetry/exporter/otlp'
require 'opentelemetry/instrumentation/all'

OpenTelemetry::SDK.configure do |c|
  c.service_name = 'sintara-hello-world'
  c.use_all() # enables all instrumentation!
end
Now that you have set up your application to perform tracing, we’ll need to configure the SDK to export the traces to the LogicMonitor APM portal. We use the OTLP exporter, which the SDK tries to use by default. Next, we’ll use LogicMonitor’s OpenTelemetry Collector to receive these traces and visualize them in the LM APM portal.
require 'rubygems'
require 'bundler/setup'
require 'opentelemetry/sdk'
require 'opentelemetry/exporter/otlp'
Bundler.require
OpenTelemetry::SDK.configure do |c|
    c.service_name = 'ruby-otlp'
    c.use_all
   end
get '/frank-says' do
      'Put this in your pipe & smoke it!'
    end
    get '/hello' do
      'sintara says hello!'
    end
    get '/' do
      'exisitng paths: /hello, /frank-says, /logicmonitor!'
    end
    get '/logicmonitor' do
      'Hello from Logicmonitor!'
    end
ruby hello.rb
[2021-11-16 16:11:32] INFO  WEBrick 1.6.0
[2021-11-16 16:11:32] INFO  ruby 2.7.1 (2020-03-31) [x86_64-darwin19]
== Sinatra (v2.1.0) has taken the stage on 4567 for development with backup from WEBrick
[2021-11-16 16:11:32] INFO  WEBrick::HTTPServer#start: pid=3794 port=4567
Exporting Traces
Note: These steps require having access to Logicmonitor’s APM license.
Install the LM Otel collector using docker.
docker run -d -e LOGICMONITOR_ACCOUNT=<account> -e LOGICMONITOR_BEARER_TOKEN= <bearer token> e LOGICMONITOR_OTEL_NAME="<collector name>" -p 4317:4317 -p 4318:4318 logicmonitor/lmotel:latest
Now, let’s test it out. Start your application and perform a few operations to generate tracing data, e.g. navigate your web app or kick off background tasks.
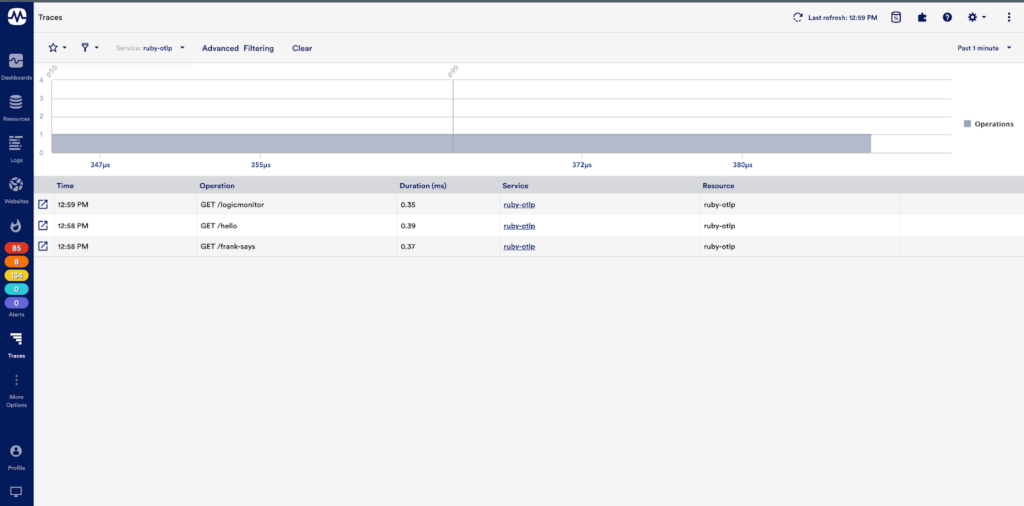
Navigate to Traces on the LogicMonitor portal and search for traces related to your service. These were generated via OpenTelemy auto-instrumentation!
Success! Viewing LogicMonitor Traces
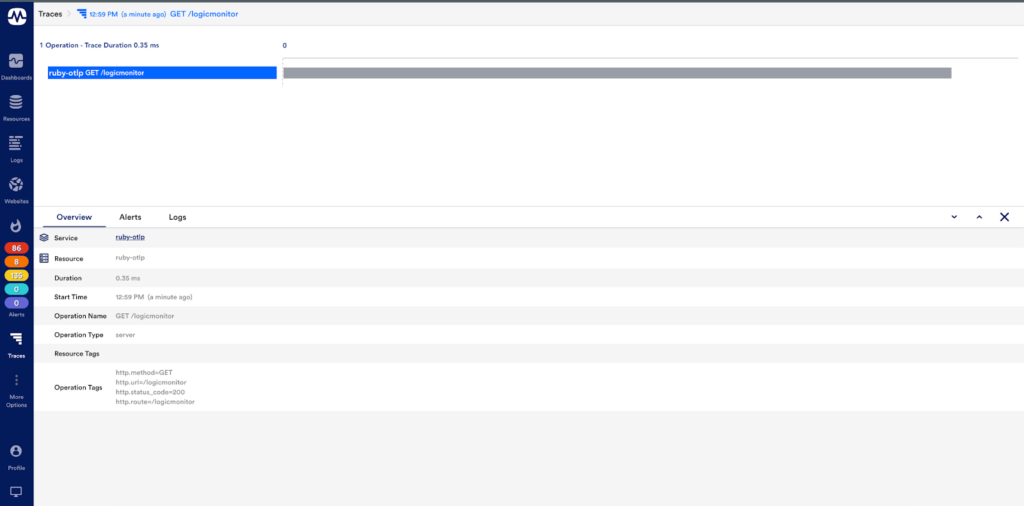
You can view additional information by clicking on a trace.
Here is what a Constructed Trace looks like:
Resource labels:
-> service.name: STRING(ruby-otlp)
-> process.pid: INT(7614)
-> process.command: STRING(helloworld.rb)
-> process.runtime.name: STRING(ruby)
-> process.runtime.version: STRING(2.7.1)
-> process.runtime.description: STRING(ruby 2.7.1p83 (2020-03-31 revision a0c7c23c9c) [x86_64-darwin19])
-> telemetry.sdk.name: STRING(opentelemetry)
-> telemetry.sdk.language: STRING(ruby)
-> telemetry.sdk.version: STRING(1.0.1)
InstrumentationLibrarySpans #0
InstrumentationLibrary OpenTelemetry::Instrumentation::Sinatra 0.19.2
Span #0
Trace ID : e4e6e6c683f2cbb8ab5404a6604b7c01
Parent ID :
ID : cadc573256df7294
Name : /frank-says
Kind : SPAN_KIND_SERVER
Start time : 2021-11-16 07:32:30.577101 +0000 UTC
End time : 2021-11-16 07:32:30.579635 +0000 UTC
Status code : STATUS_CODE_ERROR
Status message :
Attributes:
-> http.method: STRING(GET)
-> http.url: STRING(/frank-says)
-> http.status_code: INT(404)
Congratulations, you’ve just written a Ruby application emitting traces using the OpenTelemetry Protocol (OTLP) Specification. You can use this code as a reference when you start instrumenting your business application with OTLP specifications.
Now, you’ll have visibility into your application to address any potential bottlenecks present in your application code. If you’re already using LogicMonitor to monitor your infrastructure or collect logs, you’ll be able to associate these traces for faster troubleshooting.
Check back for more blogs setting up distributed tracing with OpenTelemetry standards across other application languages.
External Resources
We recommend the following resources to learn more about OpenTelemetry and CNCF: