
Christina Kosmowski, CEO of LogicMonitor, is here today to introduce the latest innovations for our quarterly Summer 2023 Launch, which is focused on extending visibility wherever your business demands through unified monitoring across your entire hybrid cloud ecosystem!
How is it already August? As I look back at the intensely busy spring and summer we had here at LogicMonitor, I can’t help but romanticize the idea of journeys and road trips. The feeling of sunshine coming through the front windscreen, the anticipation bubbling when you peep the next sight on your itinerary, the longing for an ice-cold popsicle at the next pit stop.
August also brings with it the excitement of unveiling our Summer Launch features: the capabilities we took care to improve upon – or build from scratch – based on the destinations our users told us they are trying to reach. You asked for easier access to metrics that matter, so we built intuitive out-of-the-box dashboards and workflows, offering simplicity without compromising on customization. You asked for more efficient ways to optimize resources from the start, so we automated more laborious processes. A hallmark of this launch is our customer-centric commitment to flexibility, ensuring that with LM in the passenger’s seat, the sun never sets on your business’ journey to modernization.
-Christina Kosmowski
CEO, LogicMonitor
Intelligence and Automation
LogicMonitor has always utilized intelligence and automation through agentless collectors to automatically discover new devices and configuration changes, prebuilt workflows, intelligent alerting with dynamic alert thresholds, and logs-based anomaly detection.
We are excited to announce several new features to drive our customers’ ability to surface key insights while reducing alert fatigue and cutting back on manual tasks. These include a controlled release of Edwin AI, Datapoint Analysis, Logs Query Tracking, a new Jira Service Management integration, and a beta release of Event-Driven Ansible.
Edwin AI
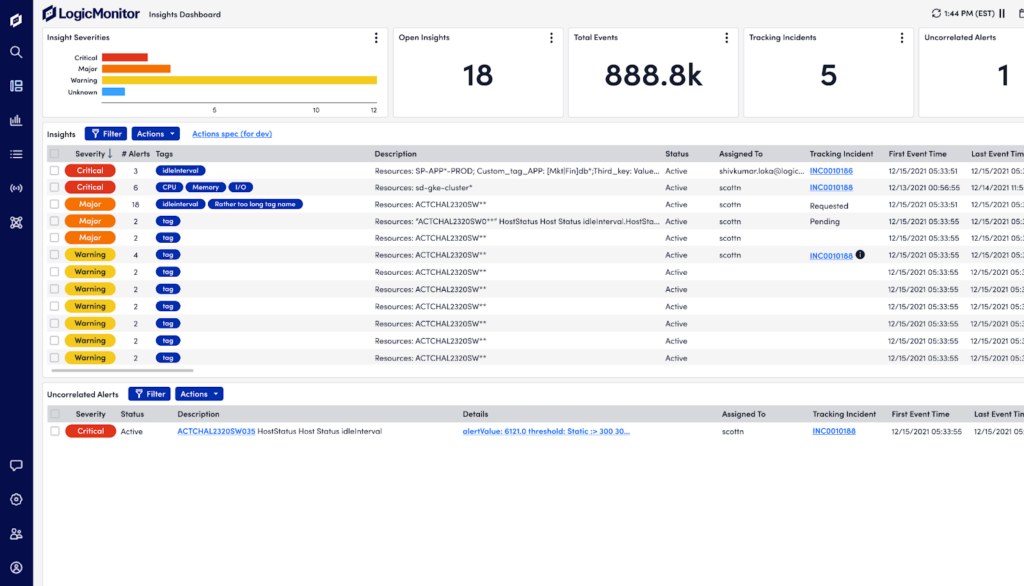
Edwin AI ingests events from LM Envision and seamlessly transforms them into episodes. Advanced machine learning techniques automatically identify features in the alert data to correlate the disparate alerts into connected insights based on time, resources involved, environment, and other significant features of the enriched alert data.
Furthermore, Edwin AI’s insights use advanced Natural Language Processing (NLP) to automatically summarize the alerts in a correlation into their most succinct form, vastly reducing the time it takes for support teams to reason about the mass of alerts and drive down MTTR.
The resulting streamlined list of specific actions gives ITOps, Engineers, DevOps, and MLOps teams the time, space, and data needed to prioritize resolving business-critical issues faster than their competitors.
Other capabilities include:
- Adaptive correlation – Edwin AI will automatically re-cluster alerts when it identifies a more optimal clustering option. This avoids any delay in escalating insights to ServiceNOW.
- Extensible correlation – Create user defined correlation models to target the alert and enriched CMDB data that makes sense for your business. You define how your correlations behave.
- ServiceNow Ready – Automatically enriches Edwin AI alerts with ServiceNOW CMDB data to drive additional context for ML correlations. Edwin AI includes a seamless bi-directional integration with ServiceNOW Incident module.
- MSP Ready – Edwin AI supports multi-tenancy with correlations scoped to each tenant.
Edwin AI represents our latest step in delivering AIOps to our customers – whether enterprise or MSPs! To learn how LogicMonitor leverages AIOps, visit https://logicmonitor.com/aiops
Datapoint Analysis
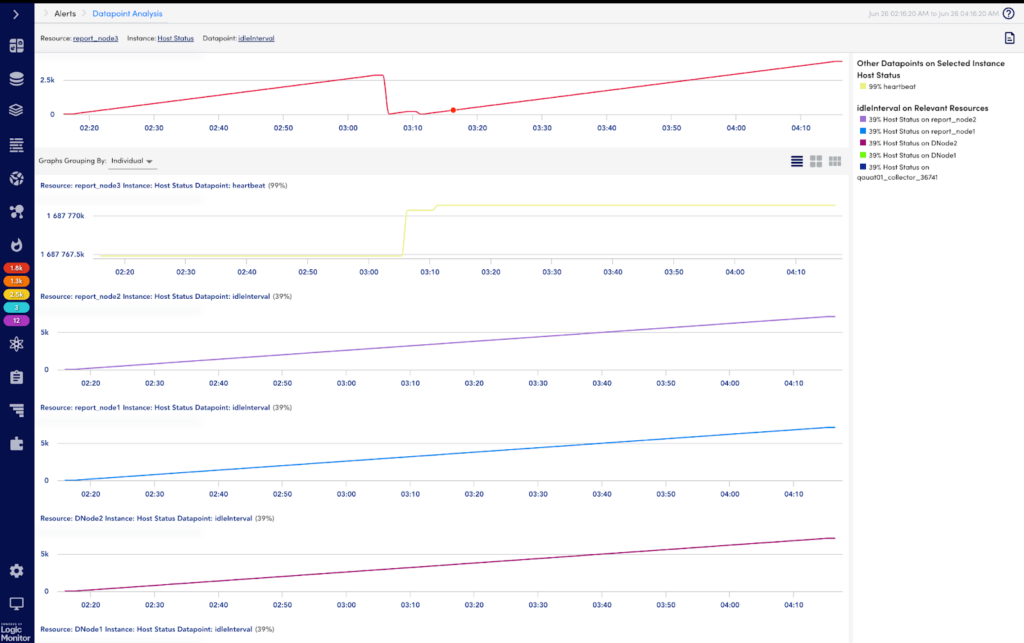
Datapoint Analysis uses advanced machine learning techniques to narrow down the list of metrics across different resources to surface a common pattern during a time of incident.
In the past, users had to search for additional, related metrics in order to diagnose an issue on the Resources page, which takes significant time and effort. This new feature, which is currently in Beta, provides relevant, correlated metrics to help practitioners reduce MTTR and increase productivity.
Logs Query Tracking
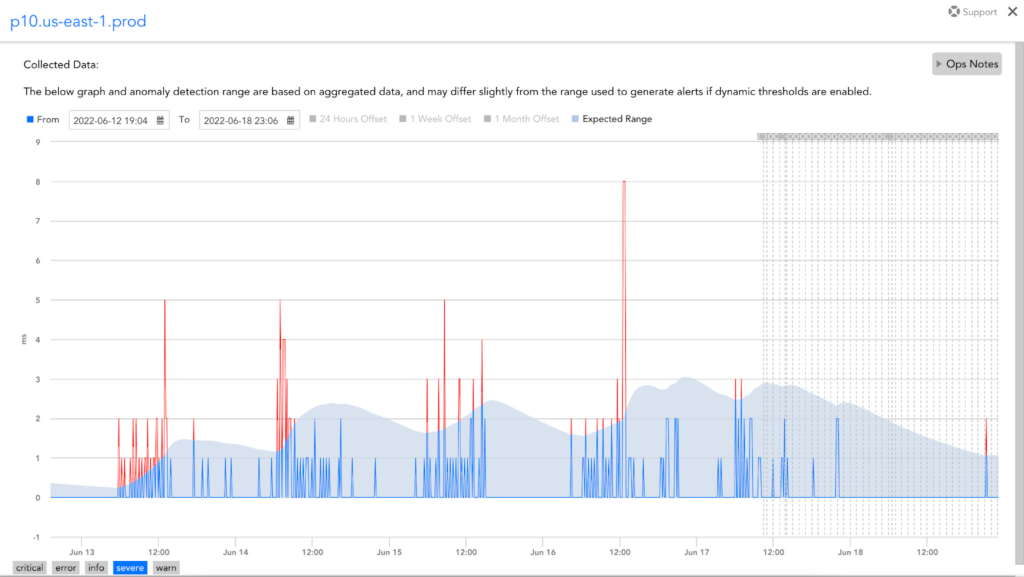
Logs Query Tracking creates LM datapoints from log data such as number of events and anomalies for KPI and trend analysis. In the past, it was difficult to provide business insights and track trends in log data. Now, when you mark a saved search for tracking, the query runs every 5 minutes and stores the number of logs and number of anomalies as instance data. Having this information as metrics helps customers view trends over time in LogicMonitor Dashboards and create alerts with static and dynamic thresholds when log counts fall outside an expected range. For more information about Logs Query Tracking, visit https://logicmonitor.com/support/logs-query-tracking. To learn about LM Logs, visit https://logicmonitor.com/logs.
Jira Service Management
LogicMonitor’s new fully released Jira Service Management integration is a bi-directional ticketing integration jointly developed with Atlassian to automate your incident management workflows in Jira based on LogicMonitor alerts. This integration enables LogicMonitor to create, update, and close Jira incidents based on LogicMonitor alerts. It also enables Jira to acknowledge alerts based on incident status.
Event-Driven Ansible
LogicMonitor has partnered with Red Hat to launch Event-Driven Ansible, a jointly developed solution to assist with auto-remediation and auto-troubleshooting. By integrating with the industry standard configuration management tool, we are allowing our customers to trigger remediation workflows on the basis of an alert, so when Event-Driven Ansible receives alerts from LogicMonitor, it can automatically determine the next steps and act in accordance with predefined rules.
When an event is triggered, Event-Driven Ansible will automatically execute the desired action via Ansible Playbooks or direct execution modules, with the ability to chain multiple events together into more complex automation actions. To learn more about our Ansible integration visit: https://logicmonitor.com/support/ansible-integration
If you are interested in signing up for a Closed Beta (available for LogicMonitor customers who have enabled UIv4), please contact your Customer Success Manager or Account Executive.
Unified Platform Experience
The LogicMonitor team has been hard at work creating new features that help customers easily access the metrics that matter and maximize productivity with a more cohesive and intuitive product experience. These features include a new UI, cloud updates, Log ingestion and Log alerts enhancements, and new capabilities in DEM (Digital Experience Monitoring) like Synthetic web checks.
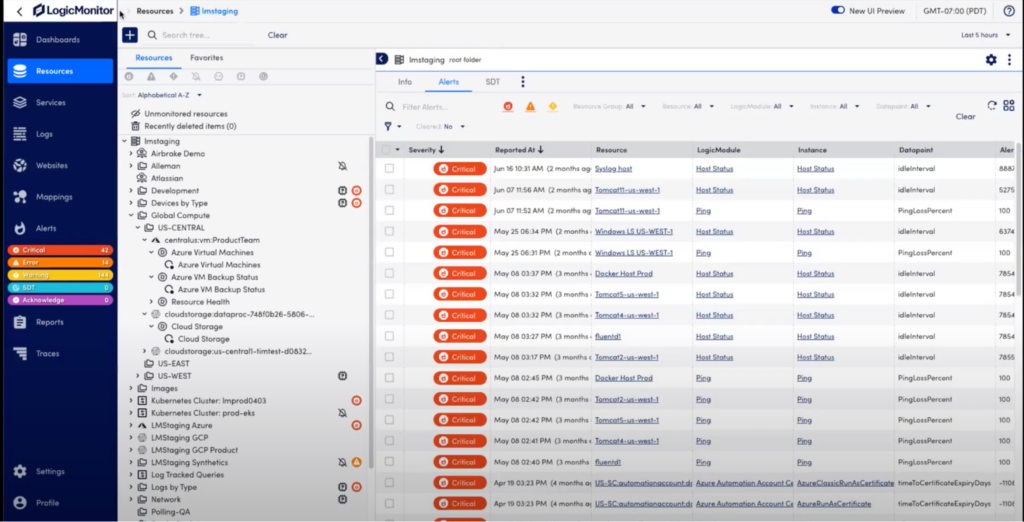
UIv4
LM Envision’s new UIv4 offers a modern and intelligent new platform design built to maximize user productivity, offer intuitive platform administration, and provide a smarter, cohesive, and accessible experience. With LM Envision’s new UI, LogicMonitor customers can focus on uptime and business-critical initiatives at speed and scale to propel their observability journey forward.
LM Envision’s New UI provides the fewest clicks to get users where they are trying to go, intuitive next steps, pre-set defaults, consistency of bulk actions, better search and filtering, all coupled together with modern react components that make for fast, reliable, consistent execution of common tasks. The new UI offers:
- Improved usability to optimize IT workflows, reducing the complexities enterprises commonly face across their hybrid and multi-cloud environments
- Increased productivity to perform actions faster and leverage tightly integrated automation capabilities to proactively resolve issues before they cause business disruptions
- Intuitive instrumentation to immediately access meaningful data when you need it with a modern look and feel so you can focus on business-critical initiatives
- Consistent platform-wide experience with tree navigation, search, filters, icon placement, and more for increased clarity and efficient access to key information
It’s easy to switch over to the new UI – simply click the toggle switch in the header! For more information, visit https://logicmonitor.com/support/resources-new-ui-overview.
Cloud
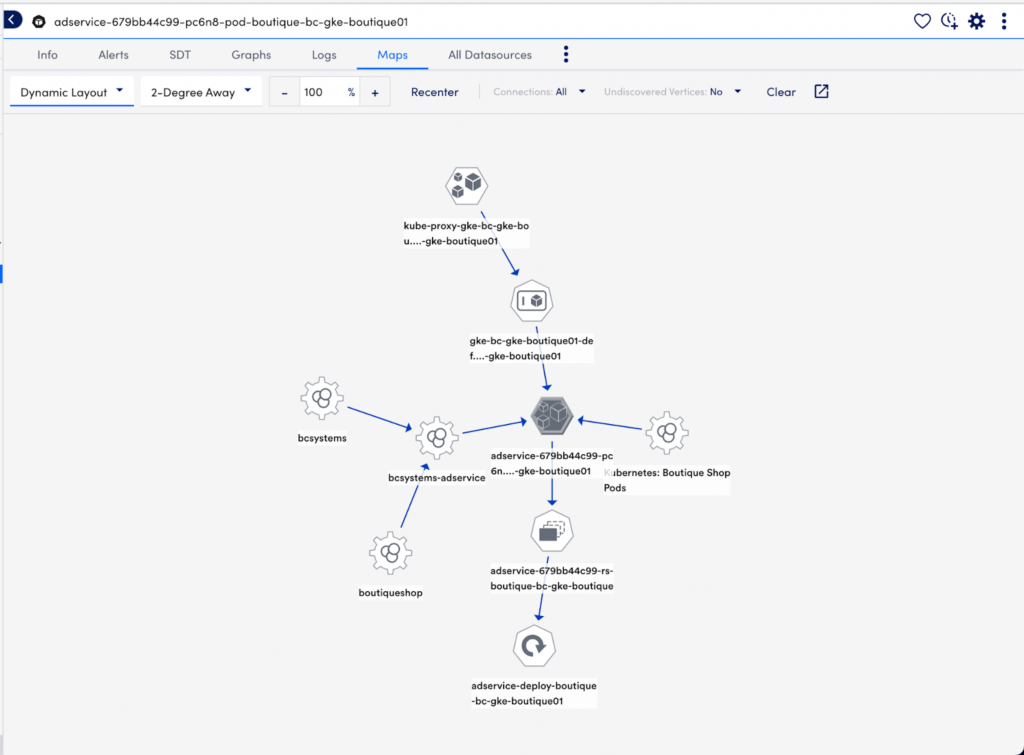
We recently added new support for AWS, Azure and Kubernetes in Topology Mapping, so customers can now visually see which resources are connected, and use this for troubleshooting.
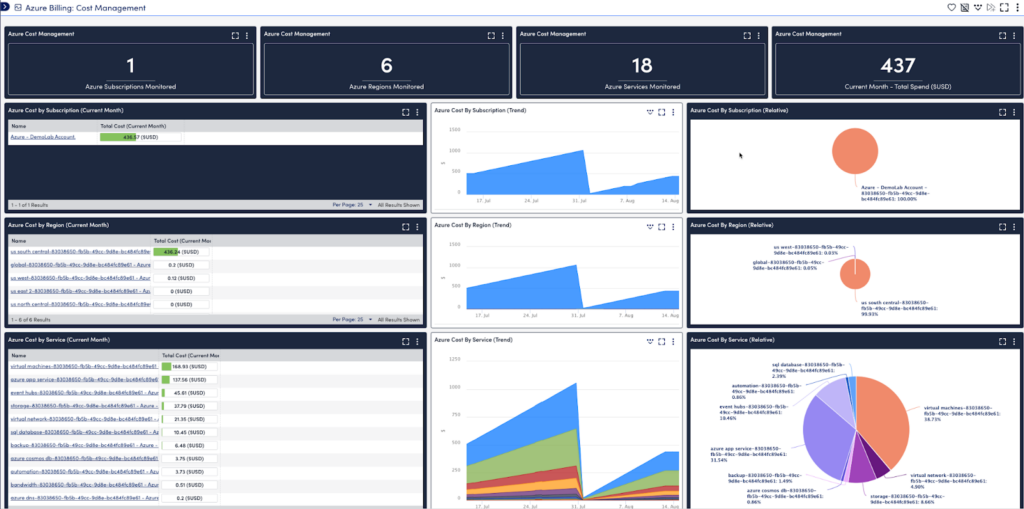
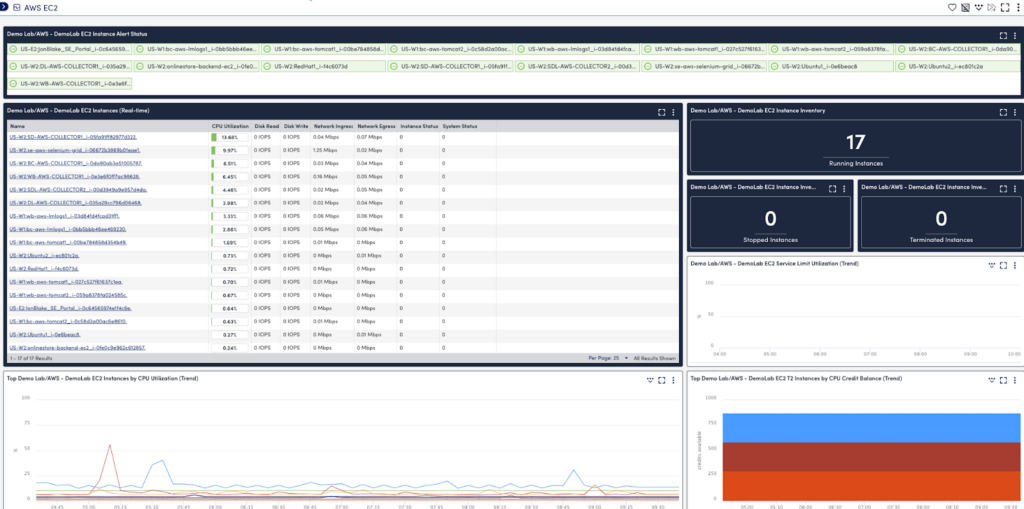
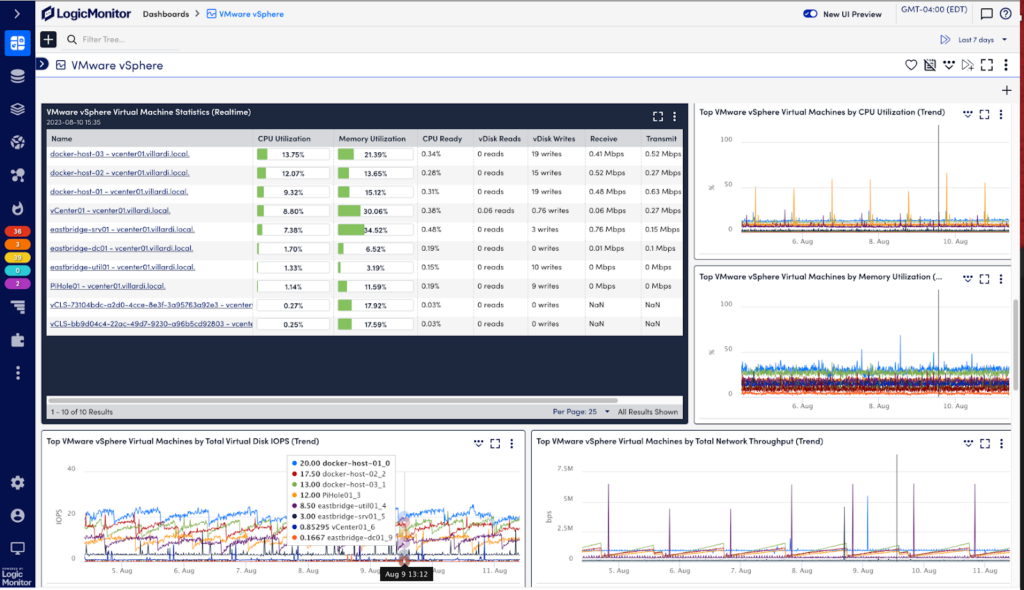
In addition, LogicMonitor now has 20 new Azure and AWS out-of-the-box dashboards which will help us deliver value to the customer and decrease time to value. These new dashboards will highlight key metrics and provide useful service-specific views for understanding service health, performance, and availability. In addition, the dashboards populate automatically for new cloud accounts added into LogicMonitor. For existing accounts, you can find the dashboard definitions in our AWS GitHub repository and Azure GitHub Repository and import the JSON file directly into your LogicMonitor account. For more information, see Importing Dashboards in the product documentation.
Logs
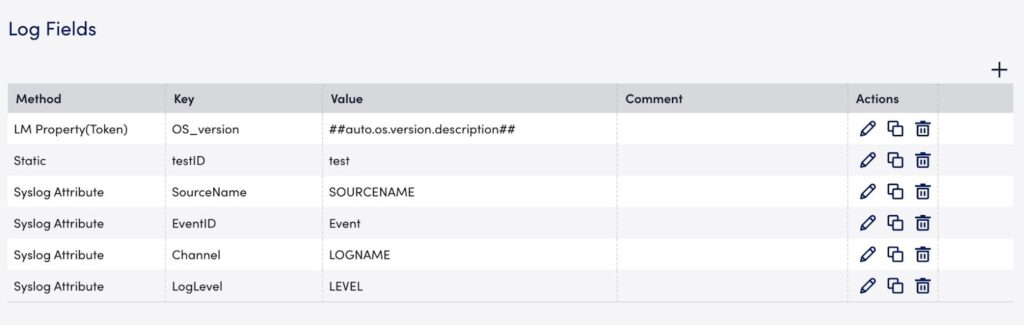
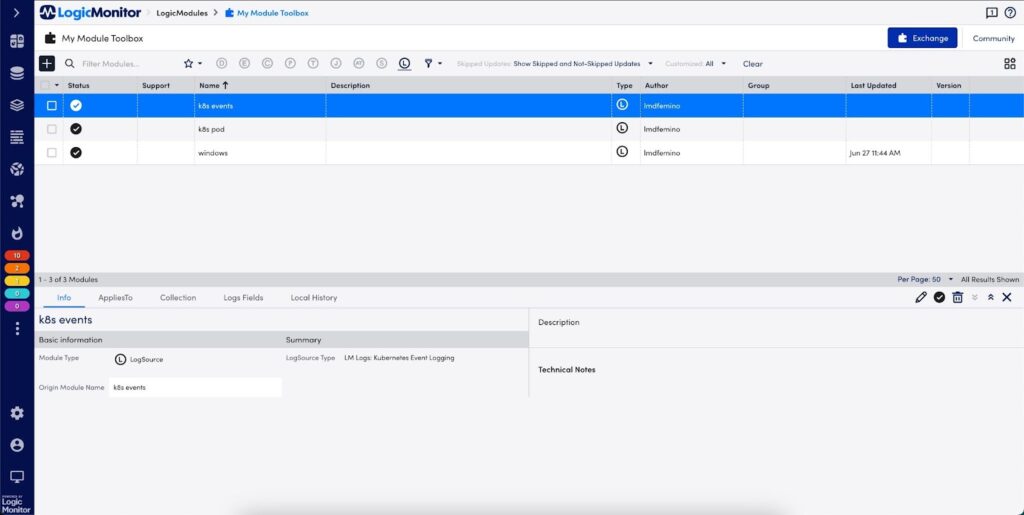
LogSource UI is a new graphical UI for simplifying log collection and configurations, that allows for log enrichment by adding metadata values. In the past, LM Logs Collection required configuration file edits which could be difficult and confusing for some users. LogSource UI simplifies the setup and configuration for log collection so it’s easier to bring log data into LM Log enrichment.
In addition, we have added advanced enrichment capabilities so users can add additional data to their logs for faster searching and filtering. For example, they could add LM Properties to the logs and search based on those values. For more information, visit https://logicmonitor.com/support/logsource-overview
Digital Experience Monitoring (DEM)
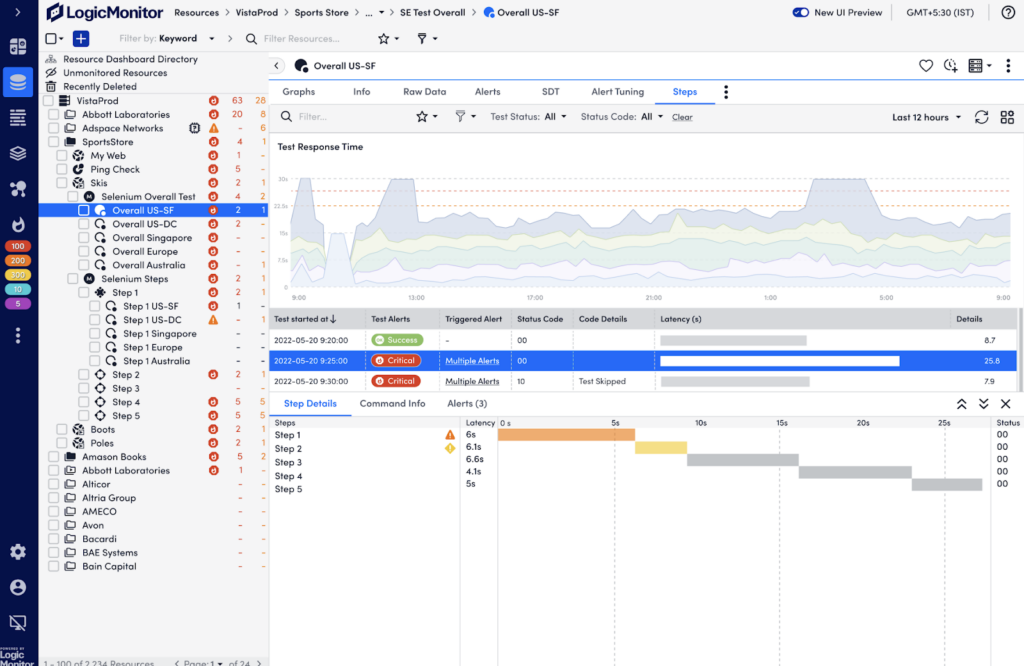
Synthetic Web Checks provides Selenium based recorded web checks with multiple steps and MFA support. In the past, customers could only see timing information for the entirety of the test. Now you can create a test with multiple steps to logically group all your website’s operations, where each step is treated as an individual device. This helps you navigate through all of your website’s operations, and provides granular slicing of the data to display information that is more relevant for alerting and troubleshooting.
SaaS Monitoring
In SaaS monitoring, we added support for M365 logs and Okta logs so users can clearly understand why problems happen, pinpoint the root cause of anomalies, and quickly troubleshoot with M365 logs (including Azure AD, Sharepoint, Exchange, General Audit, and DLP) and Okta logs alongside alerts.
In the past, customers had no easy way to get M365 logs or Okta logs into LogicMonitor. By combining metrics and logs, customers will have a better troubleshooting experience to help them further reduce MTTR. For more information about our SaaS monitoring solution, please visit https://logicmonitor.com/saas-monitoring
Extensibility
LogicMonitor gives customers the flexibility and control to monitor your entire IT environment, eliminate blind spots to prevent downtime, while propelling enterprise growth and transformation. To that end, we have expanded support across our entire portfolio including Platform, Cloud and Container Monitoring.
Platform
As part of our Cloud-managed networking offering, we recently added native integrations to simplify onboarding and streamline monitoring for Cisco Meraki, Cisco Catalyst SD-WAN, and Palo Alto Prisma SD-WAN, with HPE Aruba EdgeConnect SD-WAN coming soon.
LogicMonitor has also added a new Wireless Access Points SKU with support for Cisco Meraki and Juniper Mist. Monitoring wireless access points as discrete resources, rather than instances, makes it easier to count how many devices a customer has, while providing richer data, a better user experience, and access to more LM features. The Wireless Access Points SKU also provides an affordable price at less than one-fifth of the current Network Monitoring list price.
In addition, our customers can now experience next generation coverage monitoring for VMware vSphere, to provide faster discovery and onboarding of new ESXi Hosts and Virtual Machines, and rationalize data points to reduce redundant alerts.
Cloud
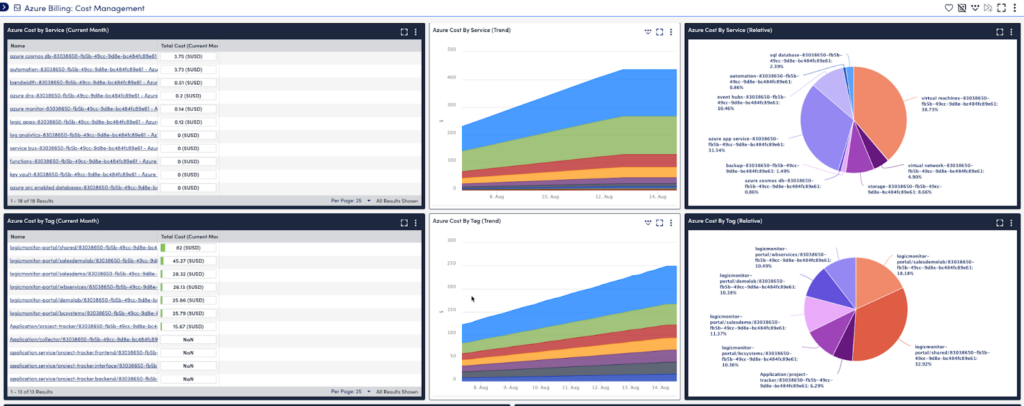
We know your cloud deployments span multiple cloud providers, which is why we’ve expanded our Azure offering to help you contain costs across your multi cloud estate and maximize your Azure investments. Azure cost management by tag will help you:
- Quickly adjust resources and accurately predict your Azure spend
- Define custom Azure tags (such as application, environment, createdBy) to analyze costs based on region, application, or custom groupings, and see where costs are allocated
- Clearly see over and underutilized resources to optimize workloads and eliminate unnecessary costs
To learn how to gain deeper insights from your Azure data alongside your on-premises estate, check out our webinar, “On-demand Going Beyond Azure Monitoring with LogicMonitor.”
Our new coverage of Azure Premium FrontDoor allows you to get visibility into FrontDoor performance data and metrics for better visibility into network health and user experience, alongside the rest of their hybrid environment. This will enable you to:
- Reliably reach your users, scale confidently, and reduce content delivery costs
- Gain visibility into user traffic patterns to predict demand changes, identify bottlenecks, and quickly make decisions to optimize application performance and customer experience
We’ve also added a MongoDB Atlas Integration to enable you to monitor Atlas managed databases with LogicMonitor’s cloud (API-based) integration. MongoDB Atlas database resources discovered are billed as cloud resources. With this integration, customers can:
- Gain real-time visibility and proactive anomaly detection across your MongoDB Atlas databases
- Monitor key metrics such as CPU and memory usage, throughput, and disk metrics to identify issues and quickly take action
- Proactively detect anomalies in your clusters to address performance issues and prevent unplanned downtime.
On July 26th, we also announced our expanded relationship with AWS, showcasing our hybrid multi cloud monitoring coverage, and describing the tremendous innovation we offer to help AWS customers accelerate their cloud migration, reduce risk, and visualize their hybrid estate. Learn more here: logicmonitor.com/blog/extend-visibility-wherever-your-business-demands
Container monitoring
As your deployments mature and your developers orchestrate multiple containerized applications, we added several new container monitoring features to make management and troubleshooting easier. These improvements include:
- Certified compatibility with support for Kubernetes 1.25 and 1.26
- LM Container charts, that help you get started quickly with consolidated helm charts, to easily manage complex deployments and ensure consistency across environments.
- Support for monitoring Kubernetes Helms Charts, which helps customers:
- Clearly see the health and performance of your Kubernetes applications
- Quickly respond when configured metrics exceed thresholds or deviate from patterns and take action on critical issues to detect issues or anomalies early on
- Support for monitoring Kubernetes API server and scheduler, so you can make real-time capacity planning decisions to adjust ephemeral resources according to demand changes.
More Information
Missed our Summer Launch webinar? Don’t worry, you can still catch all the details and demos! We hosted a webinar on August 22nd featuring LogicMonitor’s Chief Product Officer, Taggart Matthieson, and LogicMonitor’s Senior Director of Product Marketing, Bill Emmett. They discussed how our latest product innovations can help you unlock intelligence and extensibility in your hybrid IT environments. You can watch the recorded session here: LogicMonitor Webinar
Have questions or feedback about the new features discussed in the webinar and blog? We held an Ask Me Anything (AMA) event with our Product Managers on August 29th. You can read the recap or continue the conversation in our LM Community: Summer Launch AMA


