
Visualizing your cloud environment with auto dashboards and reports
Last updated on 14 February, 2022LogicMonitor automatically adds Dashboards and Reports when you add an AWS, Microsoft Azure, or GCP account into monitoring. This provides you with instant visibility into your cloud environments and includes both overview and service-specific views. These automatically generated Dashboards and Reports provide a starting point based on best practices, but you can customize them for your specific environment.
The information displayed in the Dashboards and Reports will depend on the services you select for monitoring. For example, If you have not provided S3 bucket information in which your billing data is stored, the Billing widgets will not be displayed on an AWS Overview dashboard.
Currently, auto-generated Dashboards and Reports are only added for new AWS, Microsoft Azure, and GCP accounts added into LogicMonitor.
A Dashboard group and a Report group are automatically generated and added for AWS, Microsoft Azure, or GCP accounts into LogicMonitor. Automatically generated Dashboards and Reports are placed in auto-generated Dashboard and Report groups, respectively. Dashboard and Report groups are named based on the name you assigned the AWS, Microsoft Azure, or GCP account in LogicMonitor.
For example, when you add a new AWS account named ‘Prod AWS’, a Dashboard group named ‘Prod AWS Dashboards’ and a Report group named ‘Prod AWS Reports’ is generated.
The following Dashboards and Reports are currently auto-generated for AWS, Microsoft Azure, and GCP accounts:
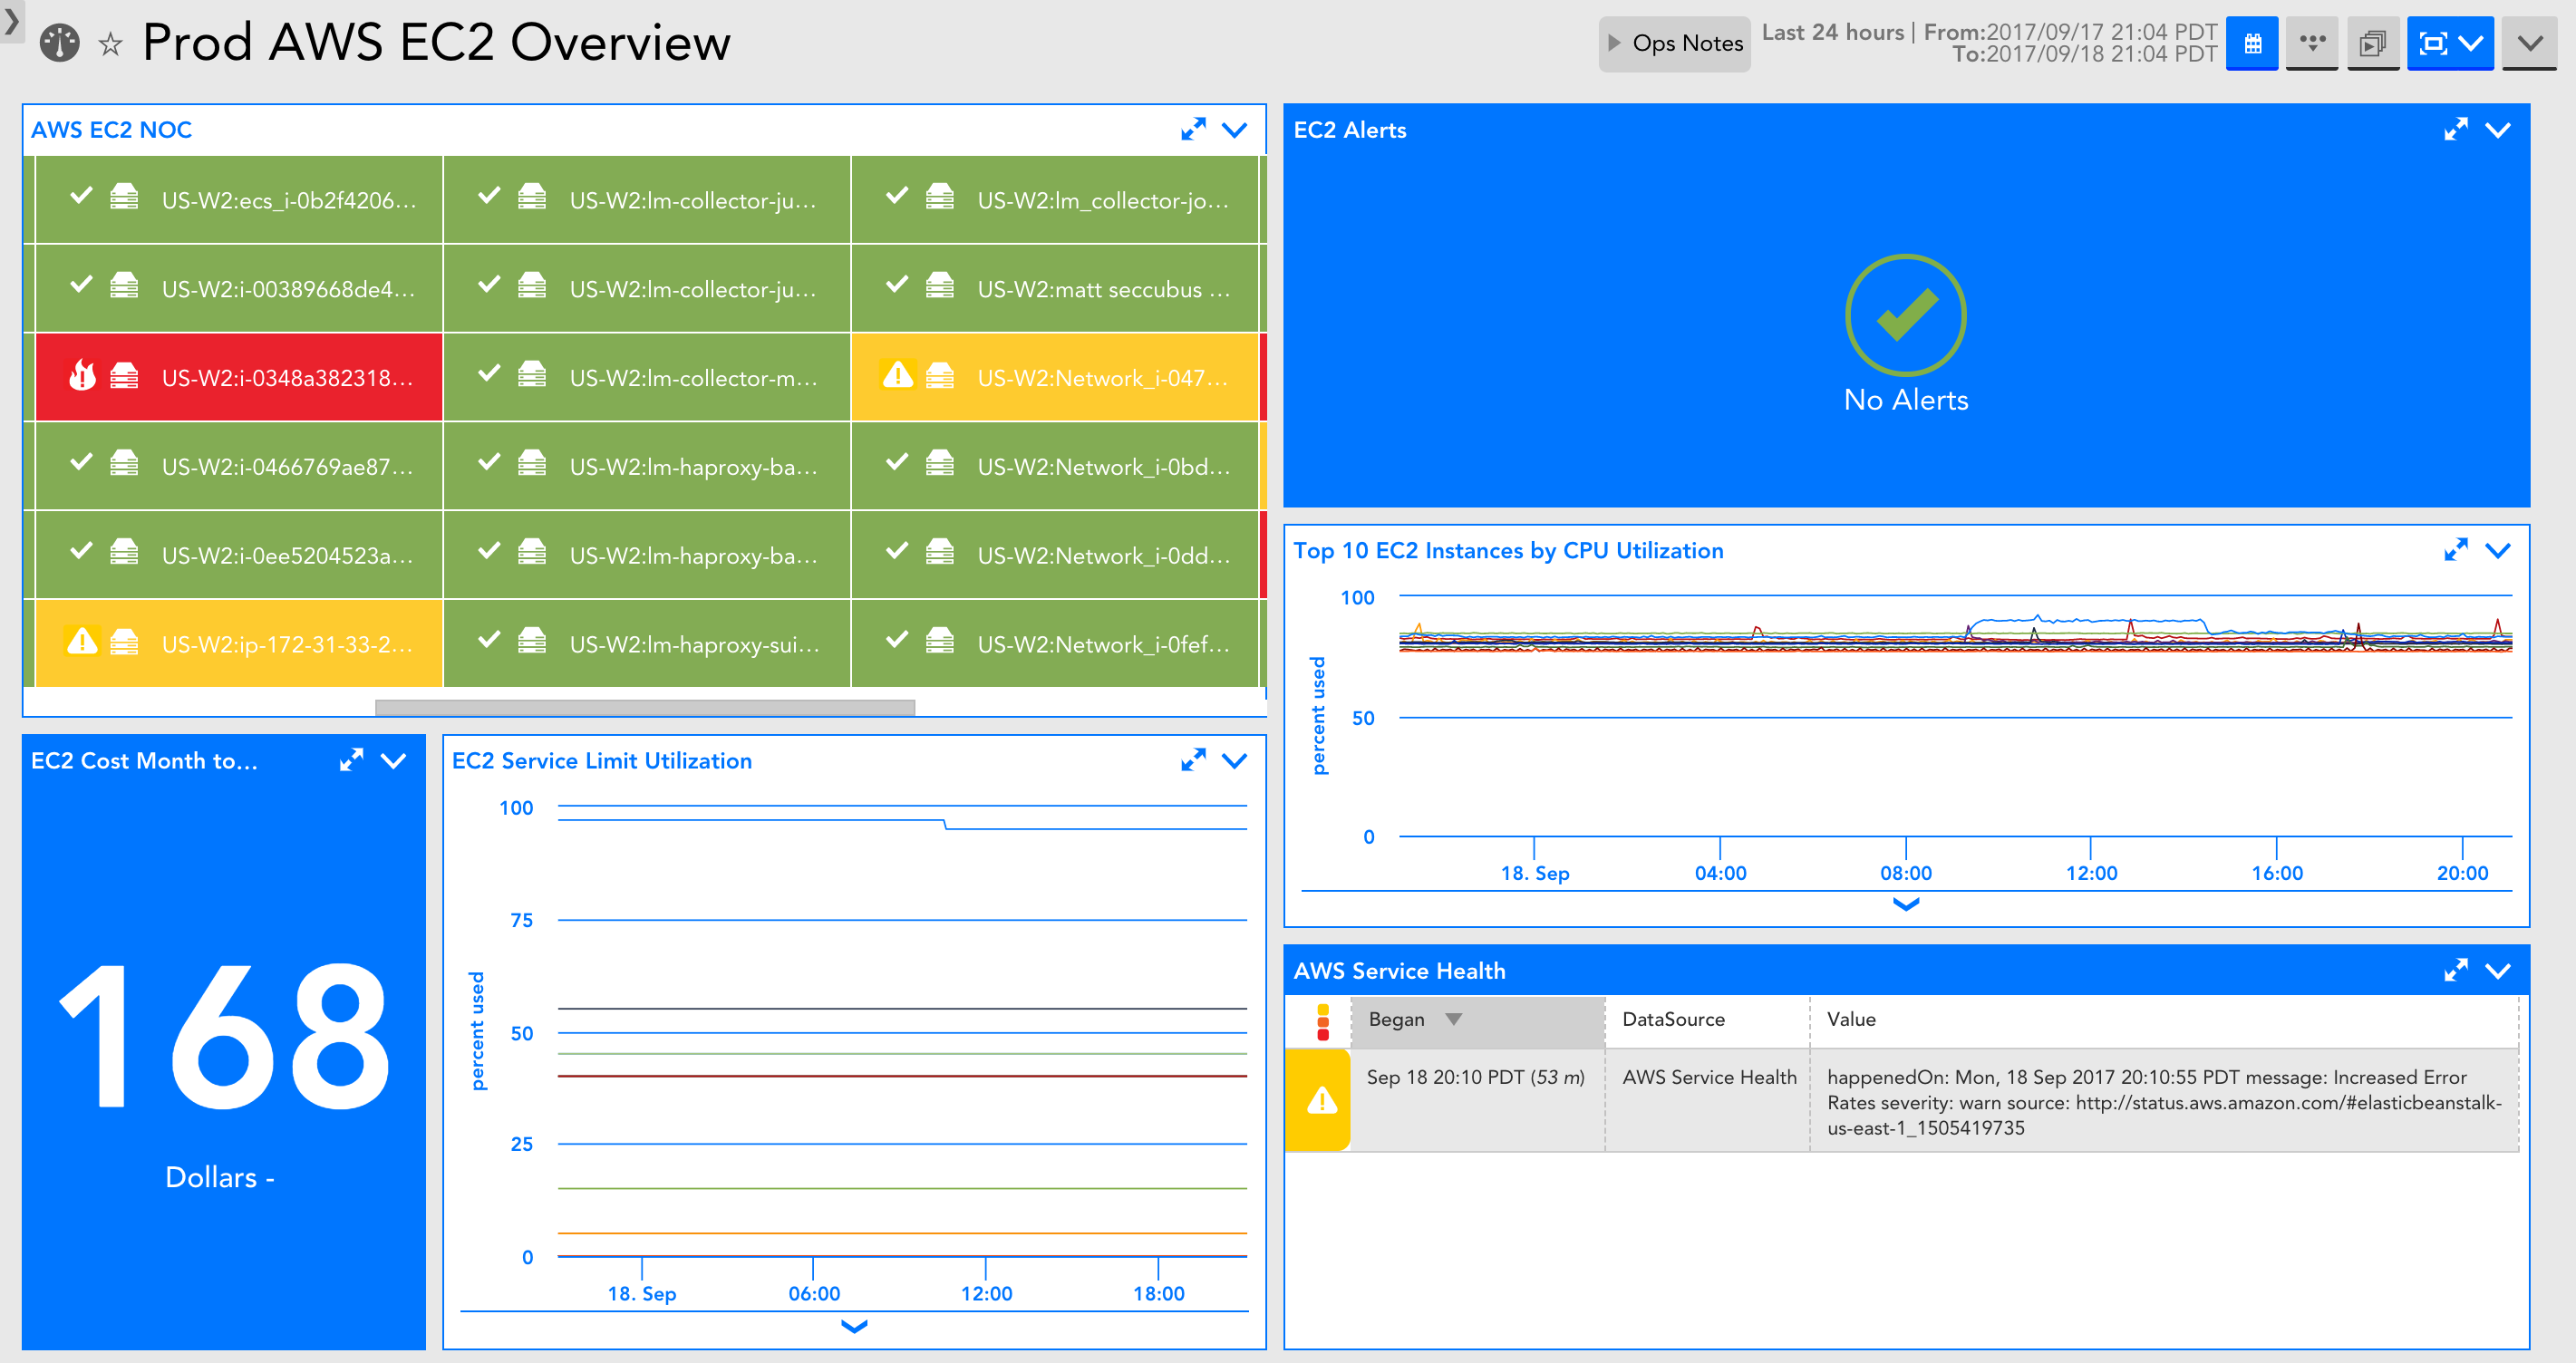
Cloud environment overview
An overview dashboard is added for all new cloud accounts. The dashboard includes an overview of your cloud environment. Also, the dashboard displays the service-specific NOC status, any alerts, any reported cloud availability disruptions, and billing data (if you have selected billing for monitoring). You can use this dashboard to share with execs or as a starting point to narrow down and localize where an issue is coming from during troubleshooting.
Service-specific dashboards for EC2 and EBS
Each service-specific dashboard includes a NOC of the resources, the cost related to the service, any service limit utilization that can be displayed, relevant service alerts, critical metrics for the service, and any issues with the cloud provider availability.
Service Utilization across services
Reports are auto-generated for new cloud accounts you add into LogicMonitor and can display information that is better suited to report format. The report format makes it easy to share information across teams, or you can review reports every week.