PostgreSQL Monitoring
Last updated on 25 November, 2020LogicMonitor will connect to your PostgreSQL database in order to accurately assess its performance, and pull statistical information.
LogicMonitor will initially assume that any device with a server on port 5432 is running PostgreSQL. Until you give LogicMonitor permission to connect to the databases it finds, it will raise a warning for that device.
Allowing Monitoring Over the Network
If your collector is not running on the PostgreSQL server, you need to ensure PostgreSQL is set to:
- accept network connections. By default PostgreSQL is set only to listen on “localhost”. Add a line in postgresql.conf:
- allow login connections using md5 authentication from the collector device. Add a line to the pg_hba.conf file such as this:
This would allow connections to all databases from the host 10.1.1.206, for user logicmonitor, if authenticated by an md5 encrypted password. Ensure to the put the IP address of your collector host in place of 10.1.1.206.
Creating a PostgreSQL Monitoring User
It is recommended that you create a specific user account for LogicMonitor to use to connect to the database.
Perform these operations as the super user on your PostgreSQL database:
This will be enough to enable most monitoring. However, there are two exceptions:
- if you modify the PostgreSQL Query execution time datasource to run a query that provides a representative time for your application, the user LogicMonitor connects as must be GRANTed rights to execute that query.
- in order to get accurate server busy stats and max query time, the LogicMonitor user needs to be a superuser:
Without the SuperUser privilege, all servers will appear busy, and maximum query time will always be 0. (Note: depending on the sensitivity of the data in the database, it may not be appropriate to grant superuser privilege to the logicmonitor user: for example, if the database contains personal health information.)
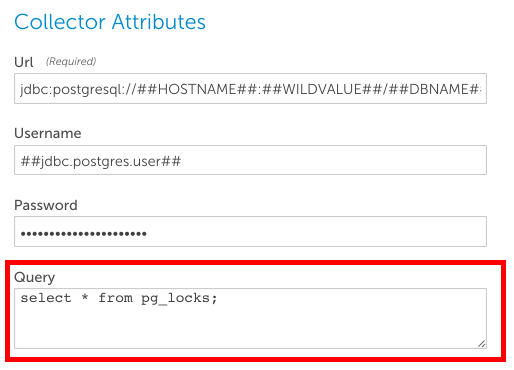
Provide Credentials for the LogicMonitor Collector to Access the Database
Define these properties so that they apply to the device within LogicMonitor:
Enabling Statistics Collection
By default, PostgreSQL reports very little statistical information. To fully realize the power of LogicMonitor PostgreSQL monitoring, you should enable statistics to be collected. (This does impose a small amount of overhead in the database.)
For PostgreSQL 8.2 and prior, ensure these settings are in postgresql.conf:
For PostgreSQL 8.3 and later, enable statistics collection by these settings in postgresql.conf:
Enable Replication Monitoring
If you have a Warm Standby server, you should set up replication monitoring. There are various kinds of HA for PostgreSQL – however, in this section it is assumed that PostgreSQL is set up for Warm Standby Using Point-In-Time Recovery (PITR), using pg_standby. LogicMonitor can monitor this form of database replication, but there are some complications:
- Given that the database is not fully “up”, but is instead always in archive log recovery mode, it is not possible to connect to it via SQL to monitor its status.
- The information that should be used to monitor the state of the replica cluster is reported by pg_controldata, but this must be run locally by the user that initiated the cluster (typically user postgres).
- We wish to report this information to the LogicMonitor collector. It is simplest to expose this data via snmp, but the snmp user does not have privileges to run pg_controldata.
- There is no way to tell that a system should be monitored for PostgreSQL replication, as there are no listening ports.
Given these constraints, the recommended setup for monitoring a Warm Standby Server is to perform these actions of the standby server:
- Periodically export the results of pg_controldata to a file readable by the SNMP daemon user. Add this line to the crontab of the postgres user’s crontab:
(Note that paths may need adjusting for the location of the pg_controldata binary, and the path to the data directory. Ensure that the output file is readable by the user of the snmpd daemon.)
- Add these two lines to the snmpd.conf file:
- This will add new SNMP objects that report the lag between real time and the last checkpoint; and also report the state of the cluster. Note that the -u option causes date and time calculations to be done in UTC. If your database uses another time zone to report its checkpoint times, then there will be a significant but consistent error. You must then restart the snmp daemon (typically by /etc/init.d/snmpd restart).
Finally, we must associate the PostgreSQL replication monitor in LogicMonitor with the relevant host(s). To do so, add the tag PostgresReplica to the System.categories property of the device.
Modifying the PostgreSQL Query Execution Time Datasource
It is recommended that you change the query that is timed in the PostgreSQL Query execution time datasource to one that is representative of your application’s performance. To do so, locate the ‘Postgres Query execution time’ datasource from Settings | LogicModules | Datasources OR select edit global definition from the datasource on the Devices page
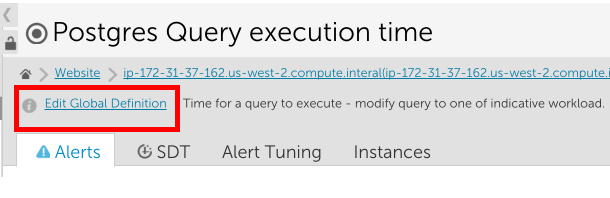
Change the Query field on the form that is displayed to a query that will represent your application performance, and click submit.