
Disclaimer: This content applies to the legacy UI and is no longer maintained. It will be removed at a future time. For up-to-date content, see Dashboard Report. At the time of removal, you will automatically be redirected to the up-to-date content.
Dashboard Report
Last updated - 04 September, 2025
Overview
The Dashboard report allows you to send a dashboard snapshot (either on a one-time basis or on a recurring basis using a schedule of your choosing) to stakeholders. This is particularly useful for distributing moment-in-time metrics of an environment’s health to those who don’t have access to the dashboard within the LogicMonitor platform.
Dashboard reports are distributed as web page URLs. You can enable the Allow Shared Reports access for sharing public and private URLs for generated reports. The generated report URL links are valid for 12 hours. For more information, see Accessing and Sharing Generated Reports.
Note: You can also configure dashboard snapshot sharing directly from an open dashboard, as discussed in Sharing and Exporting/Importing Dashboards.
Creating a Dashboard Report
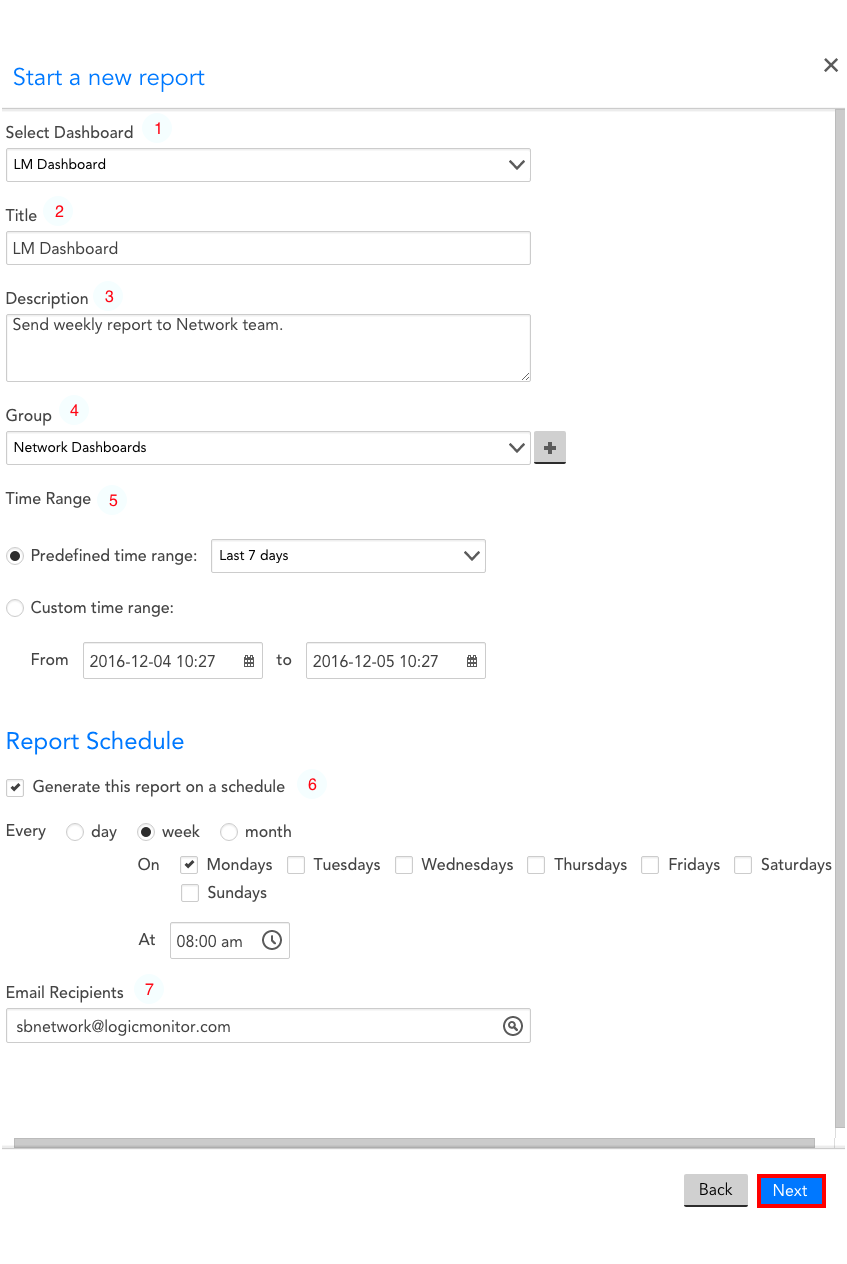
To create a new Dashboard report, navigate to Reports | Add | Report | Dashboard Report. From the Start a new report dialog, configure the following settings:
- Select Dashboard: from a dropdown menu, choose the Dashboard you would like to share as a report.
- Title: the title of the report as it will appear to recipients. This field will default to the name of the Dashboard you have selected. You may change the title, if necessary.
- Description: a brief description of your Dashboard Report. As a best practice, the description should include an overview of the report’s scope, contents, and schedule.
- Group: Select the report group to which the Dashboard Report will be assigned. It is helpful to organize reports based on related environment (ie. a particular office/datacenter location, related recipients, etc.). If you would like to create a new Report Group, select the “add” icon to the right of the “Group” field.
- Time Range: the time range from which this report will pull data from your Dashboard. Each widget in the Dashboard will be configured to reflect the time-range designated in this field.
- Report Schedule: If you select the “Generate this report on a schedule” checkbox, you will be asked to designate the recurring time/date on which this report will be generated and sent to recipients. If you would like to manually generate this report, leave this box unchecked.
- Email Recipients: This field will only appear if you have selected the “Generate this report on a schedule” checkbox. All emails associated with users in the LM account will appear as auto-suggestions. You can also add external emails manually. Note that if you are not generating this report on a recurring schedule, you will simply have to run the report and send it to users via the report’s URL.
Once you have configured each of these fields, click Next. You will be asked to run the report; after doing so, it will be auto-saved.
Receiving a Dashboard Report
Once generated, any designated recipients will receive an email resembling the one in the following graphic.
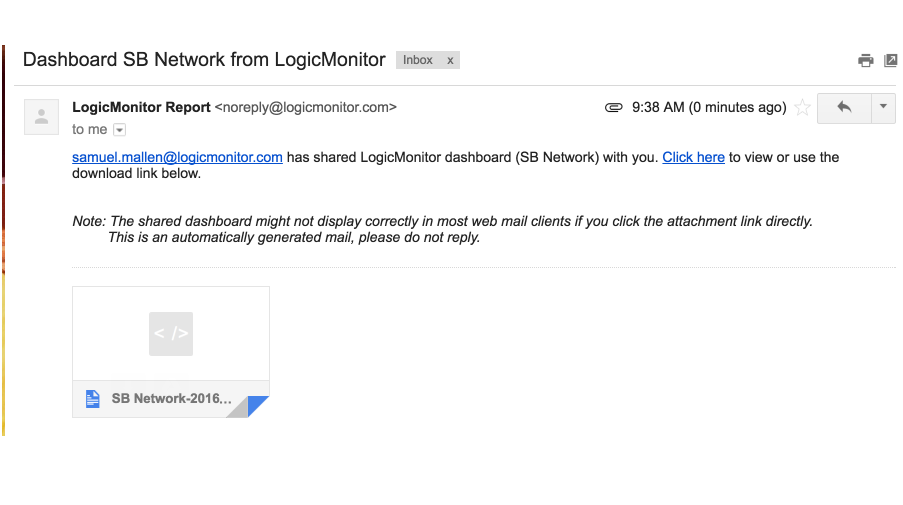
Note: Clicking the attachment directly will result in a distorted view in most web mail clients. For an accurate view, be sure to click the “Click here” embedded link or download the attachment.
Note: Dashboard report URLs expire after seven days. This is a limitation of the AWS authentication technology that LogicMonitor uses to generate these URLs.
