
ElastiCache
Last updated on 27 March, 2023LogicMonitor currently has the following datasources for monitoring ElastiCache performance metrics:
- AWS_ElastiCache_Redis – redis node performance data
- AWS_ElastiCache_Memcached – memcached node performance data
Note there is additional configuration required for LogicMonitor to collect data for your ElastiCache instances.
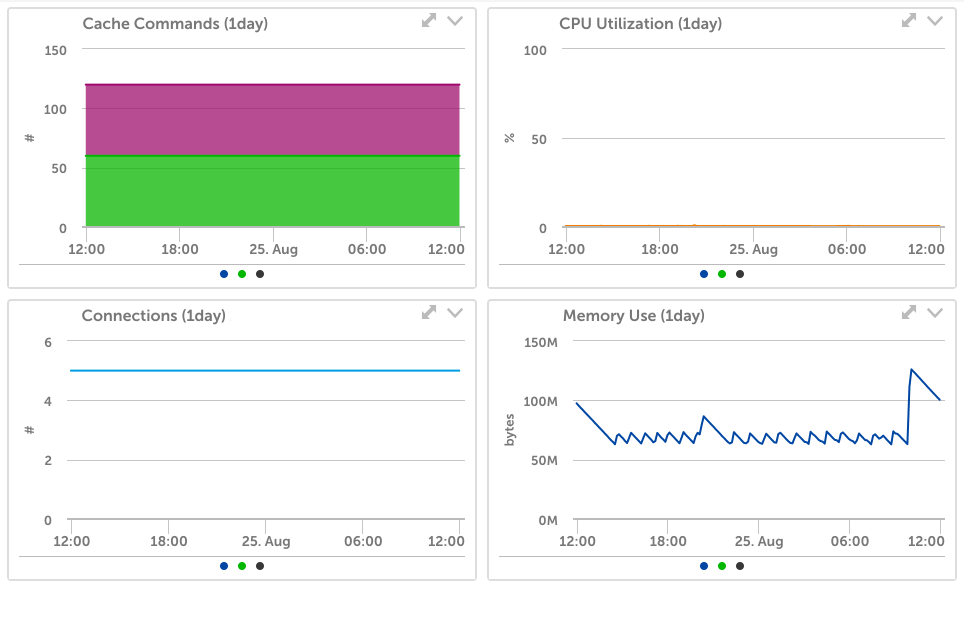
AWS_ElastiCache_Redis
Source: CloudWatch
Datapoints:
- Bytes Used
- Cache Efficiency, Hits & Misses
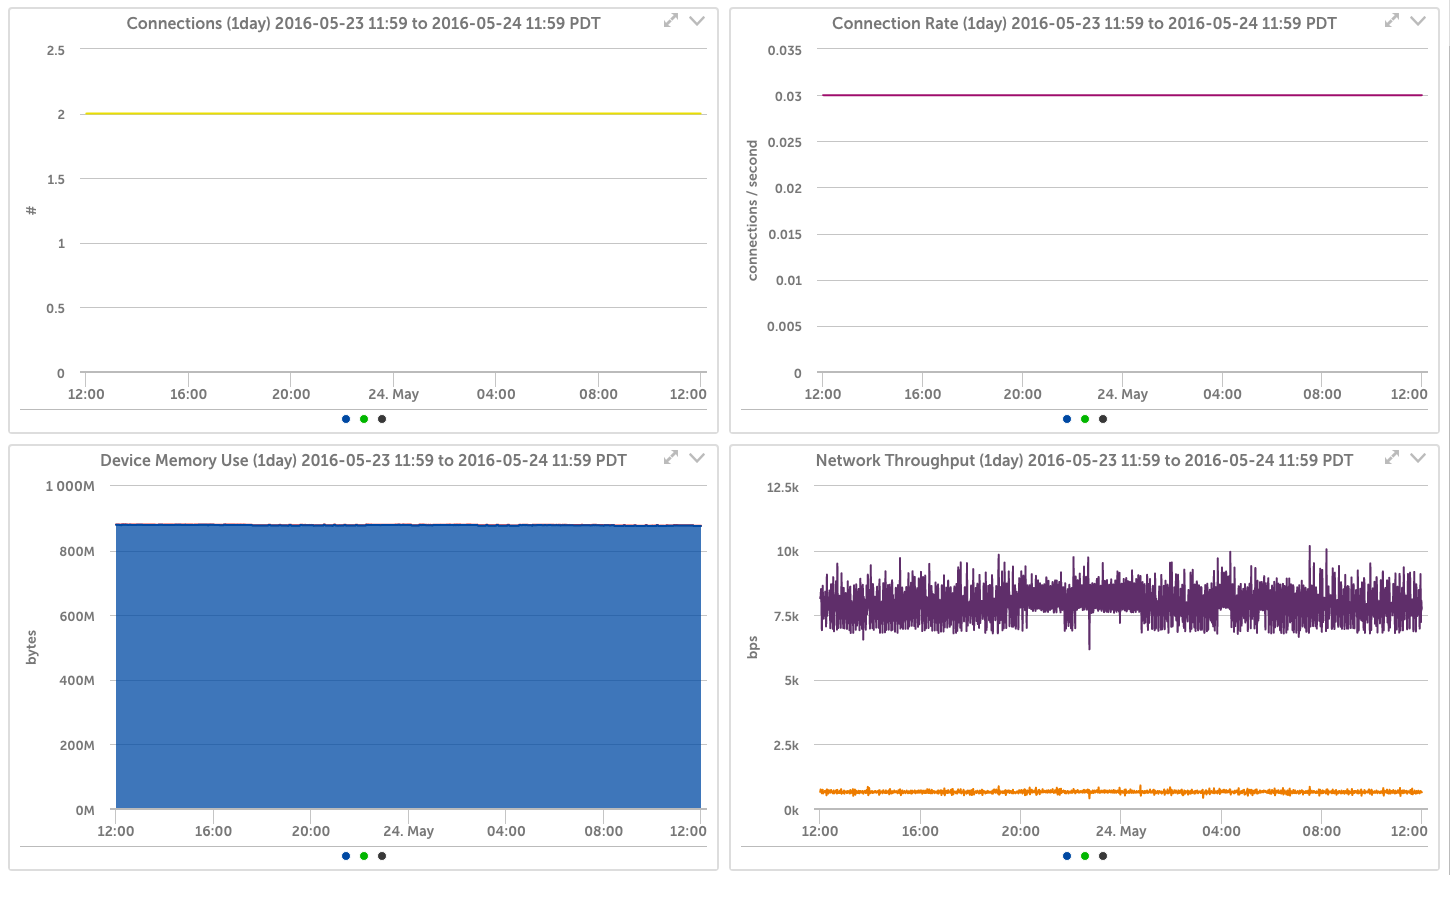
- Connection Rate
- Current Connections
- Current Items
- Network Bytes In, Bytes Out, In bps, Out bps
- Swap Usage
- Evictions
- Get Type Commands
- Hash Based Commands
- Freeable Memory
- CPU Utilization
- Key Based Commands
- List Based Commands
- More…
Default Polling Interval: 1 minute
Additional Configuration Required?: Yes. See the Additional Configuration section below.
AWS_ElastiCache_Memcached
Source: CloudWatch
Datapoints:
- Bytes Used
- Cache Efficiency, Hits & Misses
- Connection Rate
- Current Connections
- Current Items
- Network Bytes In, Bytes Out, In bps, Out bps
- Swap Usage
- Evictions
- Get Type Commands
- Hash Based Commands
- Freeable Memory
- CPU Utilization
- Key Based Commands
- List Based Commands
- More…
Default Polling Interval: 1 minute
Additional Configuration Necessary?: Yes. See the Additional Configuration section below.
Additional Configuration
If you’d like LogicMonitor to monitor your AWS ElastiCache instances, you need to add the following policy to your LogicMonitor AWS user: