
ELB
Last updated on 27 March, 2023LogicMonitor currently has two datasources for monitoring ELB performance metrics:
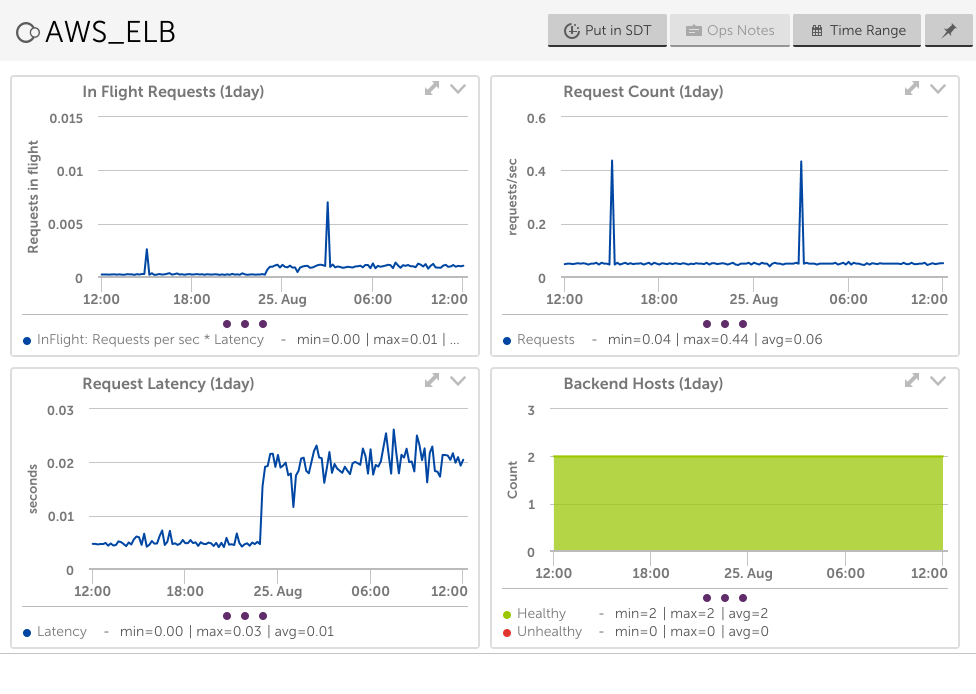
- AWS_ELB – collects performance data for Classic ELB instances
- AWS_ApplicationELB – collects performance data for Application ELB instances
- AWS_NetworkELB – collects performance data for Network ELB instances
AWS_ELB
Source: CloudWatch
Datapoints:
- Backend 2XX, 3XX, 4XX and 5XX responses per second
- HTTP 2XX, 3XX, 4XX and 5XX responses per second
- ELB 4XX client errors
- ELB 5XX server errors
- Latency
- Max Queue Length
- Request Count (raw and per second)
- Spillover Count & Rate
- UnHealthy Host Count
Default Polling Interval: 2 minute. Per Amazon, metrics are reported in 1 minute intervals.
Additional Configuration Necessary?: No. This datasource will automatically apply to the Classic ELBs discovered for your AWS account and start collecting data.
AWS_ApplicationELB
Source: CloudWatch
Datapoints:
- HTTP 2XX, 3XX, 4XX and 5XX responses
- ELB 4XX client errors
- ELB 5XX server errors
- ActiveConnectionCount
- ClientTLSNegotiationErrorCount
- HealthyHostCount
- NewConnectionCount
- ProcessedBytes
- RejectedConnectionCount
- RequestCount
- TargetConnectionErrorCount
- TargetResponseTime
- TargetTLSNegotiationErrorCount
- UnHealthy Host Count
Default Polling Interval: 1 minute
Additional Configuration Necessary?: No. This datasource will automatically apply to the Application ELBs discovered for your AWS account and start collecting data.
AWS_Network_ELB
Source: CloudWatch
Datapoints:
- ActiveFlowCount
- ConsumedLCUs
- Healthy Host Count
- NewFlowCount
- ProcessedBytes
- TCP Client, ELB and Target Reset Counts
- UnHealthy Host Count
Default Polling Interval: 2 minute. Per Amazon, metrics are reported in 1 minute intervals.
Additional Configuration Necessary?: No. This datasource will automatically apply to the Network ELBs discovered for your AWS account and start collecting data.