Optimizing your Cloud Spend
Last updated on 06 December, 2022With LogicMonitor, you can monitor your AWS or Azure spend and identify ways to optimize your monthly bill. First, make sure you have enabled billing monitoring for your AWS or Azure account and imported the billing DataSources into your account. As a part of this, we highly recommend that you set up the AWS and Azure Cost By Tag DataSources with Active Discovery, such that tag values are auto-discovered and spend is tracked for each (instructions on linked pages above). Once you’ve done this, we recommend the following:
1. Set thresholds
By default, LogicMonitor’s AWS and Azure Billing datasources don’t have any alert thresholds set because costs vary so much from case to case. You can set thresholds for services and regions that enable you to identify when you’re close to exceeding your budget or your average monthly cost. This will result in alerts that can be sent in a daily report or individually to your finance team, or even to the engineers that are provisioning and running services in the cloud.
2. Set up a dashboard to keep an eye on spend
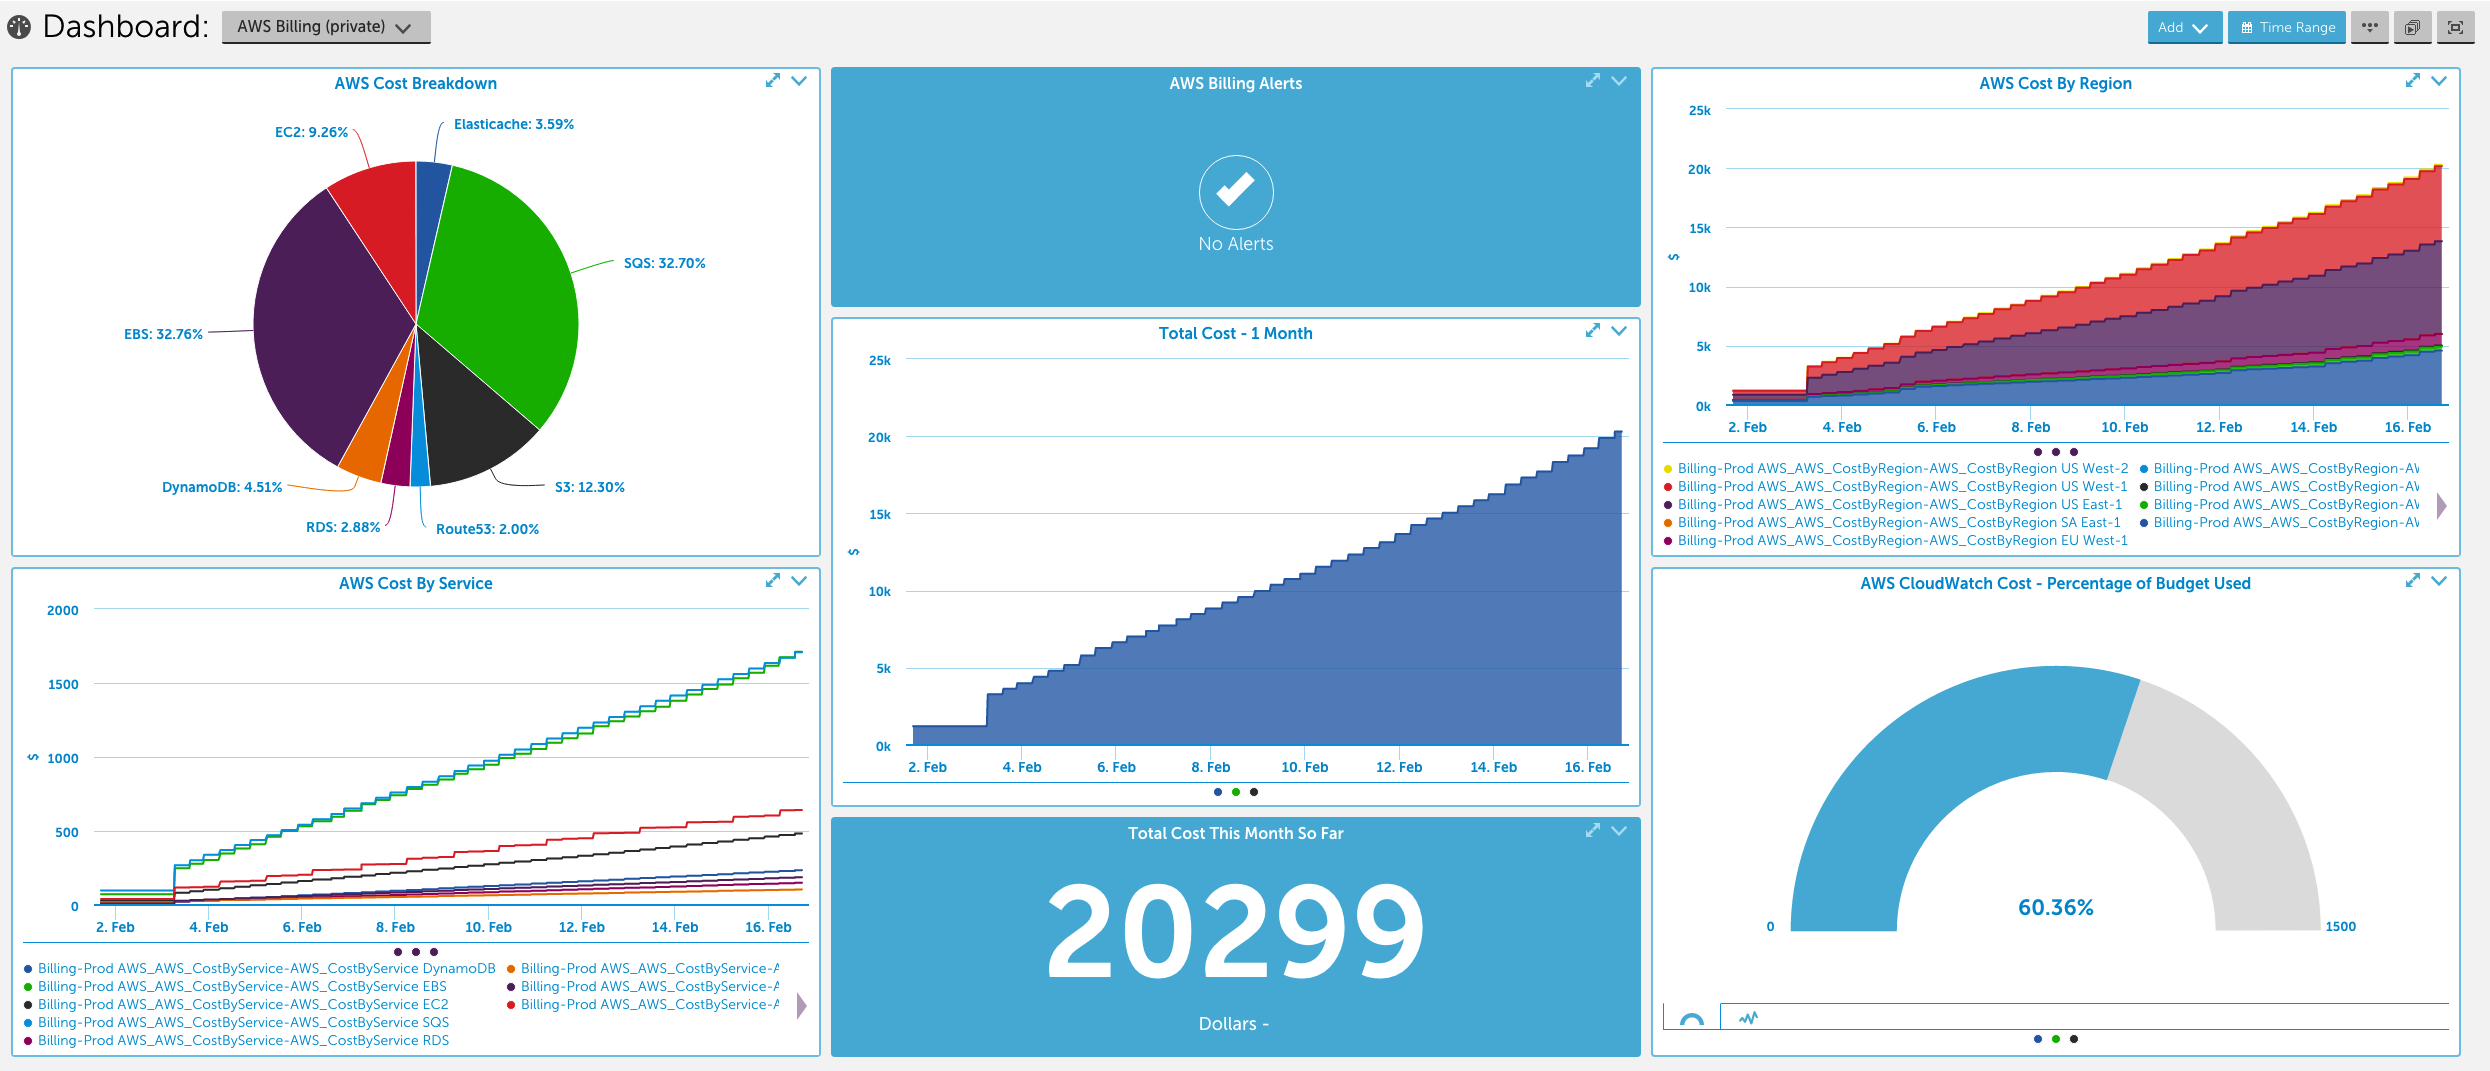
Setting thresholds for your spend data can provide value for managing your monthly bill, but it can be equally as valuable to set up dashboards that paint a picture of how your costs are trending. You can add widgets to show:
- which services are costing you the most – consider using a pie chart widget or an advanced custom graph widget to compare how much you’re spending on each AWS / Azure service
- which regions are costing you the most – consider using a pie chart widget or an advanced custom graph widget to compare how much you’re spending on services in each AWS / Azure region
- how this month’s cost compares with last month’s cost – consider using an advanced custom graph widget that spans the past couple of months to compare how your monthly bills compare to one another
- how close your costs are to any thresholds you’ve set – consider using a gauge widget to display the current cost of an individual service or region, or of all services or regions, and setting the gauge maximum value to the threshold for that cost metric
- any billing alerts that have been triggered – consider using an alert widget and filtering such that only alerts triggered for billing are displayed
- total AWS costs incurred so far this month – consider using a big number widget to keep a close eye on your current total costs for the month
- AWS CloudWatch costs incurred so far this month – consider using a big number widget to display the costs associated with CloudWatch API calls made to your AWS account. Note that you can reduce the number of CloudWatch API calls made to your AWS account by increasing the polling interval for your AWS datasources
3. Identify over-provisioned resources
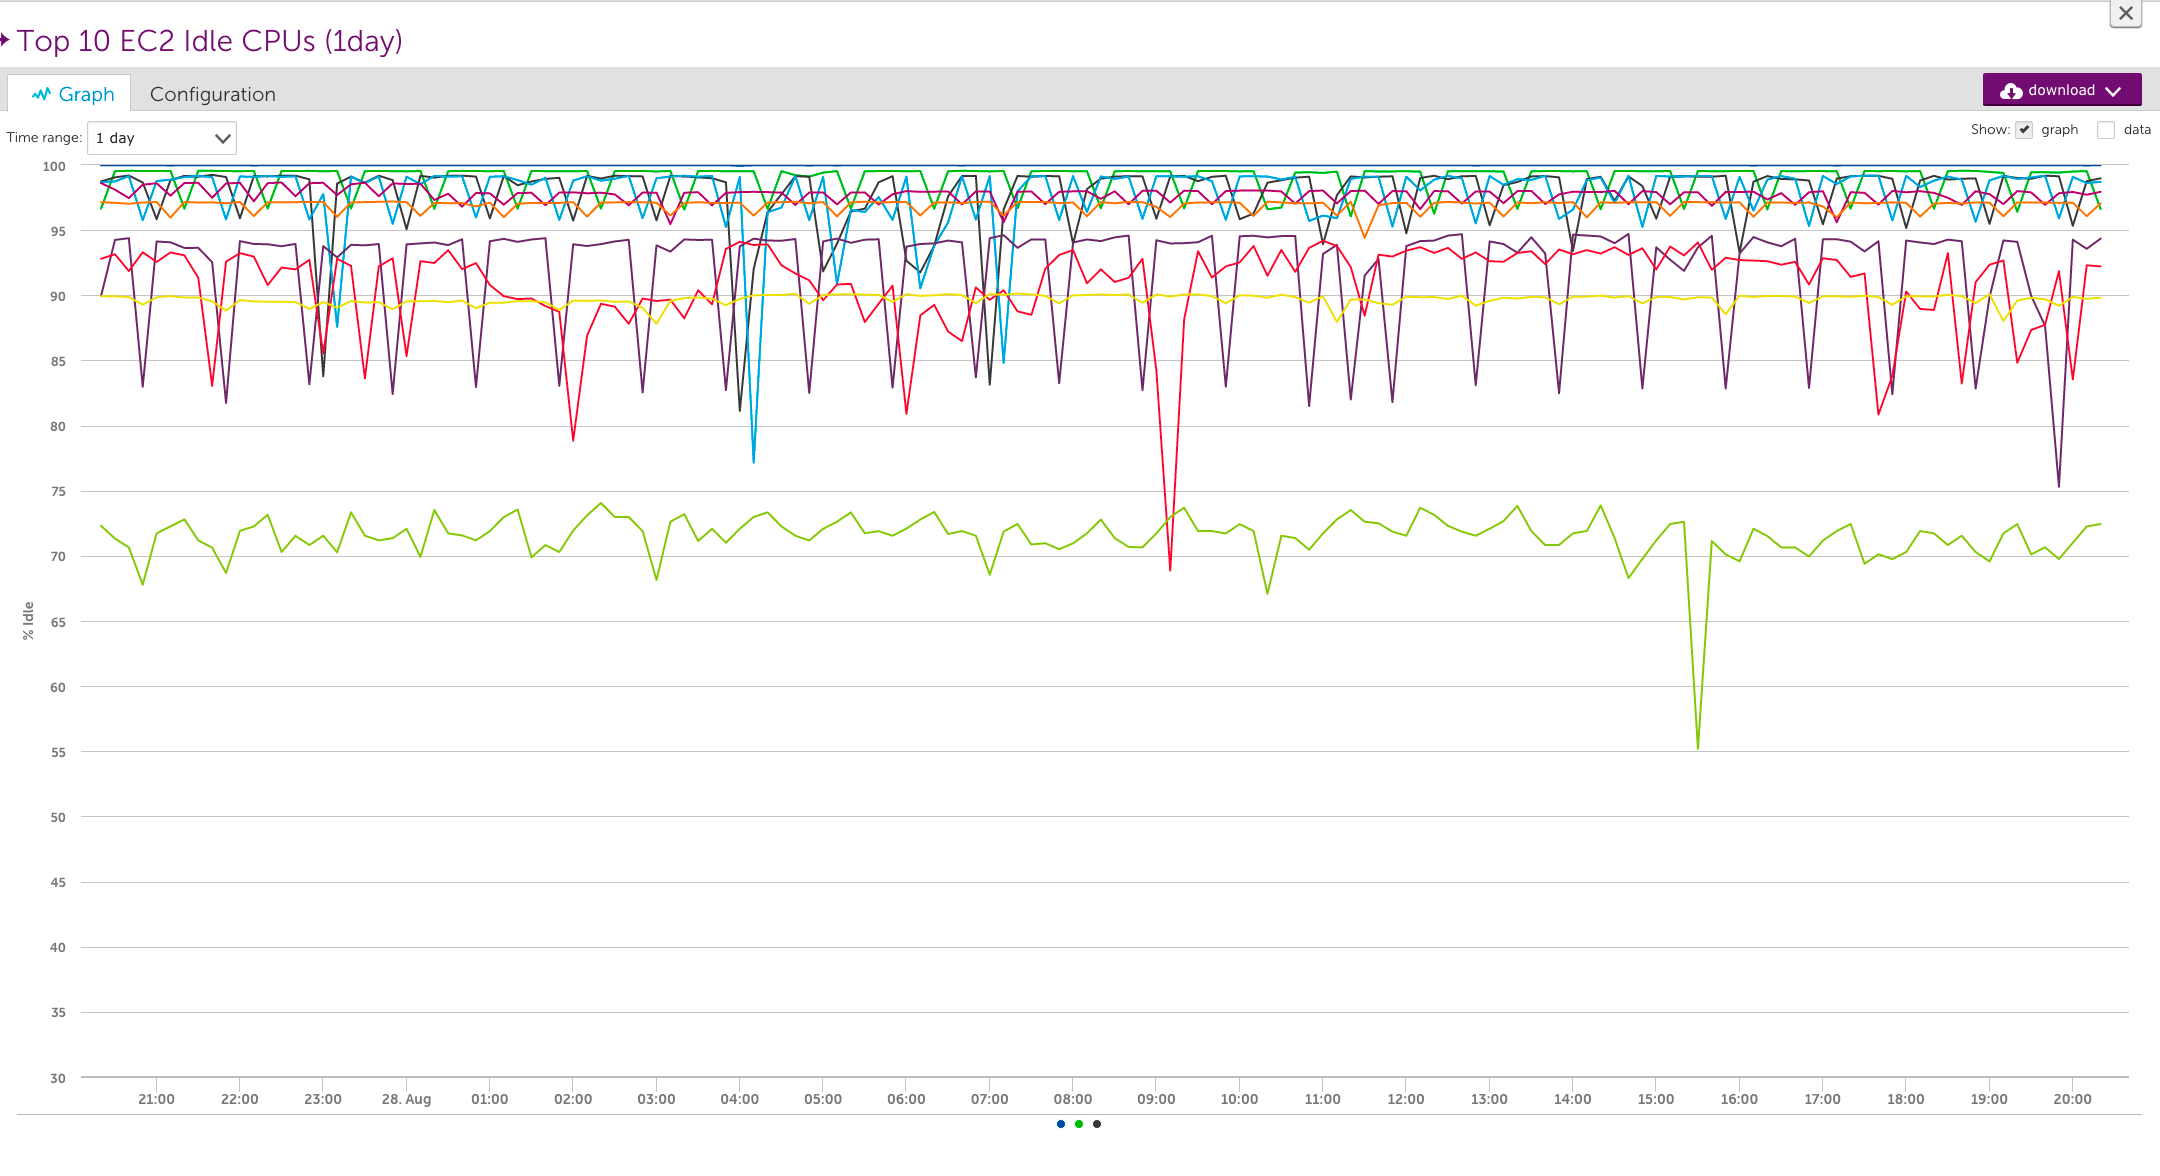
Consider adding widgets to the dashboard you created in 2, or creating a new dashboard dedicated to identifying unused and over-utilized resources. You can use virtual datapoints in your top ten graphs to display your least utilized resources (i.e. bottom ten). For example, you could add a virtual datapoint with the expression “100 – CPU Utilization” to get the CPU Idle percent for your EC2 instances. You may want to create a dashboard with the following bottom ten graphs:
- Bottom 10 EC2 CPUs – if you’ve over-provisioned EC2 instances, you may want to consider terminating extra instances to reduce your AWS costs
- Bottom 10 DynamoDB Provisioned Read & Write Capacity Usages – if you’ve over-provisioned read and/or write capacity units for your DynamoDB instances, you may want to consider reducing your provision capacities to reduce your AWS costs
- Bottom 10 EBS Provisioned IOPS volume throughput percentage values – if you’ve over-provisioned IOPS for your EBS Provisioned IOPS volumes, you may want to consider reducing your provisioned IOPS to reduce your AWS costs
Over-provisioned resources are probably not something you’ll want to receive alert notifications for, but identifying them can help you minimize your monthly AWS bill. To see how our engineers used LogicMonitor dashboards to identify our own under-utilized AWS resources, see this blog post.
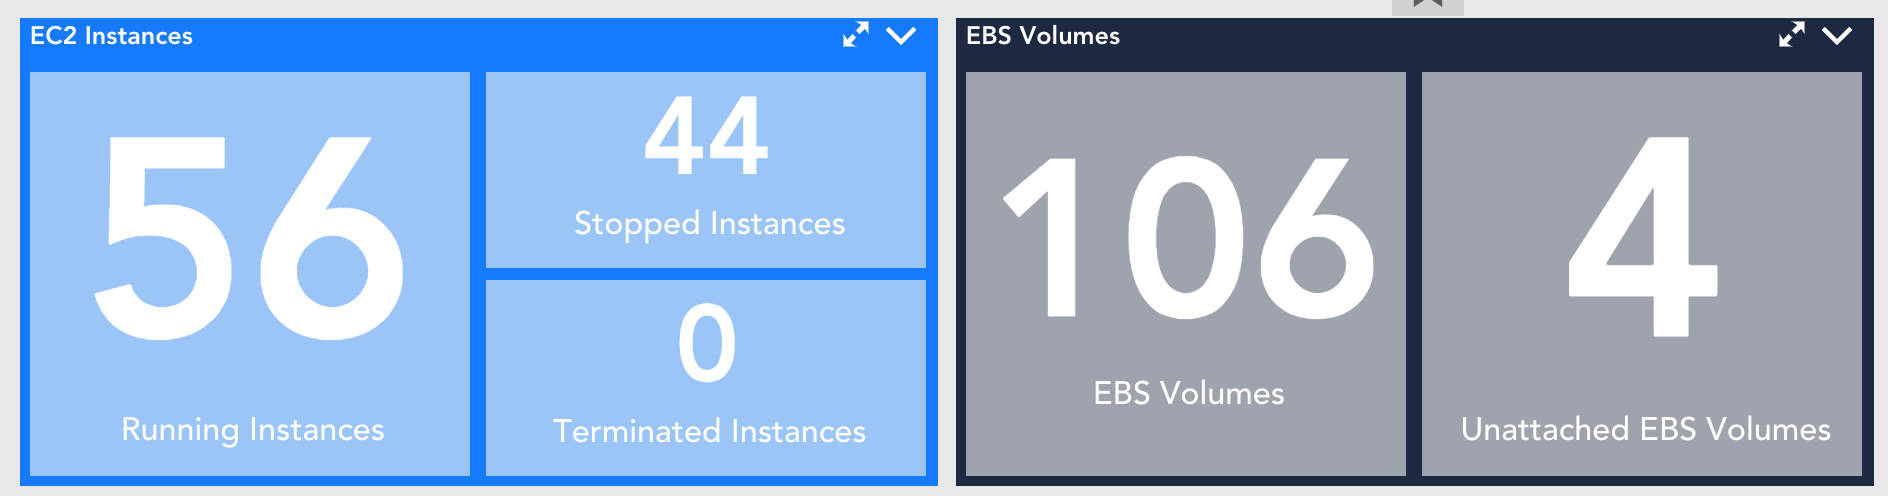
To identify unused resources, you can use the ‘count’ option in the Big Number Widget to match resources with specific property values, such as stopped instances (system.aws.stateName == “stopped”) or unattached EBS volumes (startsWith(system.aws.attachments, “[]”)):