
Adding Kubernetes Cluster into Monitoring as Admin User
Last updated on 26 July, 2023This topic discusses how to add a Kubernetes cluster to your monitored resources.
1. Import the most recent suite of Kubernetes DataSources from LogicMonitor’s Repository: Settings > DataSources > Add > From LogicMonitor’s Repository
2. On the Resource page, select Add > Kubernetes Cluster.
In case you are unable to see the Kubernetes Cluster option, contact your Customer Success
Manager (CSM).
3. In the Add Kubernetes Cluster setup wizard, complete the three steps: (1) General Information, (2) Install Argus, and (3) Add Services.
General Information
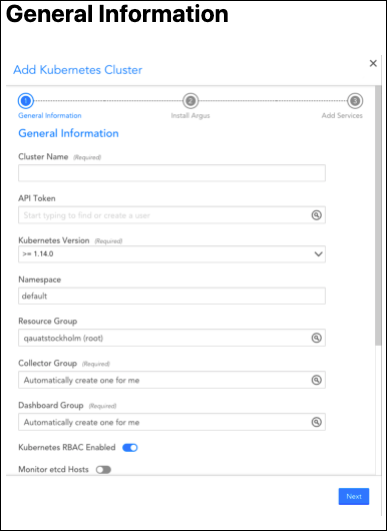
Fill in the following general information:
| Field | Description |
| Cluster Name | (Required) The display name for your monitored cluster in the LogicMonitor resource tree. |
| API Token | LogicMonitor API tokens, which should have sufficient permissions for adding Collectors, Collector groups, devices, device groups, and dashboards, and for removing devices. Because dynamic groups are used to represent the cluster, these tokens need permission to manage the root device group. We recommend that you have a dedicated API-only user for the integration. You can create one as part of this setup wizard. Note: For creating API tokens for authentication purposes, ensure to check the Allow Creation of API Token checkbox under Settings > User Profile. Any user except an out-of-the-box administrator user role can create API tokens. For more information, see API Tokens. |
| Kubernetes version | (Required) Defaults to the Kubernetes version 1.14 or higher (>=1.14.0), which prompts LogicMonitor to provide Helm 3 installation commands on the following wizard screen. If you are adding Kubernetes versions older than 1.14, you can select "< 1.14.0" from the dropdown and LogicMonitor will provide instructions for Helm 2. |
| Namespace | Specify the cluster namespace that the monitoring integration’s application (Argus) should run in. |
| Resource Group | Specify the group under which the monitored cluster will display in the Resource tree. |
| Collector Group | (Required) Specify which group the Collectors will be added into. Defaults to a new dedicated Collector group. |
| Dashboard Group | (Required) Specify which group the dashboards will be added into. Defaults to a new dedicated Dashboard group. |
| Kubernetes RBAC Enabled | Toggle on if RBAC is enabled in your cluster. |
| Monitor etcd Hosts | Toggle on if you have etcd running external to your cluster. You will be prompted to enter a discovery token. |
| Enable Proxy | This setting enables proxy access, which may be needed for cluster applications to access the LogicMonitor API to add/remove resources to/from monitoring. You will be prompted to specify a proxy server, username, and password. |
| Exclude resources from discovery | Specify resources to exclude from monitoring based on its Kubernetes resource labels. For example, you may want to exclude deployments (such as QA or Dev) from monitoring. |
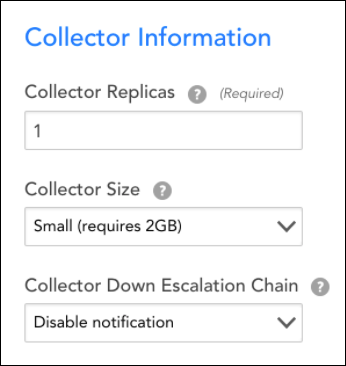
4. In the Collector Information section, enter the number of Collector replicas (Required), a Collector size, and a Collector escalation chain.
These fields control how many containerized Collectors run with the cluster, what size those Collectors are, and where “Collector down” alerts get routed.
Permissions Required for Installing Clusters
You require the following permissions to install clusters:
Collectorset-controller
| APIGroup | Resource | Verbs | Comments |
| core | pods | all (star wildcard) | |
| apps | statefulsets | all | Collectorset-controller creates statefulset object for collectors |
| all (star wildcard) | collectorsets | all | Controller for collectorset objects |
| apiextensions.k8s.io | customresourcedefinitions | all | Creates custom resource |
Collector
| APIGroup | Resources | Verbs | Comments |
| core | PodsContainersNodesComponentstatusesReplicasetsIngressServicesEndpointsPods/logEvents | ListGet | View access |
| AppsExtensions | deployments | ListGet | Deployments of APIGroup apps and extensions |
| core | nodes/stats | get | |
| autoscaling | horizontalpodautoscalers | ListGet | |
| discovery.k8s.io | endpointslices | ListGet | |
| Non Resource URLs | //healthz/healthz/*/metrics | Get |
Argus
| APIGroup | Resources | Verbs | Comments |
| core | PodsContainersNodesComponentstatusesServicesPods/logNamespacesPersistentvolumes | ListGetWatchUpdate | |
| core | configmaps | ListGetWatchUpdateCreateDeletecollection | Argus speeds up boot on restart by leveraging Configmaps to store client cache. Configmaps are also used in delta calculation to reduce LogicMonitor’s enormous rest call to avoid API rate limit thresholds |
| apps | DeploymentsDaemonsetsReplicasetsStatefulsets | ListGetWatch Update | |
| autoscaling | horizontalpodautoscalers | ListGetWatchUpdate | |
| Non Resource URLs | //healthz/healthz/* | Get |
Excluding Resources from Monitoring
To exclude the resources from monitoring, complete the following steps:
1. On the Resource page, select Add > Kubernetes Cluster.
2. On the Add Kubernetes Cluster setup wizard, in the General Information section, enable the Exclude resources from discovery option.
3. Add Labels key and Label Values for the required resources and click Save.
4. Add the required information in the General Information, Install Argus, and Add Services section.
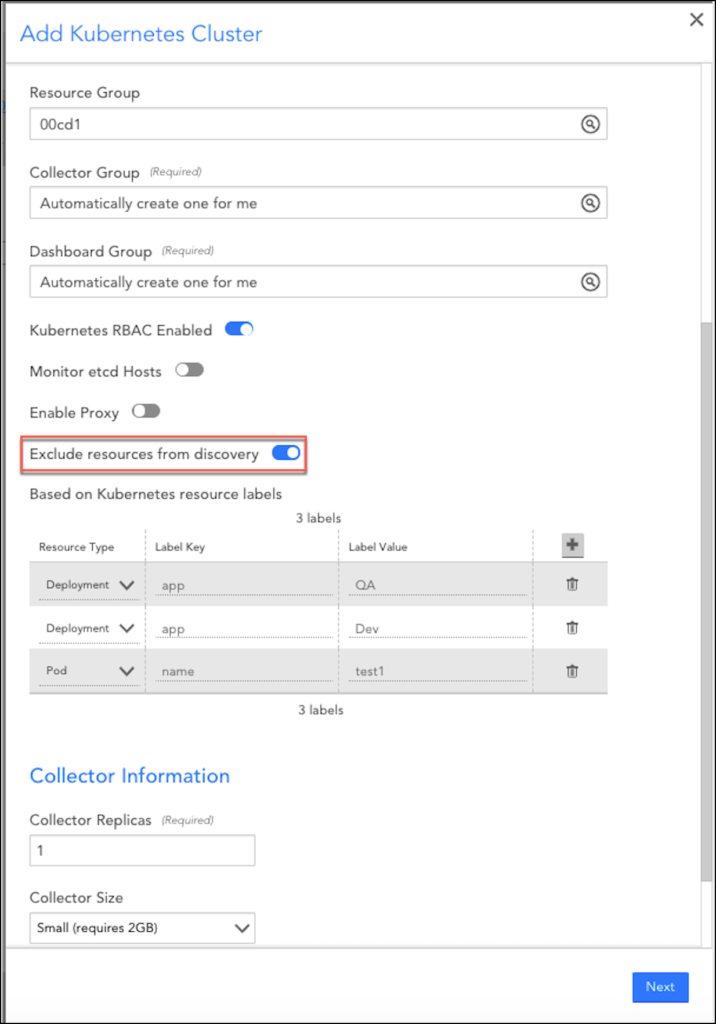
As shown in the earlier image, all the deployments with Label Key as “app” and Label Value as “QA” or “DEV” and all the pods with name as “test1” will be excluded from monitoring.
Note: If you using Argus v6.0 or later, and the existing filtering configuration contains “ * ” for excluding all the resources from monitoring, you must remove “ * ” from the filtering configuration.
With Argus v6.0, you can use the disableResourceMonitoring parameter to exclude all the resources of a specific type. You must specify the resource type in the disableResourceMonitoring parameter list.
disableResourceMonitoring:
- nodes
- services
- deployments
For information on upgrading to Argus v6, see How to Upgrade to Argus v6.
If you are using v5 or previous, you can exclude all the resources by adding * in LabelKey and LabelValue. However, this feature is available only for Argus versions earlier than v6. For example:
| ResourceType | Label Key | Label Value |
| Deployment | * | * |
| Service | * | * |
With the following command, you can exclude all the services and deployments from monitoring:
--set filters.service=\"*\" --set filters.deployment=\"*"\
Note: Filter expression in helm command must be escaped using backslash while using wild card * to exclude all resources
Install Argus
The setup wizard provides the configuration and installation commands for the applications needed for monitoring, CollectorSet-Controller, and Argus. For more information, see Argus Installation.
Add Services
This step of the setup wizard does not display if LM Service Insight is not enabled in the account.
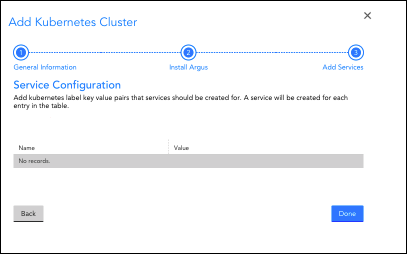
You have the option of configuring Services for specific Kubernetes label key-value pairs. Each key-value pair you add to the table will result in a new Service that groups together all Pods and Nodes with that label assigned. Metrics will be aggregated across these grouped Pods and Nodes to provide monitoring for overall health based on that label.
New Pods and Nodes will be automatically incorporated in the Service, and terminated Pods and Nodes will be automatically removed. The aggregated Service-level data will persist regardless of changes in underlying resources.
Where to find the Cluster
When setup completes, you’ll see a notice for a new Resource Group, Collector Group, and Dashboard Group.
The Resource Group representing your cluster dynamically groups Nodes based on worker role, and Pods and Services based on namespace:
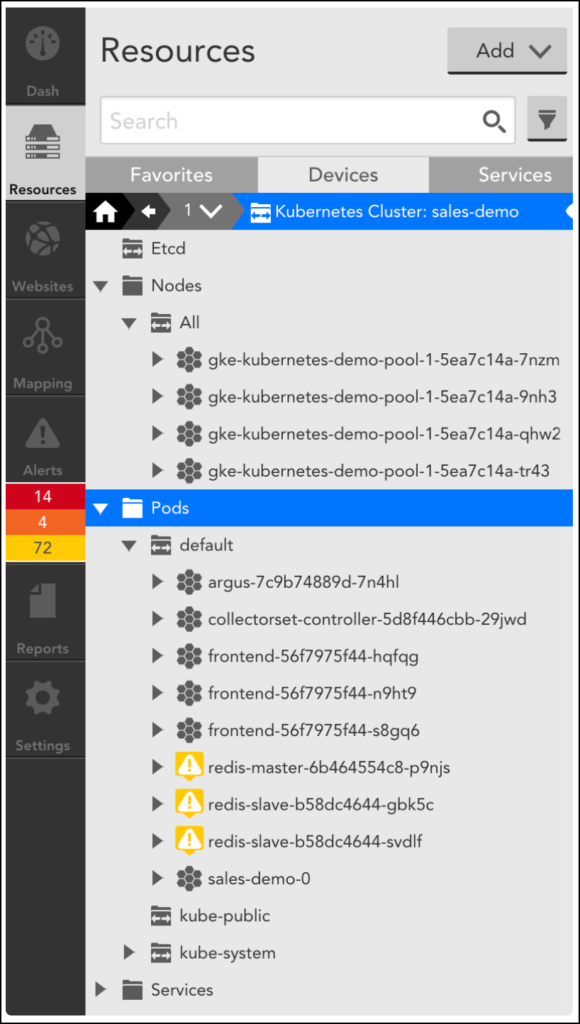
Data is automatically collected from the Kubernetes API for Nodes, Pods, Containers (which are automatically discovered for each Pod), and Services. Additionally, standard applications will be automatically detected and monitored with LogicMonitor’s existing LogicModule library (based on AD for existing modules).
Note: Now even a non-admin user can add Kubernetes clusters. For more information, see Adding Kubernetes Cluster into Monitoring as Non-Admin User.