
v.106 Release: Website Import/Export and Adding DataSource Graphs to Dashboards
Last updated on 14 September, 2022The v.106 Release will be rolled out through the end of June. Yes, this is a lighter release, but stay tuned! We have some major updates coming your way in the coming releases…
Among the improvements you will see with v.106 are:
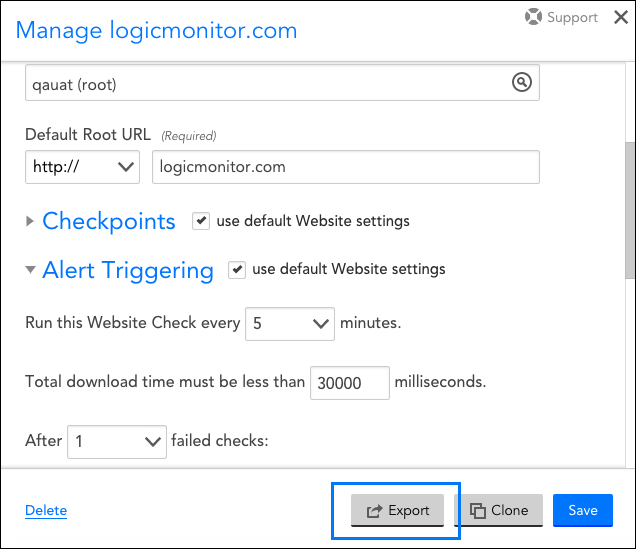
We’ve added the ability to export and import Websites! Using this functionality, users can easily export Web Checks and Ping Checks as JSON files. These exported files can then be imported when creating new Web Checks and Ping Checks (Websites | Add | From File). This new feature is ideal for sharing complex Web Checks or storing Websites externally for versioning purposes.
Copying DataSource graph to Dashboards
DataSource instance graphs from the Devices panel can now be added to a Dashboard as a Custom Graph Widget. This enables users to modify the graph to fit their needs. Previously, these widgets were not editable. Overview graphs without underlying instances will also be added as a Custom Graph Widget.
Other Improvements
Alerting
- To avoid infinite mail loops that can have an impact on LogicMonitor and customer email systems, responses to malformed acknowledgement and SDT messages will now be sent from [email protected]. This will prevent situations where auto-responders on both sides exchange messages in an infinite loop.
Devices
- The “Device Types” filter available for the built-in “Unmonitored Devices” group has been updated to support the additional types of devices NetScan now detects. The following device types are available for selection from the filter dropdown: Printer, VMware, Linux Servers (previously labeled Linux), Network (previously labeled Cisco), Windows Servers (previously labeled Windows), NetApp, VMware Hosts, VMware vCenters, XenServer, Hyper-V, EMC, SQL Servers, Collectors, and Misc.
- Any user who deletes a device/device group now will be able to view, permanently delete, or recover the device/device group. Previously, only users who had root management privilege (usually users with administrator role) could perform these actions.
LM Cloud
- The Poll Now response for Azure Monitor API based data collection (Azure Insights method) has been improved to include more detail from the Azure Monitor API response. You may find this more useful for identifying issues with Azure Monitor API data collection.
- The “Azure Billing: Cost By Subscription” DataSource now reports subscription name as instance description (rather than subscription ID).
LogicModules
- When establishing filter criteria for EventSources that monitor SNMP traps, a new filter type titled “Message” is now available. This allows you to filter SNMP Trap alerts based on the existence (or absence) of any RegEx string contained within your trap message body. Please note that this requires use of Collector 27.100 or greater.
- Authentication to a Windows Management Instrumentation (WMI) host now supports NTLM v2.
Bugs Fixed
- Device level properties were being prioritized over instance level properties in alert messages. This has been fixed.
- The AWS permission test was previously not checking for ‘cloudfront:GetDistribution’ permission, which is necessary for CloudFront monitoring. This has been fixed.
LogicModule Releases
Below is a list of new and improved LogicModules that were implemented since our last release:
New Monitoring Coverage
- Microsoft Azure Resource Health – 1 DataSource
- Microsoft Azure DataLake Analytics – 1 DataSource
- Microsoft Azure DataLakeStore – 1 DataSource
Monitoring Improvements
- CommVault Job Status – 1 DataSource
- fixed authentication, added support for additional possible job statuses
- Cisco_IOS – 1 ConfigSource
- modified method responsible for Cisco device privilege escalation to improve both its logic and readability for advanced users
- AWS EC2 – 1 DataSource
- fixed endpoints to properly calculate rates (you will see a spike in graphs once upgraded but it more accurately reflects CloudWatch)
- Citrix Netscaler – 1 DataSource
- Updated AppliesTo field to match the Netscaler PropertySource
- Mysql Innodb Percona – 1 DataSource
- Updated AppliesTo to also apply to hosts with a JDBC user or pass