
5. Understanding DataSources
Last updated on 18 September, 2020LogicMonitor DataSources are templates that contain information about how to monitor a particular resource (for example, network device, database, application, cloud resource, and so on), including what metrics to collect, what graphs to display, and what values indicate an issue that needs attention. Each metric that is being collected by a DataSource is called a datapoint, and each DataSource template contains one or more pre-defined datapoints.
Note: LogicMonitor installs with over a thousand pre-configured DataSources to allow you to instantly begin monitoring the majority of resources in your infrastructure, with new DataSources continually being added.
Single-Instance vs Multi-Instance DataSources
If a DataSource will only ever have one one instance to monitor per a resource, such as main memory on a server, it is considered to be a single-instance DataSource. If a DataSource may potentially identify multiple instances to be monitored, such as disks on a server or interfaces on a switch, it is a multi-instance DataSource.
For example, consider a switch with multiple interfaces. It may not be useful to see latency and throughput overall for the switch, but rather, per interface.
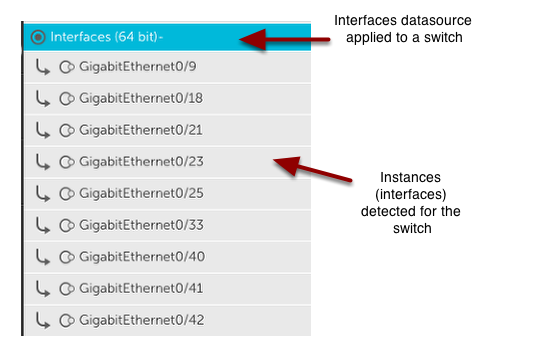
In this example, the Interfaces (64 bit)- DataSource is a multi-instance DataSource that detects each switch interface as an ‘instance’ of that DataSource. Latency and throughput, therefore, are reported for each instance (i.e. interface).
For more information on multi-instance DataSources and how instances are discovered, see Adding Instances.
How DataSources Are Applied to Resources
Each DataSource definition contains AppliesTo logic that determines which resources it will automatically be associated with and begin monitoring data for. For more details on this automated process, see How DataSources Get Applied to Resources.
How DataSources Collect Data
DataSource definitions determine how metrics are collected. Collection methods vary per resource type. For example, the JDBC protocol is used to collect data for Microsoft SQL Server whereas SNMP is used for Cisco devices. For more information on the collection methods available, see Creating a DataSource.
Next Steps
After you’ve familiarized yourself with the various concepts behind DataSources, it’s time to learn how LogicMonitor alerts on the data collected by DataSources.