
Viewing Test and Steps Tab Data
Last updated on 27 July, 2023The Test and Step tab displays each scripted browser check recorded in the form of Steps. This tab is available for Synthetic resources on the Resources page. Each Test is treated as an individual device, and each Test consists of multiple Steps that represent the different operations of your website. This helps you to easily navigate through all of your website’s operations.
The Test and Steps tab displays the test data using the following visual components:
- Test and Step Graph— Displays the step data allowing you to visualize the performance of your website.
- Test and Step Table— Lists all the runtime test data in a tabular format.
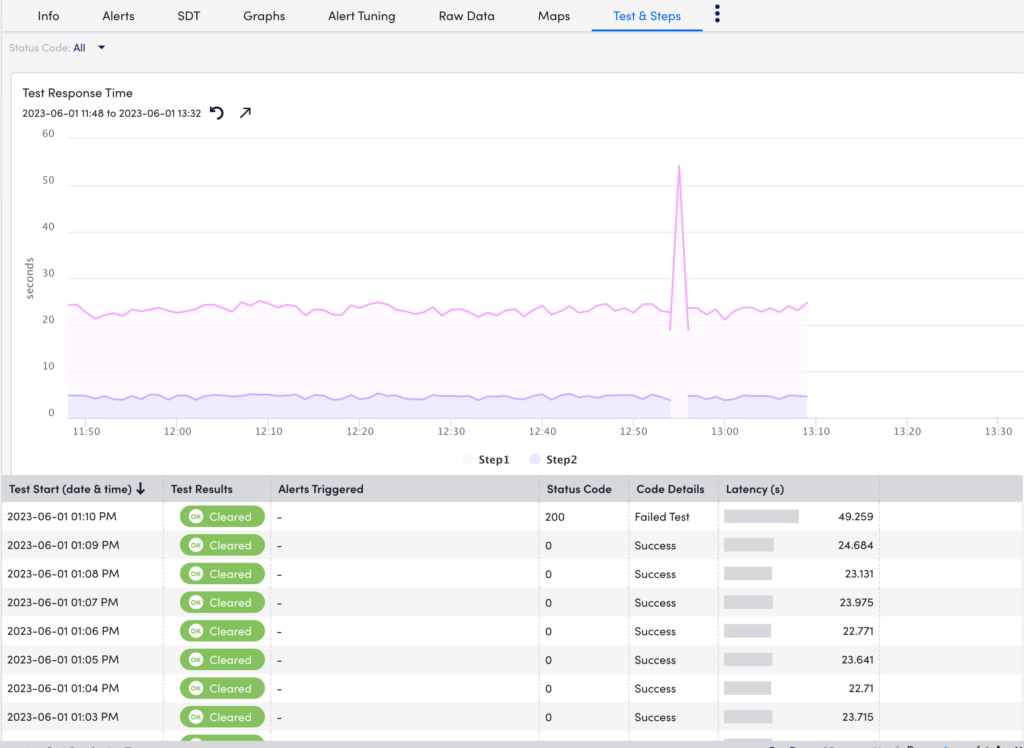
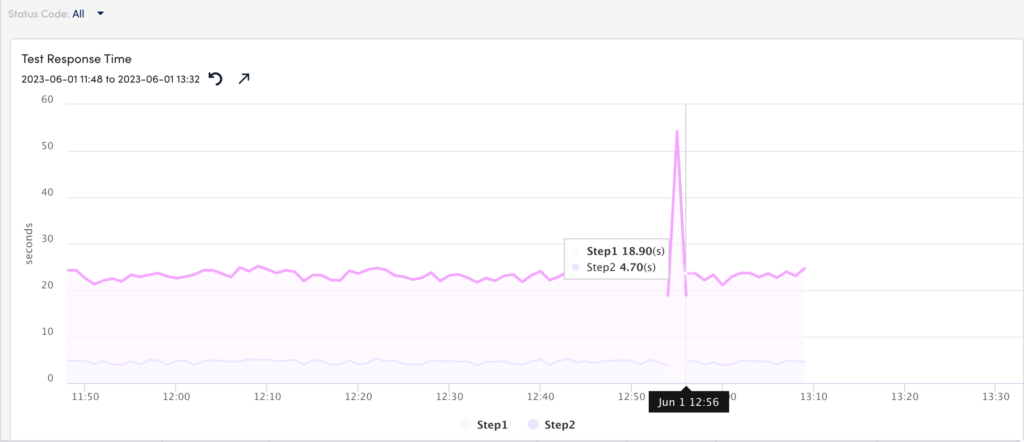
Test and Step Graph
Each Step is represented by a unique colored graph. This allows you to compare the different operations for your website. Additionally, you can filter the graph based on Status Code. For example, when you select 23(Command timeout), only the graphs with that status code are displayed.
Test and Step Table
The runtime data is elaborated for each Step. Each field is detailed below:
| Field | Description |
| Test Start (date and time) | Displays the starting time and date of the Step. |
| Test Results | Displays the Test results of each Step. The different results are as follows:
|
| Alerts Triggered | Displays the total number of alerts triggered for that Step. |
| Status Code | Displays the status code of the Step. For example, the status code “0” indicates “Success”. |
| Code Details | Displays the status code details. For example, the status code “10” indicates code details “Test Skipped”. |
| Latency (s) | Displays the time period from initiating a request to getting a response. |