
July release
Last updated on 14 September, 2022July’s release has a some great new features. It will be released over the last two weeks of the month.
Introducing: OpsNotes
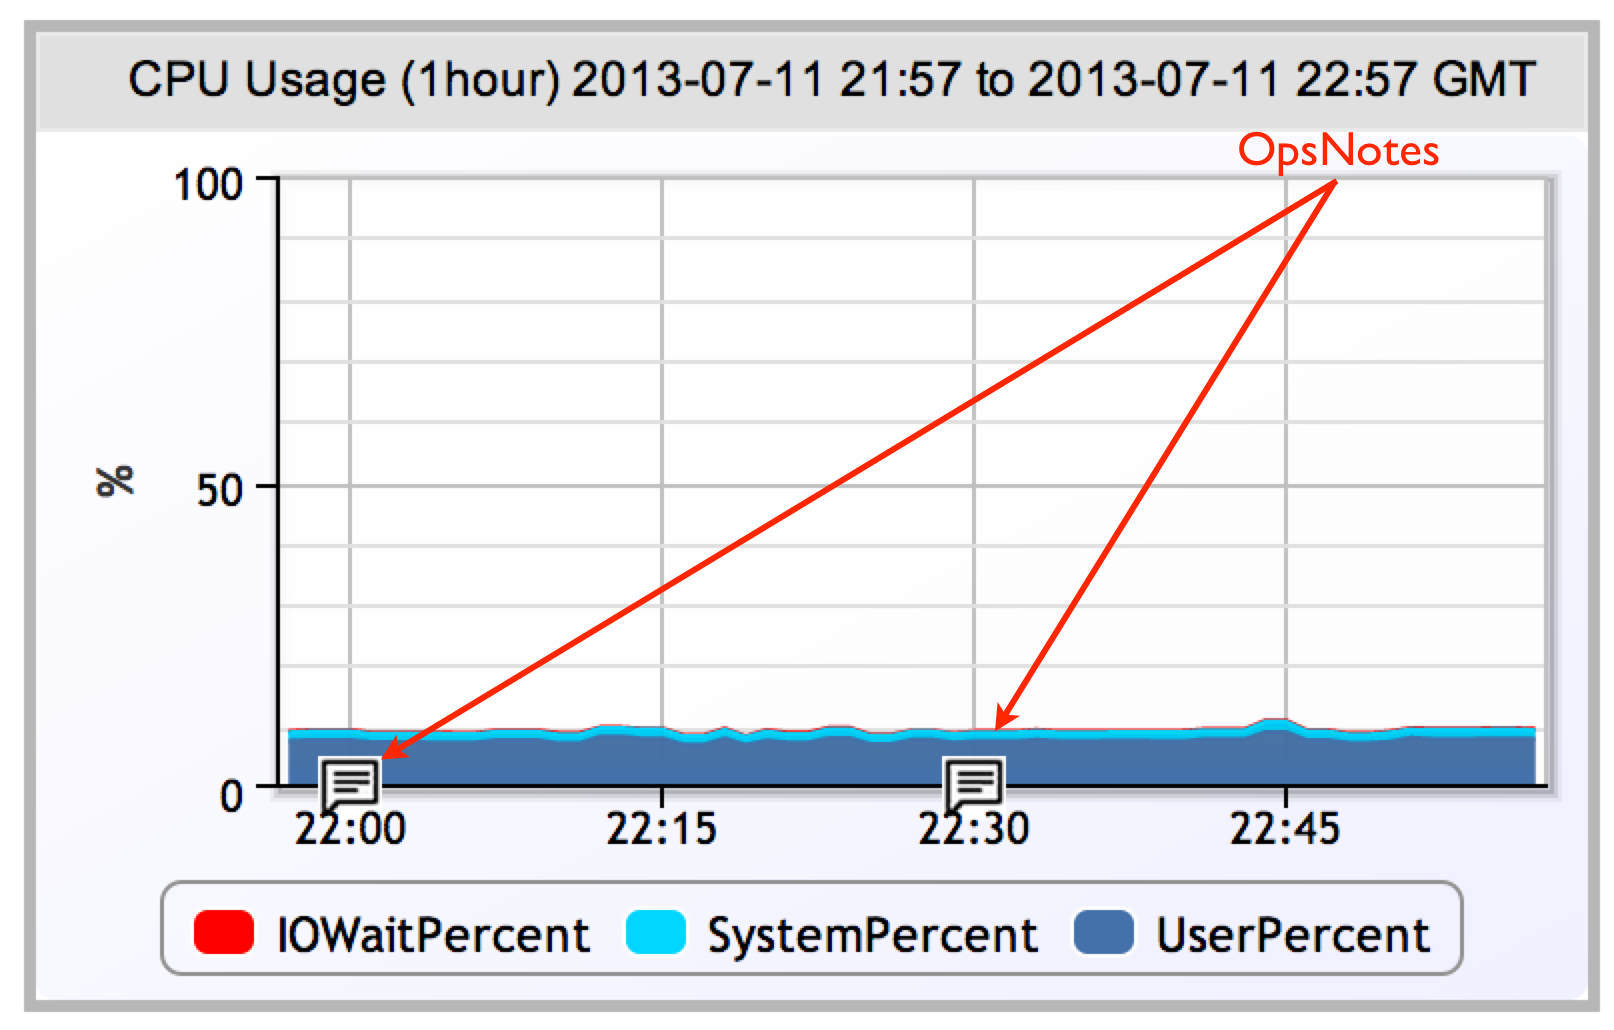
OpsNotes is a great new feature that enables you to add time stamps across graphs. Use it to see how a release or server upgrade impacted system performance, or to flag a spike in one graph so you can view any correlations across other data.
To add an OpsNote, select the OpsNote button from the Dashboard or Hosts tab.

Enter a description for the event, the time it occurred, and add tags. Tags are a great way to search for similar events, and your description will be searchable and will appear when you hover over an OpsNote . As long as the OpsNote you add occurred during the time range you are viewing (double check with Set time range), it will automatically appear on your graphs.
OpsNotes can be turned on and off from the Search tab. You can search by keyword which will search descriptions or by tags. Keep in mind only OpsNotes that meet the current time range show up in the Search window. This is to avoid confusion, we don’t want you turning on the same OpsNote over and over and wondering why it isn’t showing up.
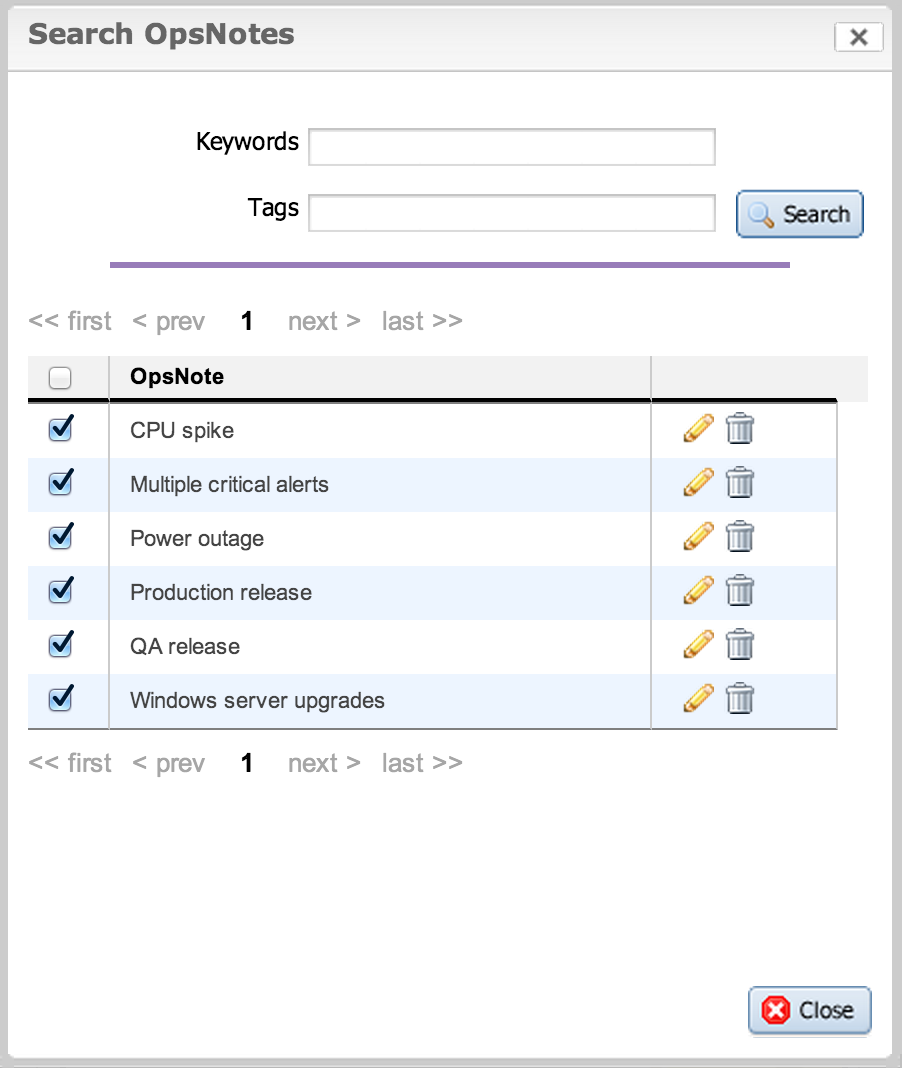
You can also hide all OpsNotes by selecting Disable from the drop down. Under Settings you will find a new option, OpsNotes Management that will enable you to edit and delete OpsNotes and Tags.
OpsNotes are only available for users who have permission to view all hosts. Try it out and let us know what you think!
New Services Configurations
We’ve made our Services monitoring more flexible with polling intervals and alert levels for individual alerts.
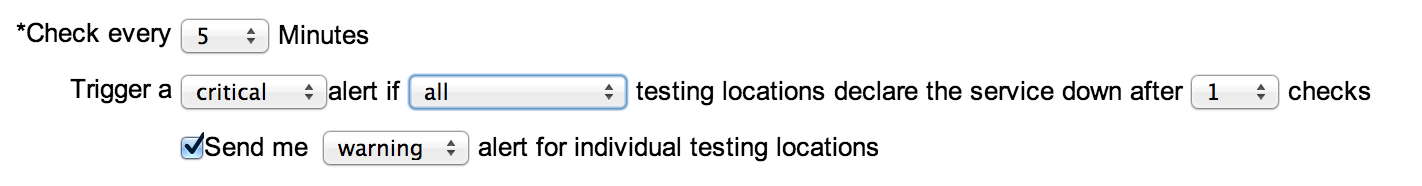
If you want us to check your service every 5 minutes, but only notify you if it’s unreachable for 15 minutes you can set the number of checks to 3. The check interval will also determine how long we wait for an alert to auto clear.
We understand that having all none of our testing locations be able to reach your site may require a different alert level than the same result from only one of our testing locations , so we have added the ability for you to configure alert levels accordingly.
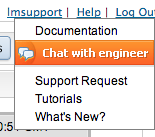
Where’d my chat button go?
There are a variety of ways to learn more about how LogicMonitor can solve your performance monitoring needs, we have grouped these all together under the Help link. Not only can you chat with an engineer, you can also create a support request , peruse our documentation, and view tutorials.
Improvement
- Duration is available as a parameter for the SetHostSDT API
- Host links have been disabled for users who have permission to only view the dashboard tab
- Enhancements to reporting infrastructure to improve report generation times.
Bugs
- Reporting – various fixes in legend displays, friendlier error messages, duplicate report parameters, and requirements for column graph
- The Host Metrics Trend report was only displaying one instance line per host. Lines for each instance for each host appear as expected.
- Within the Services tab, “Disable alerting for all services in this folder” was not working correctly.
- When downloading the raw data from a Custom Graph, the download file was named null instead of graph-yyyy-mm-dd.csv.
- Collector down alerts were not escalated appropriately.
- The un() datapoint expression was returning No Data instead of 0 for infinity values.