
v.68 Release: Managing Instances, Enhancements, and UI Migration Plan
Last updated on 14 September, 2022The v.68 release brings another heap of much awaited enhancements. With the addition of manage instances and easily accessible manage devices functionality, the gaps between the UI versions have been nearly closed. We have a few more changes coming this year, and are starting to evaluate our UI migration plan.
UI Migration Plan
As you’ve likely noticed, new functionality is only being added to the new UI – from dashboard widgets and network traffic flow enhancements to settings role based access controls. We are reaching the point with some functionality where we will not be able to support pages in the old UI.
Our tentative plan is to limit access to the old UI over the next few quarters. It will be done page by page, starting with:
- Services – late 2015. The new Services functionality (new location, default settings, multi step overhaul) cannot work in conjunction with the old view.
- Reports – late 2015 / early 2016. We have a new custom reporting tool we will be introducing that will not be supported by the old UI.
- Dashboards – late 2015 / early 2016. Most users have moved away from the old view on their own, given the new widgets and enhanced functionality. Please let us know if you haven’t, and why.
- Alerts and Settings – early 2016. The role based access control in the old UI is limited, as is collector management. The filtering and format of the alerts page is also much more powerful.
- Devices – mid 2016. Saving the best for last. We recognize this is the area of the application we still need to fine tune, specifically as it relates to navigation. We also know this presents the hardest workflow transition, and will be conservative as we set a date for this change.
We need your help to make sure this transition goes smoothly, please use the feedback button if there are functions for which you still rely on the old UI.
Managing Instances
One of the remaining gaps in the UI conversion has been the ability to easily manage instances. With v.68, we have added the ability to manually add instances (for datasources without active discovery), edit the instance description, and globally enable or disable alerting for instances from the device datasource. We have a few more enhancements still in the works.
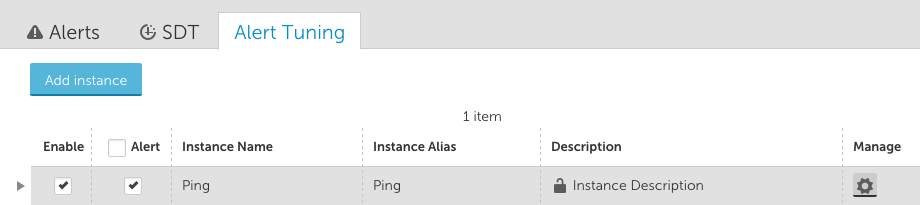
The Alert Tuning section for multi-instance datasources includes an Add instance option. This can only be selected if Active Discovery is globally disabled for the datasource.
For manually added instances, the manage option gives you the ability to update the instance name, wildcard value, description, and instance group.
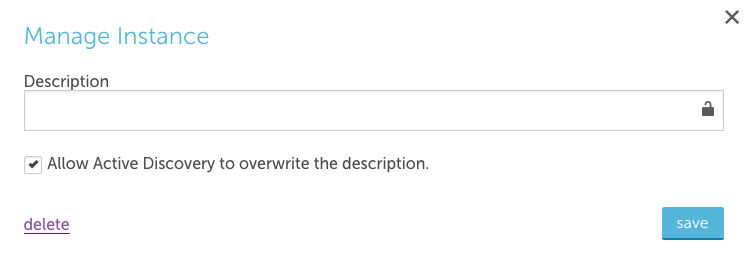
For instances added by Active Discovery, the manage option gives you the ability to update the instance description and to allow any description found by Active Discovery to replace manual descriptions.
Big Number Widget
Enhancements were made to the big number widget to improve the overall layout and display.
Additional configuration options are now available to easily rearrange how numbers are displayed in the widget, and to round values so they will display within the available space:
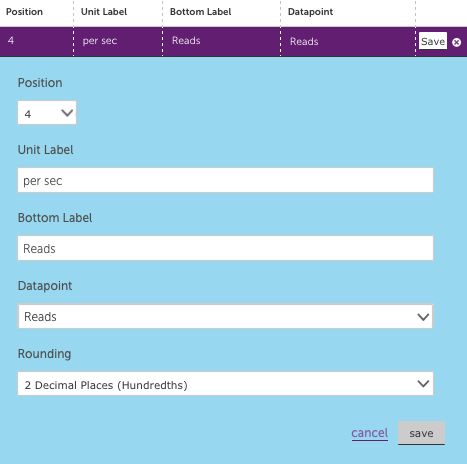
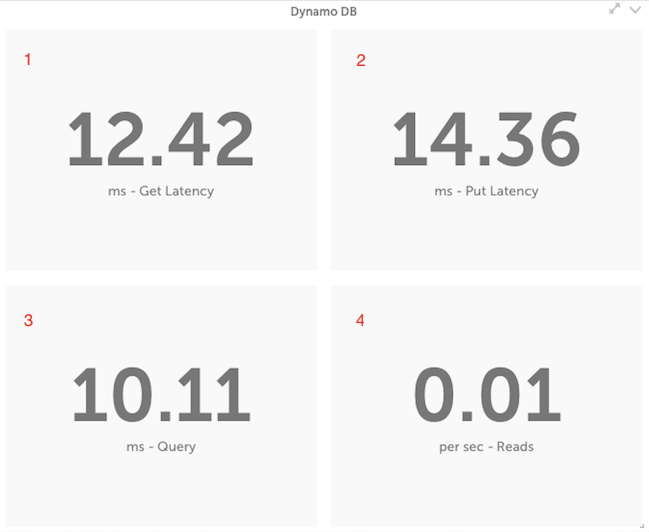
The location of each position is as follows:
You may also notice that the unit and bottom labels have been centered under the numeric value. If you have a value where you would like to display more than two decimal places, we recommend creating a virtual datapoint to adjust the value as needed.
Managing Devices and Adding Monitoring
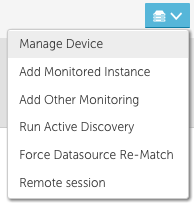
Prior to this release, many functions such as managing a device, adding other monitoring, and remote session were only available when you navigated to a device in the device tree. We have added the ability to directly access these functions from a datasource or instance.
Alerts Filters – Subgroup Distinction
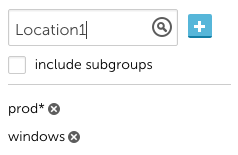
Trying to filter the Alerts table by group can be tricky when it comes to distinctly excluding subgroups. The filter logic has been updated to treat a group name as distinct, and Group* as including all subgroups. To make this easy when filtering, a checkbox has been added to include subgroups. If checked, the * will automatically be appended to the filter.
New Shortcut – Shift + Click
If you’re trying to check multiple rows in a table, such as the Acknowledge checkbox in the Alerts table, you can now use shift + click to select a range. Simply select the first item and then hold shift when selecting the last item in the range. Part of our ongoing effort to make tasks easier.
AWS Improvements:
- There are a few ways a AWS resource can be automatically removed from your account. One is to set the account or service default to automatically remove a terminated instance immediately or after x days:The prompt was updated to clarify this is triggered if the resource is no longer found within AWS.
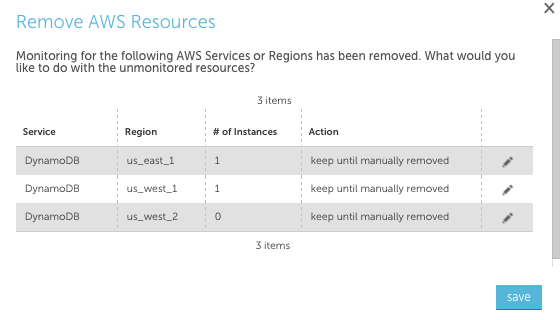
- You can also configure removal of a resource by de-selecting a service or region to be monitored. If this is done, the default retention period will default based on the configuration for the service.
In the next release, we will include details regarding why the resource is no longer removed and the expected delete date in the Device detail page header. - Added the options to automatically remove terminated AWS instances after 14 or 30 days.
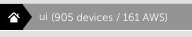
- The total count of AWS devices is available in the device tree.
We also have a datasource to give you the average count of AWS devices per day, use the feedback button to let us know if you’re interested. - Reformatted the AWS tag property from system.aws.tagname to system.aws.tag.name.
Other Improvements
- All widgets now include the format for an embedded URL. Please keep in mind that it is advised to only configure these with credentials for a read only user.
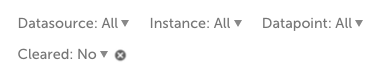
- The Cleared alert filter is a static option on the Device Alert tab. Since this is the easiest way to see alert history for a device or group, we made it easier to find. Only active alerts display by default.
- If a group is not selected when adding a dashboard, it will automatically be added to the root folder.
- The total number of alerts will always display on the alerts page, regardless of page count.
- Sorting the alert table will be preserved between views. Sorting by severity will always display critical first.
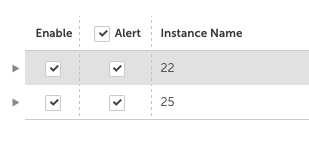
- Added a select all option for turning alerting on and off for all instances of a datasource. This can be particularly helpful if you have a lot of interfaces or ports you’d like to disable at once:
- There is a new role based access control configuration for ‘Allowed to manage Device Dashboards.” This is checked by default, as prior to this option all users who could view device dashboards could also make changes. If this is unchecked, users can still see devices and associated device dashboards but will not be able to add or change configurations.
- We updated the manage collector screen, to make it clear when you are restarting a collector versus reviewing collector configurations. You can restart directly from the manage screen, or click Support to select Collector Configuration.
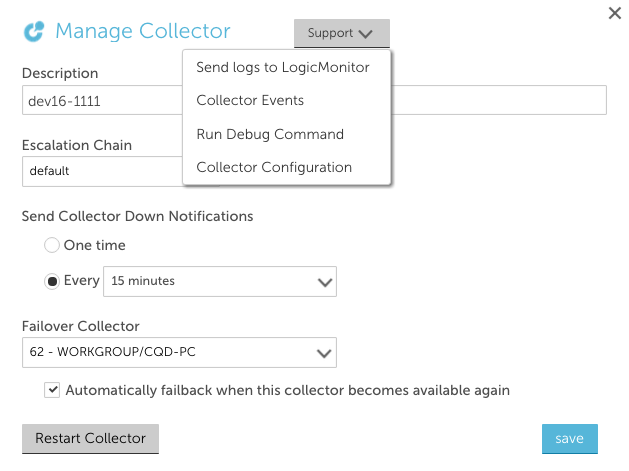 Selecting Collector Configuration will give you the opportunity to view the various config settings. If changes are made, you can Save and Restart from that view.
 - Small improvements made to the Single Sign On configuration, allowing you to view metadata when SSO is disabled, and removing the need to select SAML 2.0.
- Clicking Save while editing a widget will automatically save any active, edited table rows
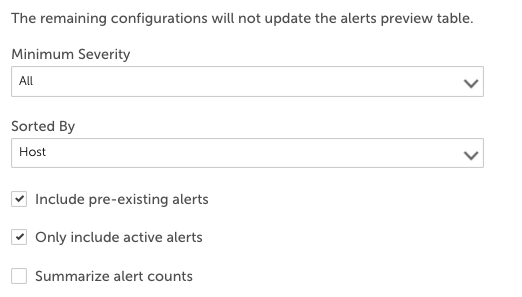
- The new alerts report configuration has been well received, but the distinction between what would update the preview (filters and columns), and the other criteria was not clear. We’ve added a distinction between the filters and the settings that will not update the preview:
- Added the ability to import eventsources and batchjobs from the LogicMonitor repository or from XML.
- We removed disabled datasources from the Device Dashboard view, making it easier to quickly find what you’re looking for.
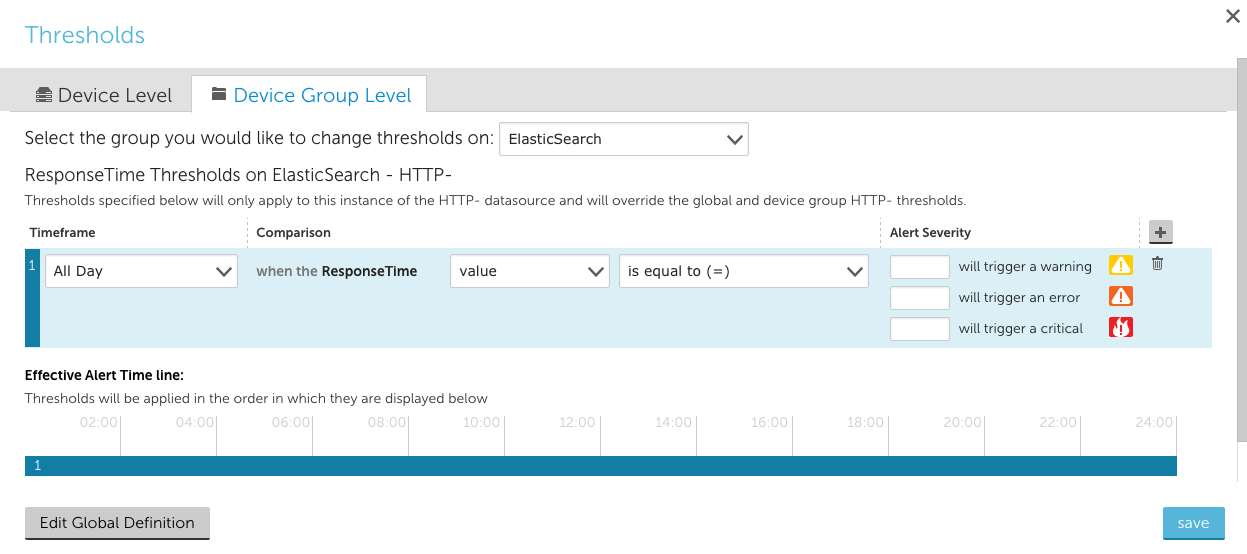
- When editing thresholds for a datasource, you can choose to edit them at the datasource or group level. When making group level changes, you will be able to select any group you have the permissions to manage:

Bugs Fixed:
- There was an issue with the Google Map widget where a javascript error would cause it to default to California. This has been resolved. We also fixed zoom, so the widget will preserve your zoom level between views.
- Adding monitored processes and services would display an error “Getting processes please try later.” The root cause has been fixed, and better error messaging has been added.
- Manually adding a monitored instance will refresh the Device tree so the instance can be viewed.
- The dashboard alert widget did not have the group column, this has been added.
- When adding a linux process, if the process already exists an unclear error was displayed.
- When viewing an event alert in the Alerts page, alert details would not display.
- Specific eventsources and instances were not correctly reflecting the alerts disabled status set at the datasource or device level.
- OpsNotes would not persist after resetting zoom, or would cause an issue with graph autoscaling
- Batch jobs will display the happened on and finished on time, not only date.
- Properties for the ConnectWise integration were not correctly created for a new integration
- The applies to wizard for device groups had an option to filter based on other group criteria. This was removed, as trying to do so would result in an error.
- Users with manage collector rights, but no rights to configure alert settings, were getting an incorrect Permission Denied e
rror when accessing settings. - When performing a device search, standard devices and cloud devices were displaying the same icon. Cloud devices now display the cloud icon.
- The new device search is powerful, so powerful it was returning all datasources for each device even if there was no associated instance. Search will only return monitored devices and instances now.
- Windows event IDs were not displaying correctly. The specific Windows eventcode is now the event ID.
- The pie chart has been updated to only display the instance name in the legend, which is in line with how tokens are assigned in other widgets.
- Disabling alerting on a group or device resulted in an access log entry without adequate detail. The entry now includes the group or device and action taken.
- Group thresholds were not displaying correctly in the alert tuning, threshold column.