Dexda User Process Flow
Last updated on 22 February, 2024Scenario: Checking the health of your systems and managing issues
The following describes a suggested routine for checking system health, and monitoring, investigating, and acting on critical issues.
- Get an overview
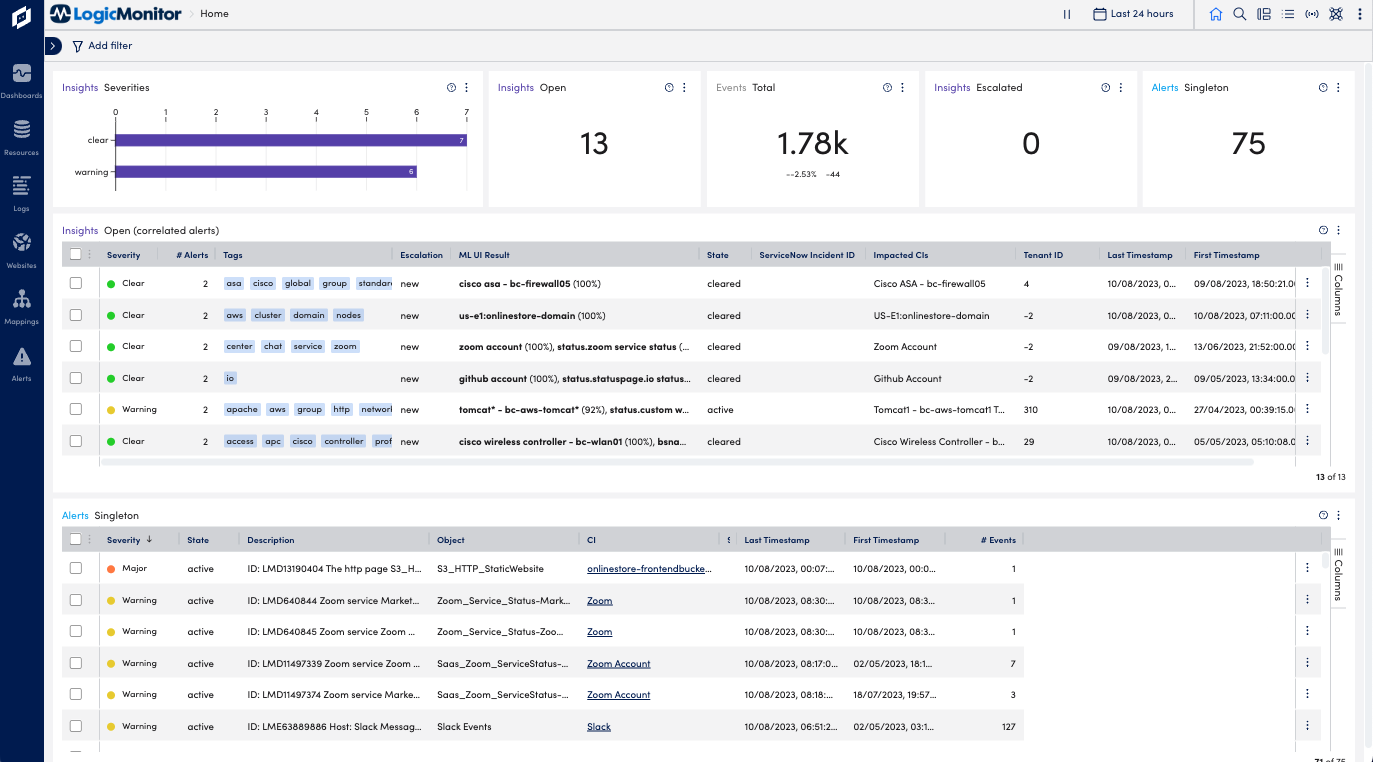
- Log in to Dexda and open the Insights Dashboard to get an overview.
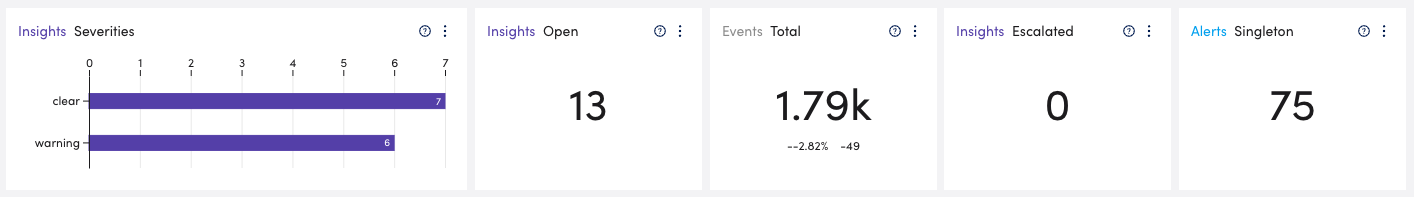
- Check the key metrics at the top. The differential metrics shows the change in number of events compared to the previous time period. Do you see any alarming changes here?
- Check the number of insights that have been escalated to incidents in ServiceNow.
- Log in to Dexda and open the Insights Dashboard to get an overview.
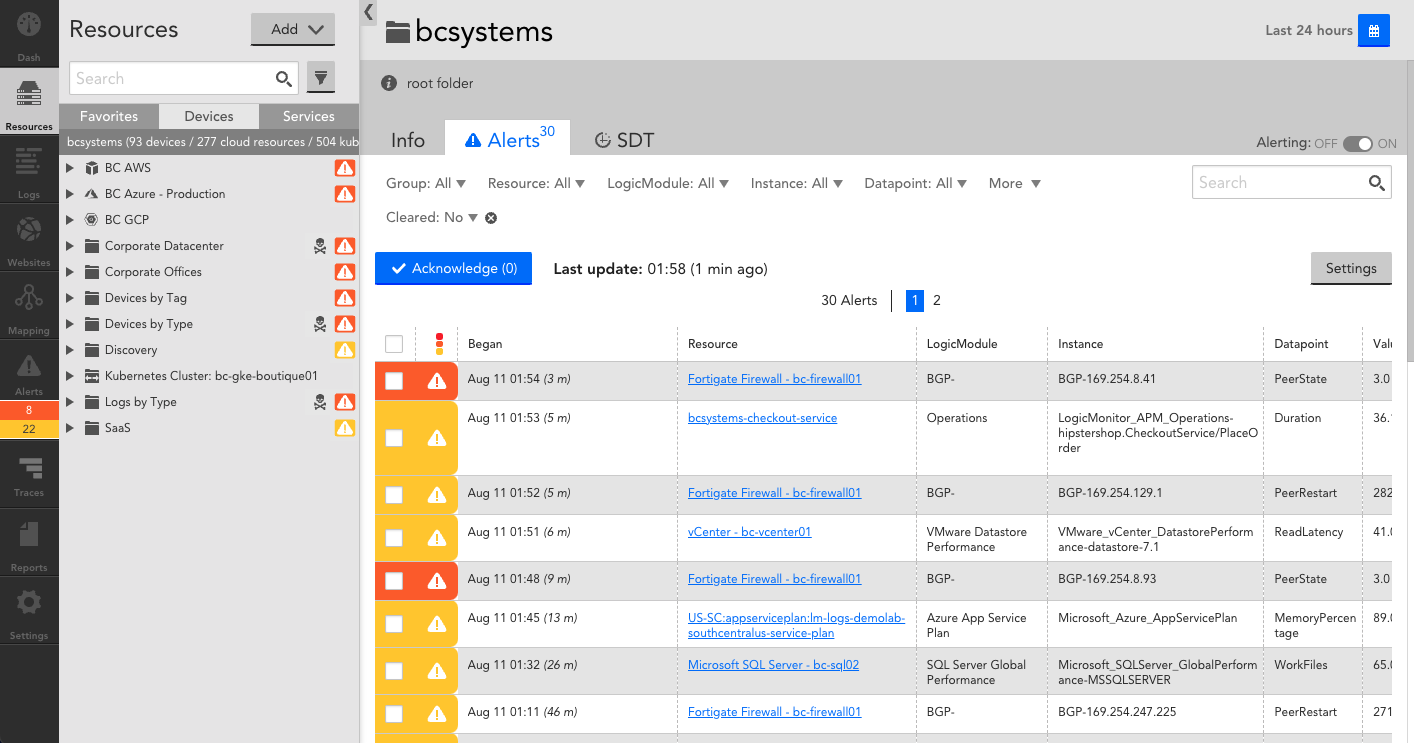
- Review alerts and insights
- Browse insights and singleton (uncorrelated) alerts – find out if there are any new alerts or insights.
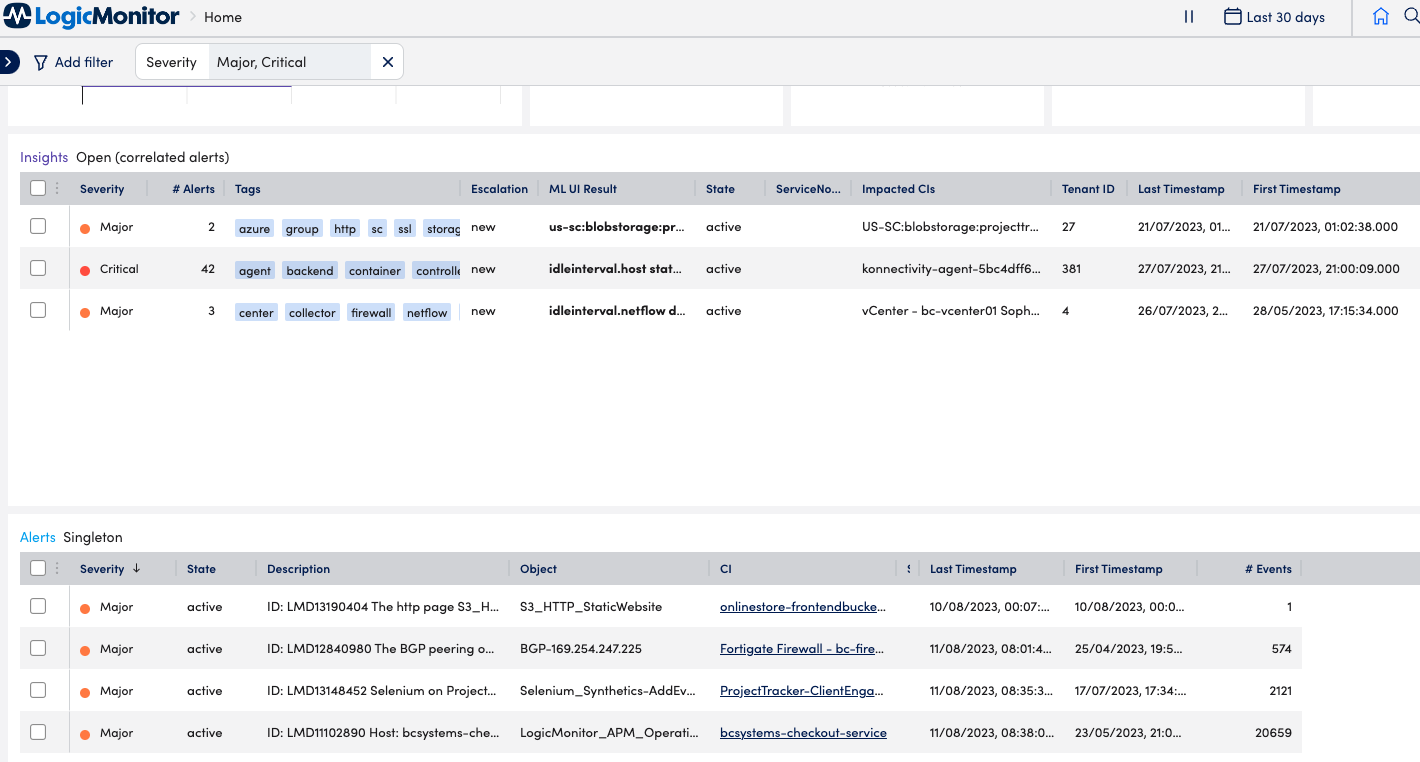
- Filter the dashboard view and narrow down issues for example based on severity, tenant ID, or specific resources.
- Find out if there are any critical issues that need immediate attention?
- Investigate critical issues
- Right-click the insight to open Insight Details, explore the information in the left panel.
- Look at the summaries, associated Tags, Tenant ID, and causal and impacted resources (CI). Can you identify the resource that seemed to have caused the issue?
- Click the ML Results tab to see what the insight correlations were based on.
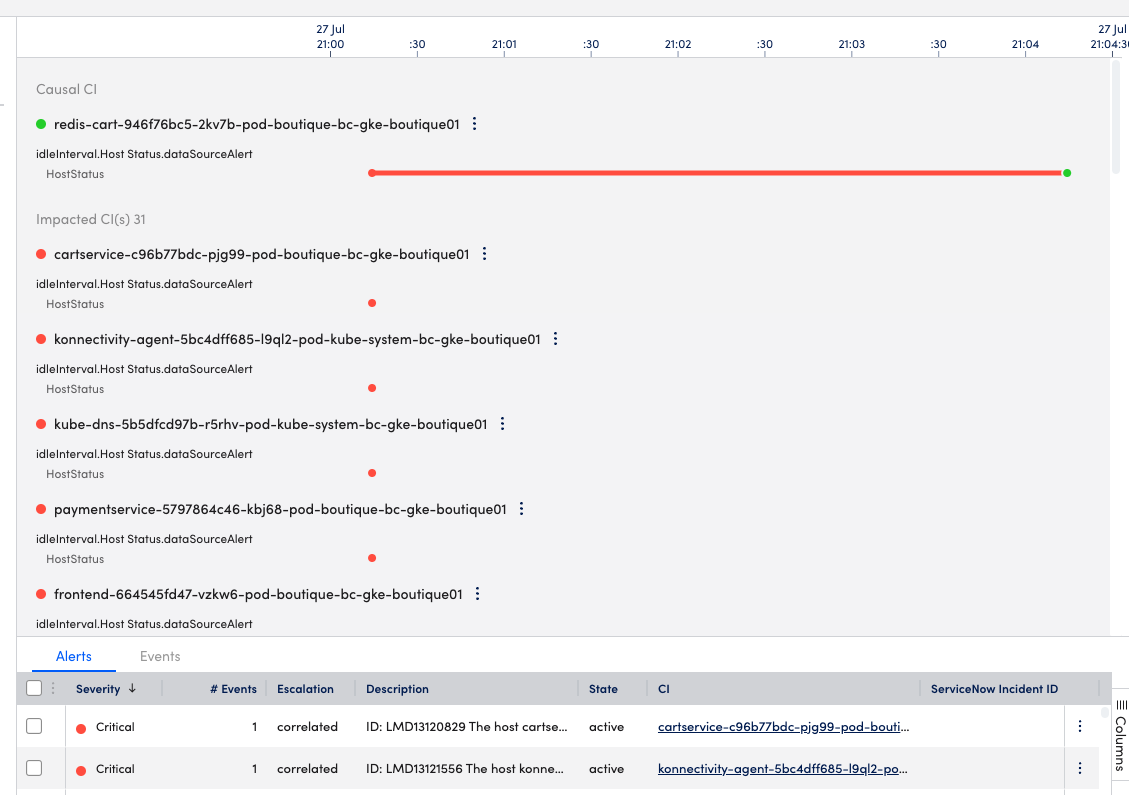
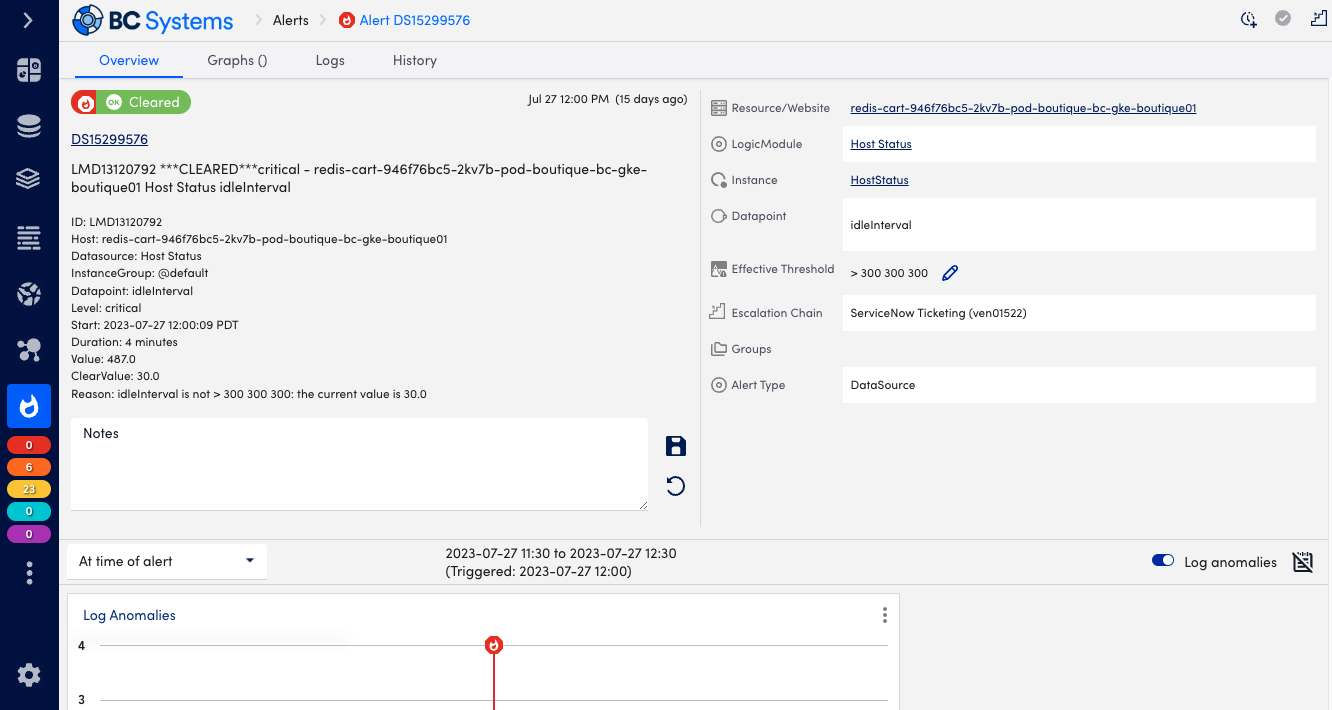
- Explore the issue timeline
- Look at the timeline view in the right panel of the Details page.
- Investigate when the alerts started, the frequency, and impacted resources.
- In the panel at the bottom, look at the alerts and events associated with the insight.
- Analyze event details
- On the Events tab of the Details page, check Description to get some additional infrastructure and event context from the ServiceNow CMDB.
- Do a root cause analysis for the issue
- Based on the information you got from insight, alert, and event details, continue with a root cause analysis for the issue.
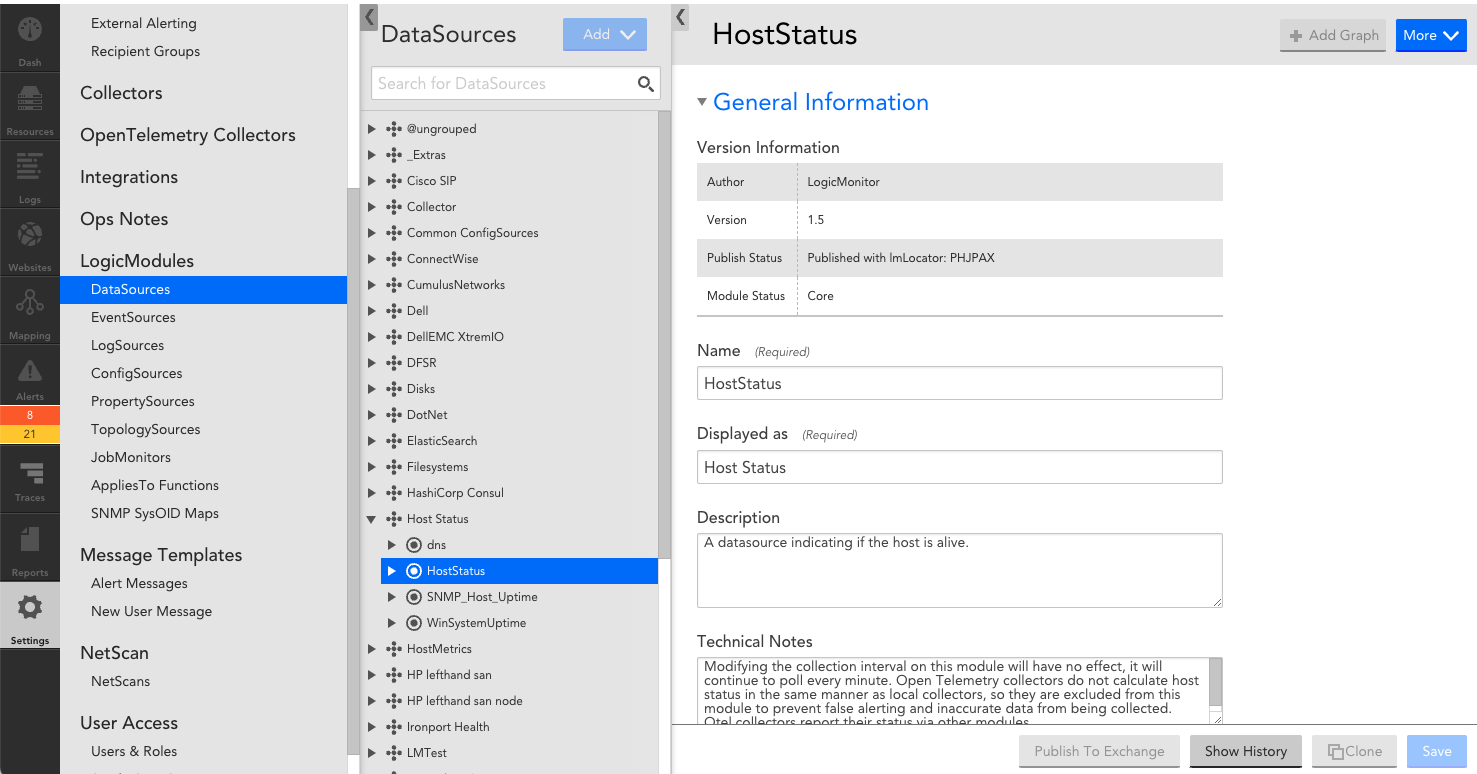
- Click CI to further investigate the state of the resource in your LM Portal.
- Click Name to investigate the datasource related to the issue in your LM portal.
- Click Source ID to further investigate associated alert information in your LM portal.
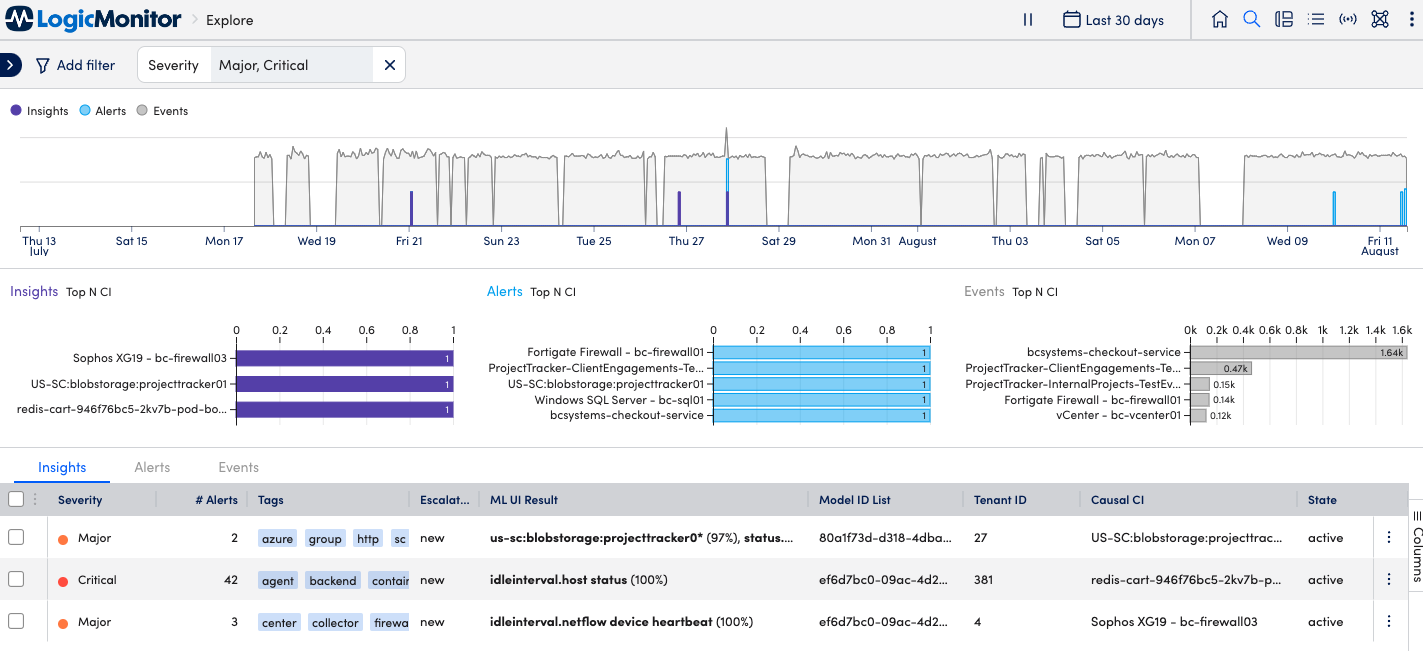
- To get more context and to understand the recurrence pattern for an issue, open the Explore page in Dexda.
- Look at the raw data stream from the data ingested by LM to see if you can identify patterns or anomalies over a specific time range for the issue you are investigating.
- Decide on next steps
- When you have identified the root cause, use the data you collected to decide on the next steps, for example to escalate the insight and create an incident.
- Right-click on an insight to manually create a ServiceNow incident. This can also be done automatically depending on your setup of Dexda.
- Keep monitoring
- Continue to monitor the Insight dashboard for changes in system metrics and new alerts.
- You can set up custom dashboard filters for example to monitor any changes that might indicate potential issues.