DynamoDB
Last updated on 27 March, 2023LogicMonitor currently has the following datasources for monitoring DynamoDB performance metrics:
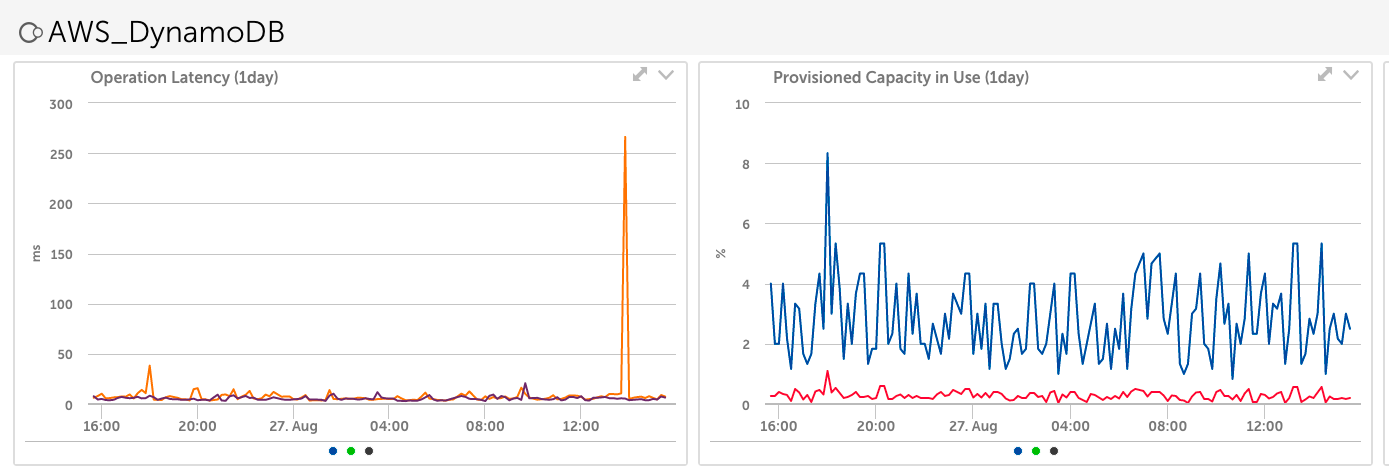
- AWS_DynamoDB – reports DynamoDB statistics
AWS_DynamoDB
Source: CloudWatch
Datapoints:
- Consumed Read & Write Capacity
- Provisioned Read & Write Capacity
- Provisioned Read & Write Capacity Usage Percent
- Get, Put , Scan & Query Latency
- Reads & Writes per second
- Read & Write Throttles
- Read & Write Throttles per second
Default Polling Interval: 5 minutes. Note that 1 minute granularity is available for some metrics, and that the polling interval can be decreased to get this more granular data (though we suggest that you separate out the metrics aggregated at 1 and 5 minutes into different DataSources with different polling intervals if this is desired, to avoid extra polling CloudWatch when data is not available for the metrics aggregated at 5 minutes).
Additional Configuration Required?: No. This datasource will automatically apply to the DynamoDB instances discovered for your AWS account and start collecting data.