Alerts Thresholds Report
Last updated on 20 March, 2023Overview
The Alerts Thresholds report allows you to easily see the datapoint thresholds in effect across multiple resources, and shows you where you have overridden global thresholds or disabled alerting at levels other than the global level. You may find this report useful for reviewing:
- The various static and dynamic thresholds in place for a resource or resource instance
- Where global threshold defaults have been overridden by thresholds set at deeper levels in the Resources tree (resource group, resource, or instance level)
- How changes to a datapoint threshold affect other resources
- Which resources have alerting disabled (at the resource group, resource, instance or datapoint level)
Configuring an Alerts Thresholds Report
To configure an Alert Thresholds report, select Reports | Add | Report | Alerts Thresholds. A report dialog appears that allows you to configure various report settings.
Configuring Settings Common to All Report Types
The first four settings, along with the final setting, that are found in the report dialog (Title, Description, Group, Format, and Generate this report on a schedule) are universal to all report types. To learn more about these global report settings, see Creating and Managing Reports.
Configuring Alerts Thresholds Report Settings
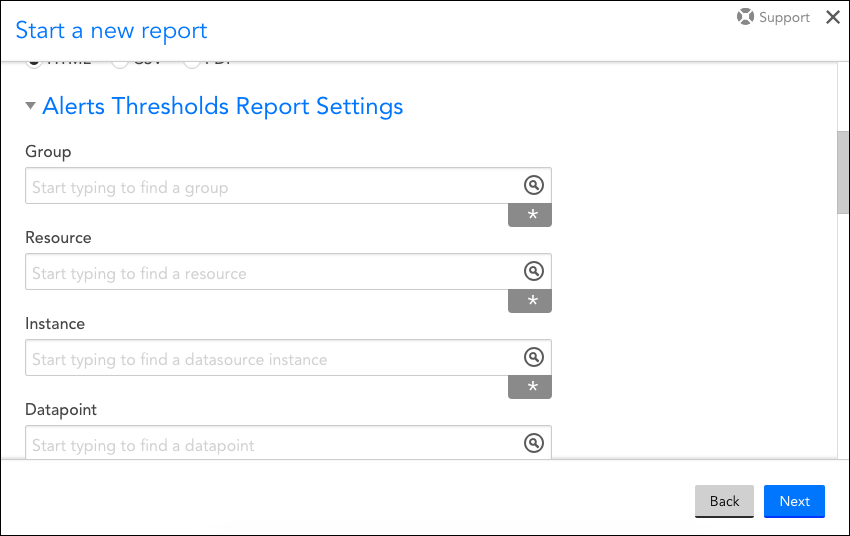
In the Alerts Thresholds Report Settings area of the report configuration dialog, shown and discussed next, specify settings particular to the Alerts Thresholds report.
Group
From the Group field, indicate the group that has resources for which you would like to view thresholds. You can use an explicit name or glob expression in this field, or you can wildcard the entire field to include all groups (i.e. not filter output by group). For more information on LogicMonitor’s support of glob, see Using Glob throughout your account.
Resource
From the Resource field, indicate the resource that has datapoints you would like included in the report. As with the Group field, you can use an explicit name or glob expression in this field, or you can wildcard the entire field to not filter the report’s datapoint threshold output by resource.
Instance
From the Instance field, indicate the instance that has datapoints you would like included in the report. As with the prior two configurations, you can use an explicit name or glob expression in this field, or you can wildcard the entire field to not filter the report’s output by instance.
Datapoint
From the Datapoint field, indicate the datapoint you would like included in the report. As with the prior three configurations, you can use an explicit name or glob expression in this field, or you can wildcard the entire field to include all datapoints that meet the prior configurations.
Sorted By
By default, your results will be sorted by resources, but you can use the Sorted By field’s dropdown menu to sort based on instance or datapoint instead. If “Datapoint” is the selected sorting method, note that the metric’s average is used for sorting.
Only Show Custom Thresholds
When checked, the Only show custom thresholds option limits the report output to only those thresholds whose values deviate from default global thresholds. The level (group or instance) on which these customized thresholds were set will also be displayed.
Note: If you’d like to generate this report for the purpose of highlighting all resources/instances across your portal for which custom dynamic thresholds have been set, check this option and wildcard the Group, Resource, Instance, and Datapoint fields. After running the report, sort the resulting output by the EffectiveThreshold column.
Columns
There are more than 15 columns of data that can be included in the report’s output; by default, LogicMonitor includes five of them. Uncheck those that you would like excluded from the report, and check any others that you would like included. To reorder columns, grab the icon to the far left of a column name and drag and drop the column into its new position.

