
Navigating the Resources Page
Last updated - 16 June, 2026
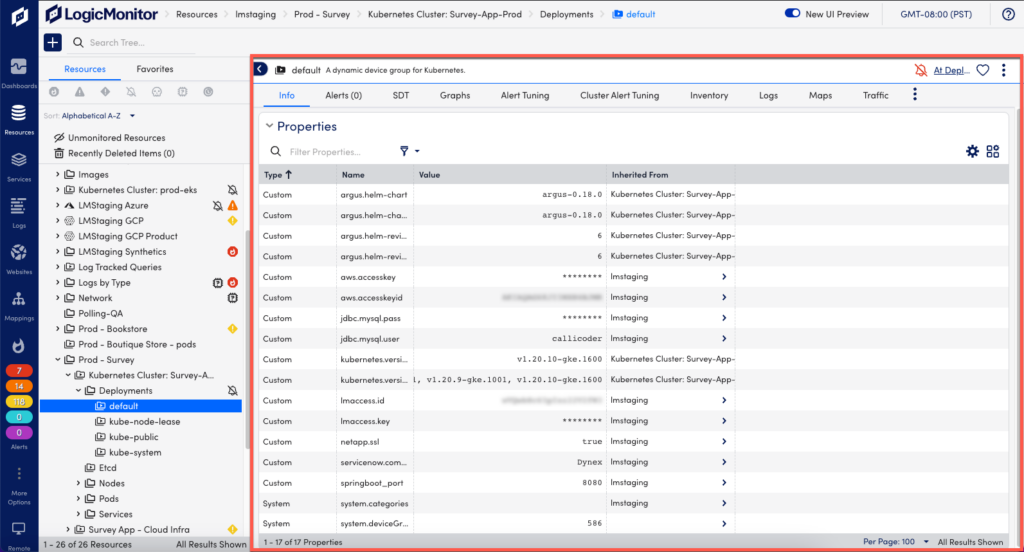
All of your monitored devices and cloud resources are managed from the Resources page. The Resources page consists of the Navigation Panel on the left and the Detail Panel on the right.
Note: If you haven’t added any devices to your account, see Adding Devices.
Navigation Panel
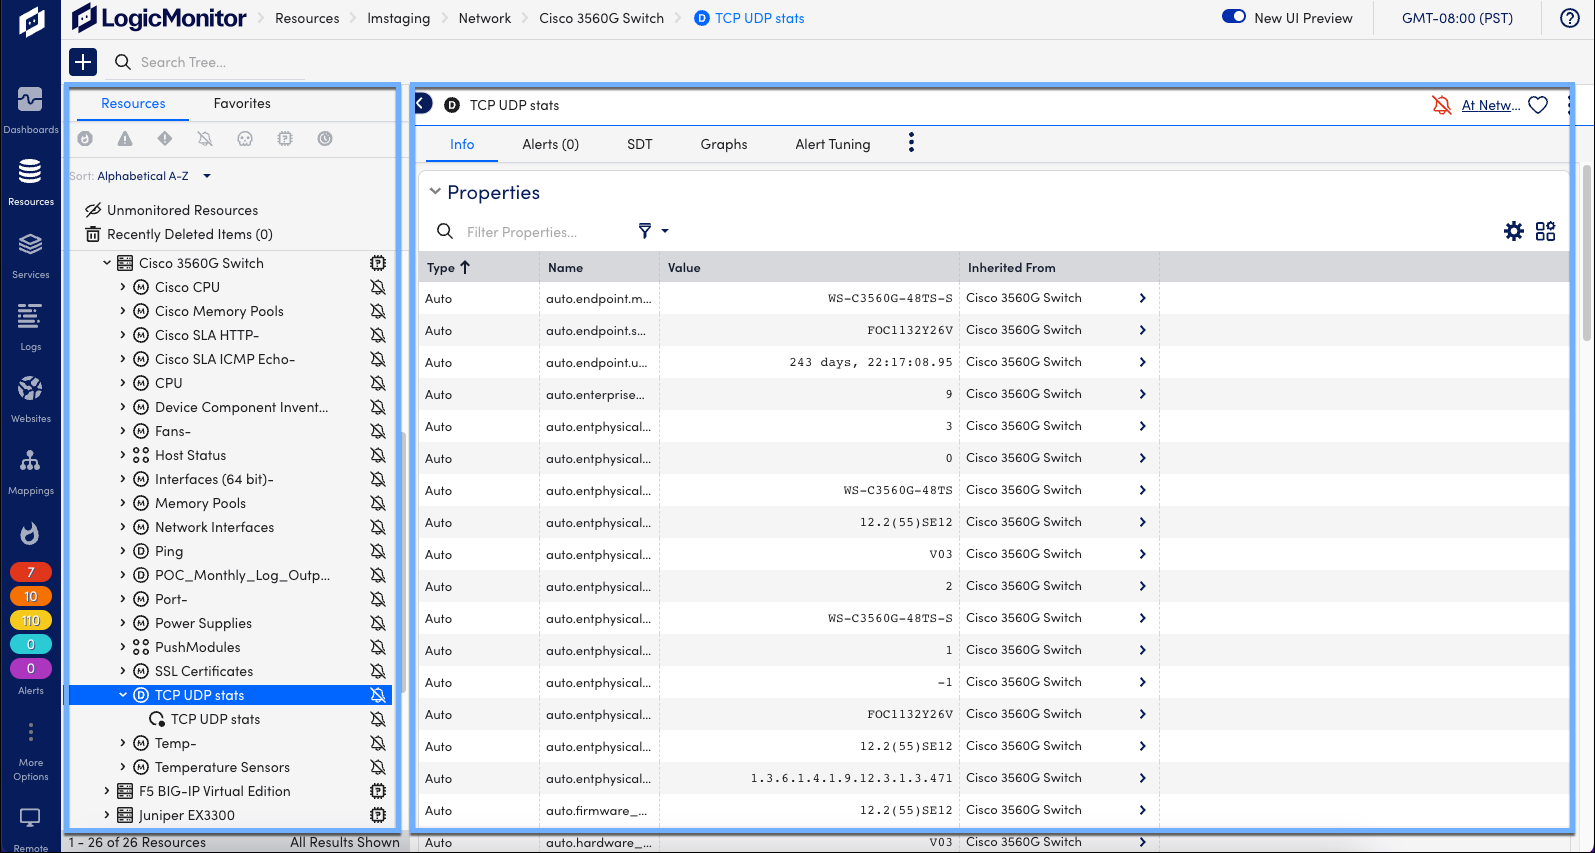
Resources are displayed in a Navigation Panel on the left side of the Resources page. The Navigation Panel has two views, represented by tabs:
- Resources— The device view, or Resources Tree, which displays your resources in a hierarchical, folder-based view.
- Favorites— Customized list of your most frequently viewed groups, hosts, cloud resources, DataSources, or instances.
Resources Tab
Use the Resources tab to search, navigate, and identify relationships between the resources in your LogicMonitor account.
- Search Tree to search for resources by keyword.
- Filter resources based on alert status, collector status, or scheduled down time status.
- Sort resources by Alphabetical A-Z, Alphabetical Z-A, or By Alert Severity.
Resources Tree Navigation
The following section describes some of the common navigation tools available in the Resources Tree.
| Element / Action | Description |
| Navigation arrows | Expands or contracts the resource in the Resources Tree. Resources in the Resources Tree can be expanded or collapsed like ordinary file folders. Using the right and down-facing arrows, you can open and close elements (groups, resources, or multi-instance DataSources) to view its contents. Note: Clicking a navigation arrow does not change the view in the Detail Panel. |
| Resource icon/name | Selecting the resource icon or name opens the resource in the Detail Panel. |
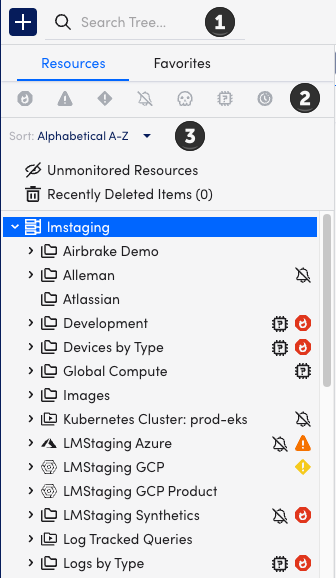
| Resize | The right border of the Resources Tree can be adjusted (drag) to widen or narrow the view. Widths between 300 and 1000 pixels are supported.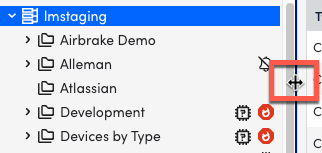 |
| Show or Hide | The Resources Tree is displayed by default. You can use the Hide Panel arrow to temporarily hide the Resources Tree. |
| Focus | To use the focus feature, hover over any group, device, or cloud resource. When you select it, the Resource Tree focuses only on the selected resource.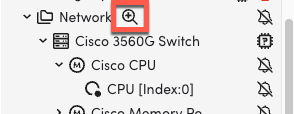 Select the focus again to reset the Resources Tree to the root level.  Select the back arrow to go back one level in the Resources Tree. 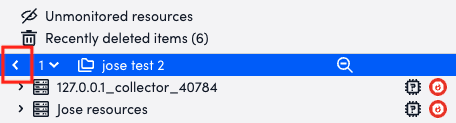 To navigate been levels, select which level you want to go to from the drop-down menu. 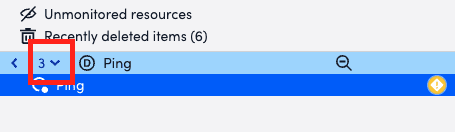 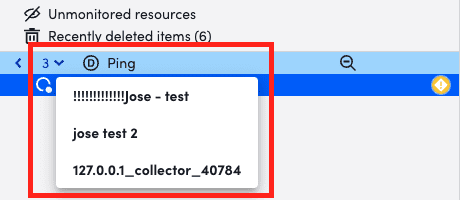 |
| Breadcrumbs | Breadcrumbs are provided at the top of the LogicMonitor window and offer an optional way to navigate your resources. The focus of the Detail Panel updates when you select a breadcrumb.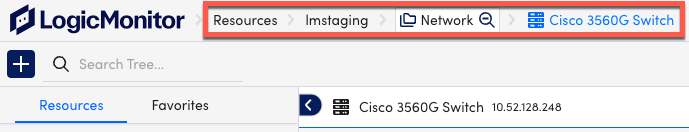 |
Search and Search Categories
You can limit your search results by specifying a search category. When you use a search category, only the resources for that specified category are returned. Resources that do not match the category are ignored.
Note: When searching a resource with a space in the name, use double quotes to contain the name (for example, “My Resource”).
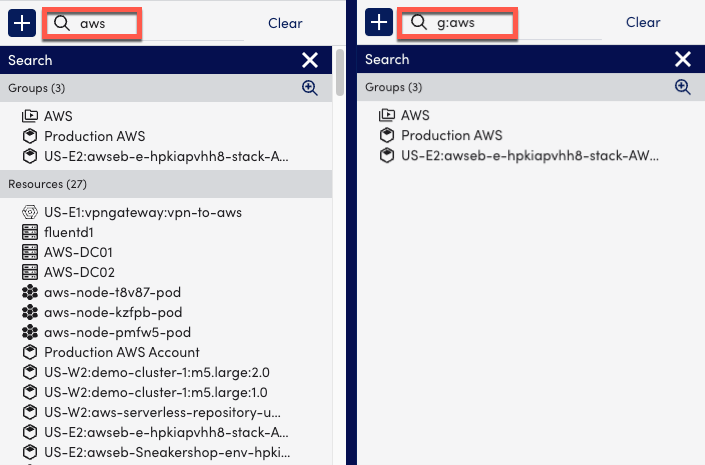
The following search categories are available:
| Search | Category | Description |
| Group | g: | Search group names for a keyword match. |
| Device | d: | Search device (resource) and cloud resource names for a keyword match. |
| DataSource | ds: | Search DataSource names for a keyword match. |
| Instance | i: | Search Instance names for a keyword match. |
Note: If you specify two or more keywords for the same category, the criteria will logically be interpreted with an OR. For example, g:DEV g:AWS will return device groups containing DEV or AWS in their names. If you specify two or more keywords for different categories, the criteria will logically be interpreted with an AND. For example, g:AWS ds:EBS will return DataSources that contain EBS in their names and are members of groups that contain AWS in their names.
Resource Status Filters
The following filters are available on the Resources tab:
| Icon | Description |
 | Critical |
 | Error |
 | Warning |
 | Disabled Alert |
 | Dead Resources |
 | Dead Collectors |
 | SDT Status |
Note: Filters are applied to the active view (focus) of the Resources Tree. For example, if the Resources Tree is currently focused on a single device group, only resources from that group are displayed.
Resource Types
An icon is displayed next to each resource to help identify the resource type (device, cloud resource, group, dynamic group, instance, or module). Hover over any icon in the Resources Tree to display its description.
| Icon | Description |
 | Root |
 | Group |
 | Dynamic Group |
 | Host |
 | Logic Module Group |
 | DataSource |
 | Instance |
 | AWS |
 | Azure |
 | GCP |
Note: To access Services resources, use the Services option on the LogicMonitor menu.
Change Group Membership
You can drag-and-drop resources or groups to change their group membership:
- Dragging a resource to a group adds the resource to that group.
- Dragging a group to another group creates a sub-group.
- Dragging a resource to another resource creates a new group that includes both resources.
Note: This functionality is not available for dynamic groups as dynamic group membership is automated and cannot be manually determined. For more information on device groups, see Device Groups Overview.
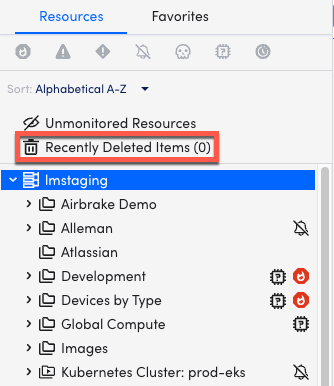
Unmonitored Resources
Unmonitored Resources displays the resources that have been added, but are not currently being monitored.
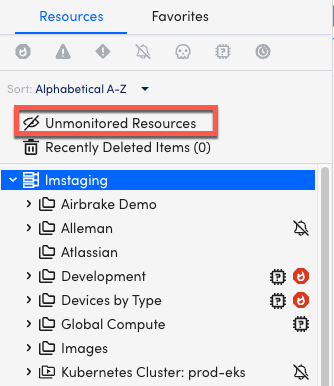
Recently Deleted Items
Deleted resources are shown in Recently Deleted Items. After seven days, the resource is permanently deleted and removed from Recently Deleted Items.
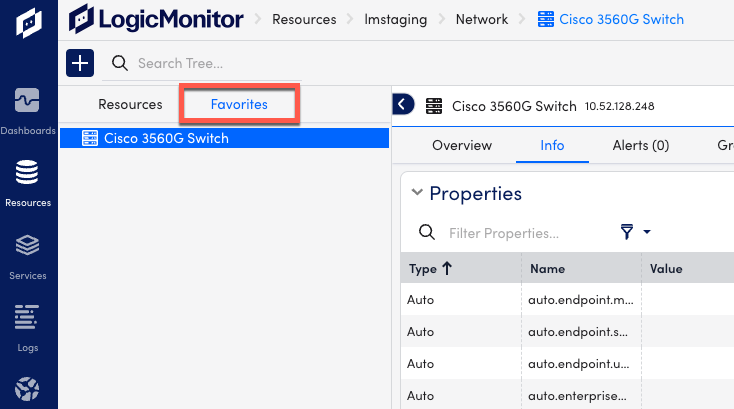
Favorites Tab
The Favorites tab in the Resources Tree is used to view and manage the resources that you visit frequently.
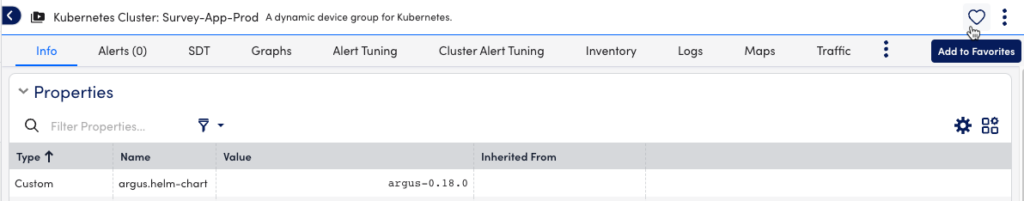
Add to Favorites
Favorites are added from the Detail Panel using the Add to Favorites icon. Once applied, the selected resource is displayed in the Favorites tab.
Detail Panel
The Detail Panel provides the detail view and functionality for the resource that is selected in the Resources Tree.
Detail Panel Tabs
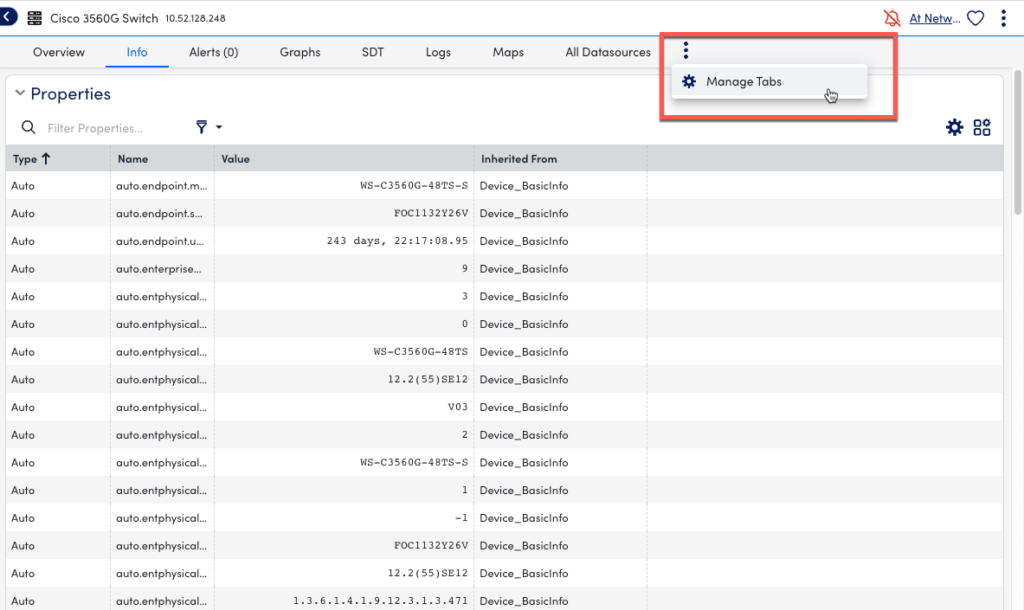
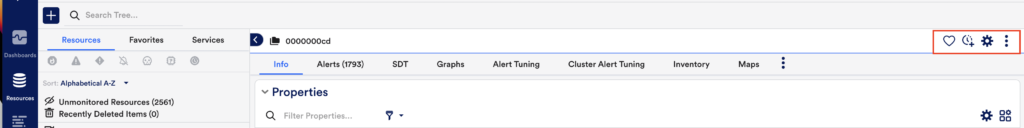
By default, the Detail Panel displays tabs based on the information included for the selected resource. The tabs displayed for a given resource will vary depending on the resource type. However, you can manage the tabs that are displayed for a given resource by using the Manage Tabs option. Manage Tabs allows you to show, hide, or reorder the tabs on the Detail Panel.
If you enabled Digital Experience, you can run a Digital Experience test from an alert to evaluate user impact and performance for the associated resource by selecting Test user impact. For more information, see Enabling Digital Experience in LogicMonitor.
Depending on the resource selected, the following tabs may be present:
| Tab Name | Description |
| Overview | Appears when a host resource is selected from the Resources Tree. It provides an at-a-glance view of uptime, DataSources, and associated graphs. |
| Info | Provides general information, such as group membership and properties. |
| Scheduled Down Time (SDT) | Displays completed, active, and pending SDTs that apply to the resource. At the group level, displays SDTs for subgroups, member resources, or member DataSources. At the instance level, displays SDTs for a parent resource or group. |
| Alerts | Shows a filtered view of the Alerts page, with active alerts only, for the selected resource. |
| Graphs | Displays graphs based on DataSource and Instance data. |
| Alerts Tuning | Provides a user interface for adjusting static thresholds or adding new static and dynamic thresholds to your datapoints (resource group or instance level). |
| Cluster Alert Tuning | Provides a quick insight into the overall state of a collection of devices or cloud resources. |
| Logs | Displays a summary listing, which can be filtered, for the logs associated with a resource. |
| Inventory | Displays all resources in a group. |
| Maps | Shows the relationships between the selected resource and other elements in your network. |
| Locations | Displays cloud services information by geographical location. |
| Traffic | Shows the flow of traffic over a NetFlow resource. |
| Instances | Displays multi-instance DataSources from the Resources Tree. |
| Raw Data | Provides all the data returned for the defined datapoints of an instance. |
| Matched Events | Shows messages that meet the test parameters and filters defined in the EventSource configurations. |
| JobMonitor Executions | Displays Scheduled At, Executed At, and Completed At details for alerts that are run against JobMonitor modules. |
| Configs | Provides a summary (list) of the ConfigSource instance versions. |
Detail Panel Functions
Depending on the Resource that’s selected, there are function buttons present on the Detail Panel.
Groups and Hosts
For Groups and Hosts, the following functions are present on the Detail Panel:
| Icon | Name | Description |
|---|---|---|
| Add to Favorites | Adds the selected resource to the Favorites tab. | |
| Schedule SDT | Opens the Confirm Your Actions window, where you can schedule downtime for a given DataSource. | |
| Manage | Opens the Manage window, where you can manage the name, description, and properties for the selected resource. | |
| Manage Resource Options | Depending on the resource that’s selected: At the group level, opens a menu that provides options to Disable Alert Generation and Set Preferred Logs Collector. At the host level, opens a menu that provides options to Add Monitored Instance, Add Additional Monitoring, Run Active Discovery, Force DataSource Re-Match, Start Remote Session, and Disable Alert Generation. |
DataSources and Instances
For DataSources and Instances, the following functions are present on the Detail Panel:
| Icon | Name | Description |
|---|---|---|
| Add to Favorites | Adds the selected resource to the Favorites tab. | |
| Schedule SDT | Opens the Confirm Your Actions window, where you can schedule downtime for a given DataSource. | |
| Manage | Opens a menu that provides options to Manage Resource, Add Monitored Instance, Add Additional Monitoring, Run Active Discovery, Force DataSource Re-Match, Start Remote Session, and Disable Alert Generation. | |
| Manage Resource Options | Depending on the resource that’s selected: At the DataSource level, opens a menu that provides an option to set Global Definition. At the Instance level, opens a menu that provides options to Disable Alert Generation, Stop Collecting, and to set Global Definition. |
