Disclaimer: This content applies to the legacy UI and is no longer maintained. It will be removed at a future time. For up-to-date content, see Resource Metric Trends Report. At the time of removal, you will automatically be redirected to the up-to-date content.
Resource Metric Trends Report
Last updated - 25 July, 2025
Overview
The Resource Metric Trends report can display minimum, maximum, average, change, and sum values for any metric (datapoint) that is available for a resource (e.g. device, cloud resource) or group of resources. This information is presented in a tabular data format and can additionally include graphs per resource, DataSource or datapoint. Because the flexibility of this report allows you to view graphs and numerical data for multiple resources, you may find it useful for quickly reviewing recent performance metrics across a group of resources.
Note: If you’re looking for a report on CPU trends for a group of devices, consider creating the Server CPU report instead.
Configuring a Resource Metric Trends Report
To configure a Resource Metric Trends report, select Reports | Add | Report | Resource Metric Trends. A report dialog appears that allows you to configure various report settings.
Configuring Settings Common to All Report Types
The first four settings that are found in the report dialog (Title, Description, Group, and Format), along with the final setting (Generate this report on a schedule), are universal to all report types. To learn more about these global report settings, see Creating and Managing Reports.
Configuring Resource Metric Trends Report Settings
In the Resource Metric Trends Report Settings area of the report configuration dialog, shown and discussed next, specify the metrics you would like to track, as well as the resources for which you would like to track them.
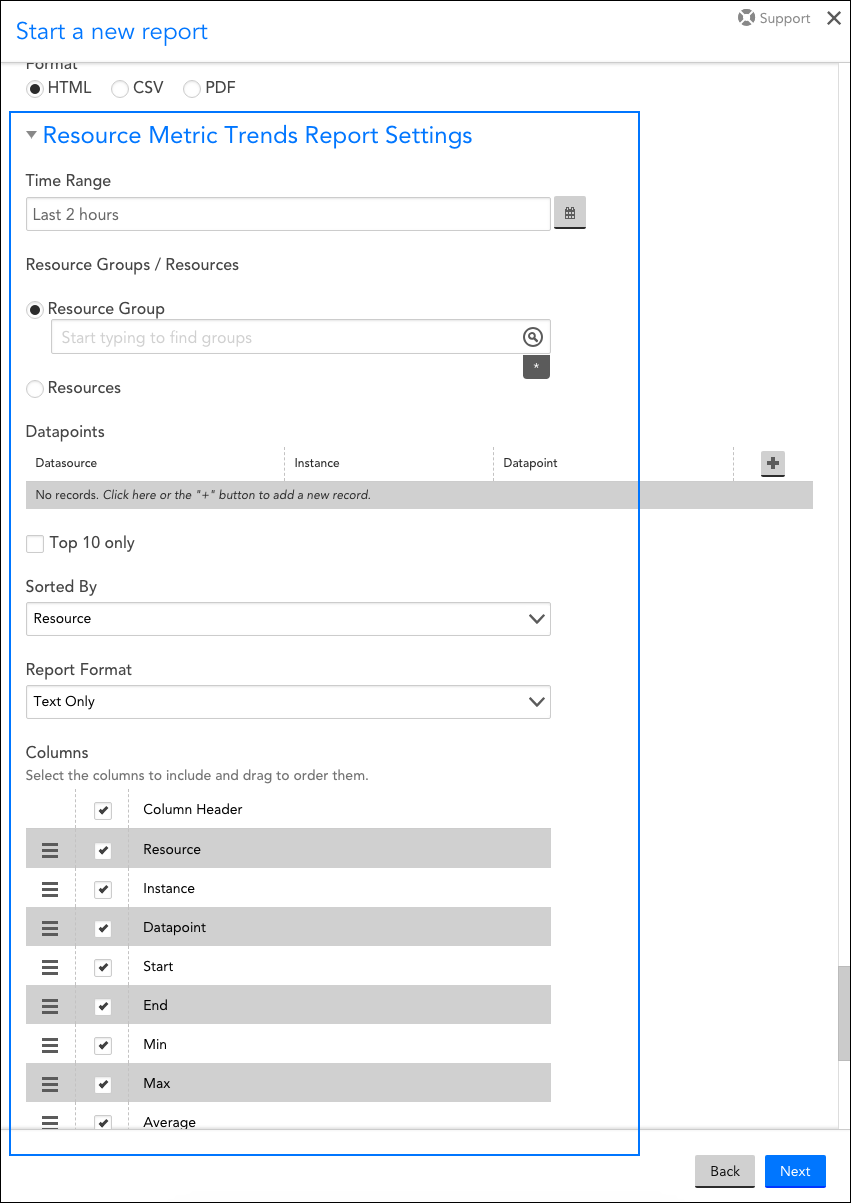
Resource Groups / Resources
From the Resource Groups or Resources field, limit the resources to which this report will apply by designating one or more resource groups or resources. You can use explicit names or glob expressions in these fields.
Note: Multi-glob lookup is available in this field. You can select a combination of both glob and distinct values to specify your resources/resource groups. For more information on LogicMonitor’s support of glob, see Using Glob throughout your account.
Datapoints
Define the datapoints to include in your report. These datapoints will be pulled only from the resource(s) you specified in the previous field.
You can enter datapoint calculations into the Datapoint field, for example: InOctets*8/1000/1000. This is helpful when want to convert the units of your collected data, without defining a datapoint definition.
Top 10 only
Check this option to limit the report’s results to the top ten values.
Scale by units of 1024
By default, the graph is scaled by units of 1000. For certain types of reports, such as storage capacity in bytes, you may want to check this option to scale the units by 1024.
Sorted By
By default, your results will be sorted by resources, but you can use the Sorted By field’s dropdown menu to sort based on instance or datapoint instead.
Report Format
Select whether the report should be text only or include embedded graphs (e.g. one graph per resource, DataSource, Instance, or datapoint).
Columns
Uncheck any columns that you would like to exclude from the report. The columns included in the report determine the types of values (e.g. minimum, maximum, average, etc.) that display for datapoints. To reorder columns, grab the icon to the far left of a column name and drag and drop the column into its new position.
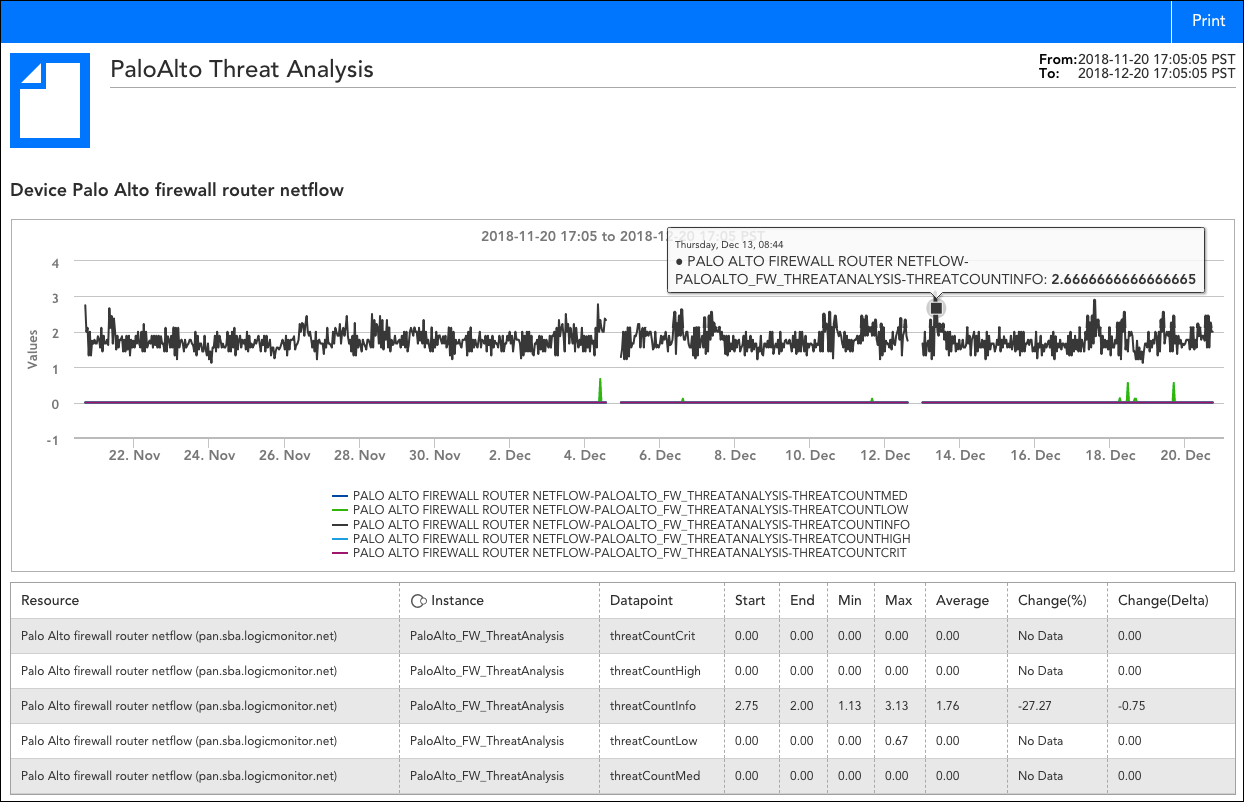
Sample Output