
Mapping Page
Last updated - 25 April, 2019
Overview
FEATURE AVAILABILITY: LogicMonitor Pro and Enterprise
The Mapping page is the heart of LogicMonitor’s topology mapping capabilities. From this page, topology maps are created, managed, and added to dashboards as Topology Map widgets. As discussed in Topology Mapping Overview, the visual context that LogicMonitor’s topology maps provide can be very beneficial to your monitoring operations, providing you with the ability to:
- Visualize and navigate resources based on topology relationships
- Troubleshoot alerts within your infrastructure on a topology map
- Discover and map relationships between resources
- Save relevant and frequently-used topology maps for monitoring continuity
- Generate topology maps based on alerts to streamline your troubleshooting workflow
Note: In addition to rendering topology maps on the Mapping page, you can also render maps from the Resources page. These maps are more limited in scope, reflecting the relationships that the current selected resource has with other elements in your network. For more information on the Maps tab, see Maps Tab.
Creating and Saving Topology Maps
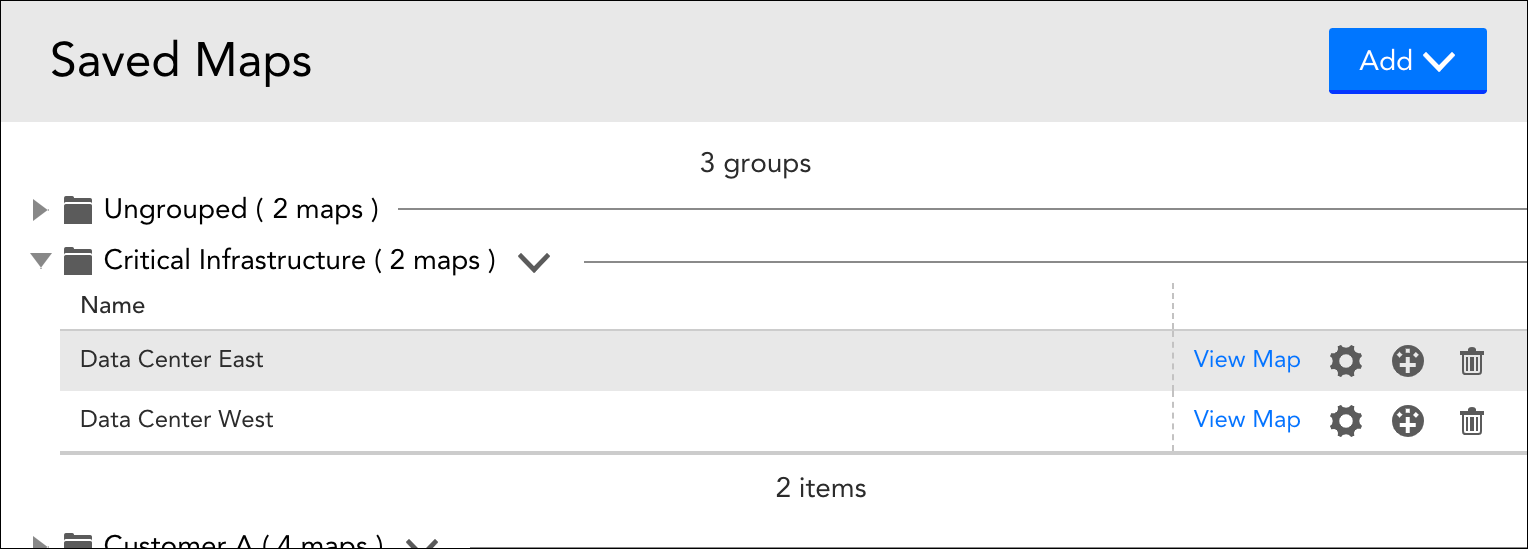
Upon arriving at the Mapping page (available from the main left-hand navigation menu), you are initially presented with a listing of saved maps, organized by map group. As shown next, expanding a group allows you to view, edit, or delete its member topology maps, as well as add them to dashboards as Topology Map widgets. This Saved Maps area is also the launching point for the creation of new topology maps.
Creating Topology Maps
When you first create a topology map, you are presented with an empty canvas. This canvas can be populated with whatever meaningful context you are seeking. LogicMonitor follows the additive approach to establishing context; users start with the smallest subset of information required to begin exploring an issue and expand outward as necessary.
Note: If you believe that resources are inaccurately displaying on your topology map, see the troubleshooting section of Topology Mapping Overview.
To create a topology map:
- From the Saved Maps area of the Mapping page, select Add | New.
- Click the plus sign (+) icon in the upper left corner of the empty map canvas to designate a resource to render as a vertex in the topology map.
Note: Only resources with assigned external resource IDs (ERIs) are available for insertion here.
- Right-click on your newly-added vertex, and, from the context menu that appears, choose to additionally display its incoming and/or outgoing relationships, as auto-discovered by LogicMonitor. As shown next, each added relationship consists of a second vertex, connected to the first vertex by an edge.
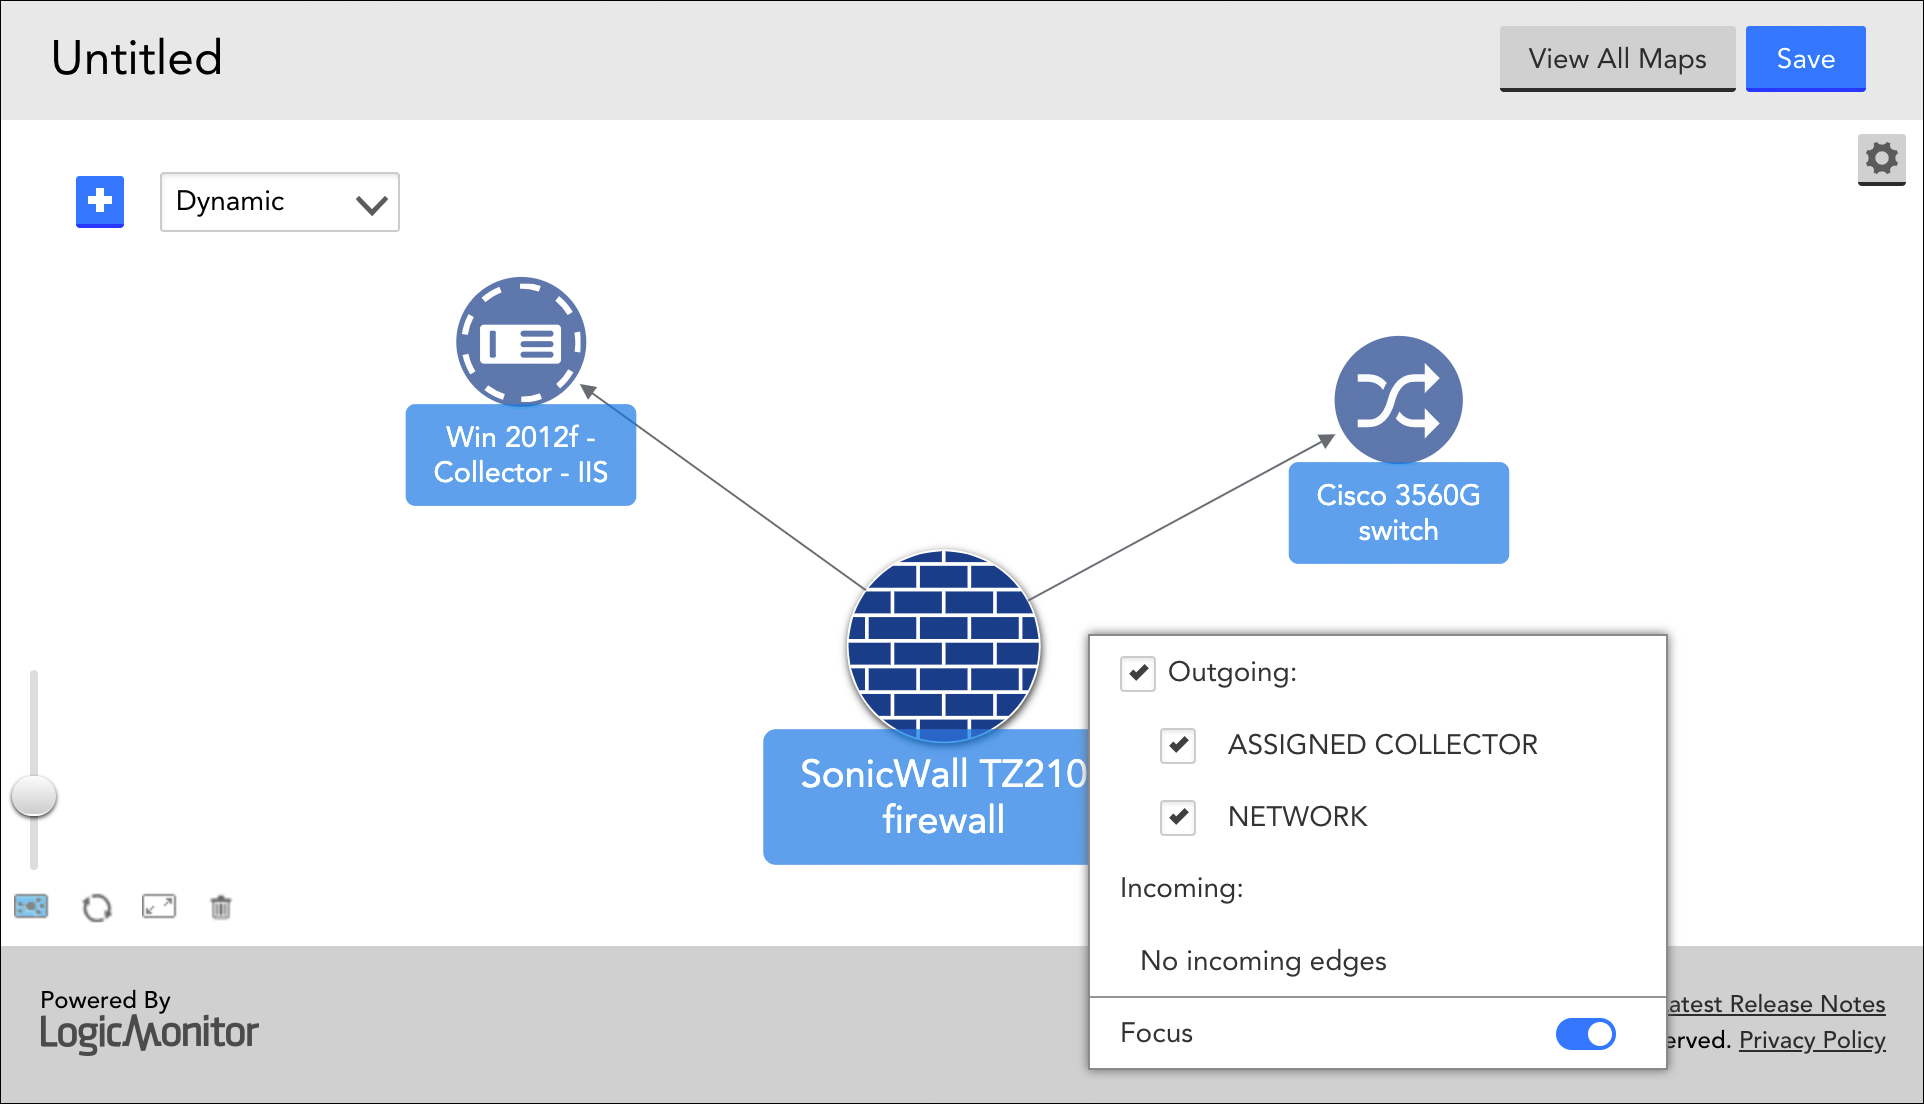
Any vertex can be expanded in this ad-hoc way, allowing you to traverse relationships across your network environment indefinitely.
- If you’d like to repeatedly access this topology map or add it to a dashboard, click the Save button at any point during the map building process to save it. As discussed in the Saving Topology Maps section of this support article, there are several configurations that must be established upon first save.
Each vertex on your topology map is designated with an icon. This icon denotes its type, which is determined by the external resource type (ERT) assigned to the resource.
![]()
Vertex icons, organized by resource type categories.
Display Tools
As you build your topology map, there are several features available for customized viewing and display:
- Hover for additional details. Hover over a vertex to bring its display name to the forefront (helpful on crowded maps with overlapping display names). Hover over an edge to display its edge type (i.e. name).
- Drag vertices or entire map. Any vertex can be dragged to a new location on your topology map with a simple drag and drop operation. In addition, multiple vertices can be dragged at once. To drag multiple vertices: (1) position the cursor in approximation to the desired vertices and hold down a left click until the cursor becomes a plus sign; (2) with the click still held, draw a box that encompasses all the vertices you would like to move; (3) click any one of the vertices that you drew a box over to drag all selected vertices to a new location.
The entire topology map can be repositioned on the canvas by grabbing and dragging any point of white space.
- Right-click edges. When multiple edges connect two vertices, the default behavior is to collapse those edges into a single edge for cleaner viewing. However, you can right-click on a collapsed edge to show all edges between two vertices. (There is also the option to override this default behavior from a map’s settings using the Display All Edges option.)
- Enable/disable focus state. Generally speaking, switches and other types of networking equipment are the “focus” of the topology map, with other types of vertices emanating from them. But you can enable or disable the focus state of any vertex by right-clicking on it and, from the context menu that appears, toggling the Focus slider. A vertex with an enabled focus state is designated by a blue icon; black indicates a disabled focus state. When disabling focus, all edges emanating from a vertex will disappear. If the unfocused vertex has no edges emanating from it, it will disappear as well.
- Fit to screen. When activated, the fit to screen icon, found in the bottom leftmost corner of the map canvas, automatically adjusts map magnification to keep your entire topology map in full view, at its biggest size possible.
- Zoom. The zoom slider, also found in the bottom left corner, lets you manually zoom in and out. The zoom slider will override fit to screen mode if enabled. Zoom is also possible by using two fingers on a trackpad.
- Rearrange elements. The rearrange elements icon returns vertices and edges back to their original positions on the canvas, in respect to the given layout. It also recenters the topology map.
- Fullscreen. Click the fullscreen icon in the bottom left corner of the map to activate fullscreen mode. All other icons are cleared from view until the fullscreen icon is clicked again.
- Clear canvas. The trash can icon, found in the lower left corner, clears the canvas when viewing existing topology maps or building new ones. It does not permanently delete a saved map.
- Settings available upon save. As discussed in the following section, there are also several display configurations that can be set when you save a topology map.
When you open or begin building a topology map, it reflects up-to-date relationship information. Refreshes occur with each Collection interval, as specified in the TopologySource. In the event that a Collector contributing to the topology map goes down, the relationships are not lost; rather, they are cached until the Collector comes back online—and then updated if any changes occurred while the Collector was offline.
For background on the many components that make up—and make possible—topology maps (e.g. vertices, edges, ERTs, ERIs, etc.), see Topology Mapping Overview.
Saving Topology Maps
If you’d like to repeatedly access a topology map or add it to a dashboard as a widget, click the Save button at any point during the map building process to save it. Upon first save, there are several configurations to establish. Once these configurations are established, LogicMonitor returns you to the map canvas so that you can continue building the topology map if desired.
To save a topology map:
- From the map canvas, click the Save button.
- From the Map Settings dialog that appears, enter a name and description for your topology map.
- In the Group field, enter the name of the group in which your topology map will be organized. LogicMonitor only allows you to select a group previously created; if you do not select a group, your topology map will be assigned to the default “Ungrouped” group.
- From the Layout field’s dropdown menu, select an organizing structure for the topology map’s layout:
- Hierarchical. This is the default layout. In this layout, vertices are organized in a top-down tree-like structure.
- Horizontal. The horizontal layout is essentially the hierarchical layout rotated ninety degrees counter-clockwise. Relationships flow left to right.
- Dynamic. This is a force-directed layout algorithm. Vertices repulse each other and edges act as “springs” to pull them together.
- Radial. The radial layout positions vertices in a circle that emanates from a starting center vertex.
- By default, a vertex’s alert status, assuming it is currently in active alert, displays as a small icon overlay. This allows you to more efficiently troubleshoot alerts within your infrastructure. However, alert status display can be disabled for a saved topology map by toggling the Show Alert Status slider to the left.
- By default, when multiple edges connect two vertices, the default behavior is to collapse those edges into a single edge for cleaner viewing. You can override this default behavior to always display all edges by toggling the Display All Edges option to the right.
- Click the Save button. Once saved, a topology map can be cloned (available from its settings) or, as discussed in the Adding Topology Maps to Dashboards section of this support article, added to dashboards as a Topology Map widget.
Open Relevant Alerts and Resources from Topology Maps
Topology maps offer convenient methods of portal navigation, allowing you to quickly gather additional context.
Open Relevant Alerts
By default, topology maps identify the alert status of all mapped resources. This is key to troubleshooting alerts and identifying when a series of events are related to the same root cause.
As shown next, if an alert icon is associated with a resource in your topology map, you can click the alert icon to open a complete list of active alerts for that resource.
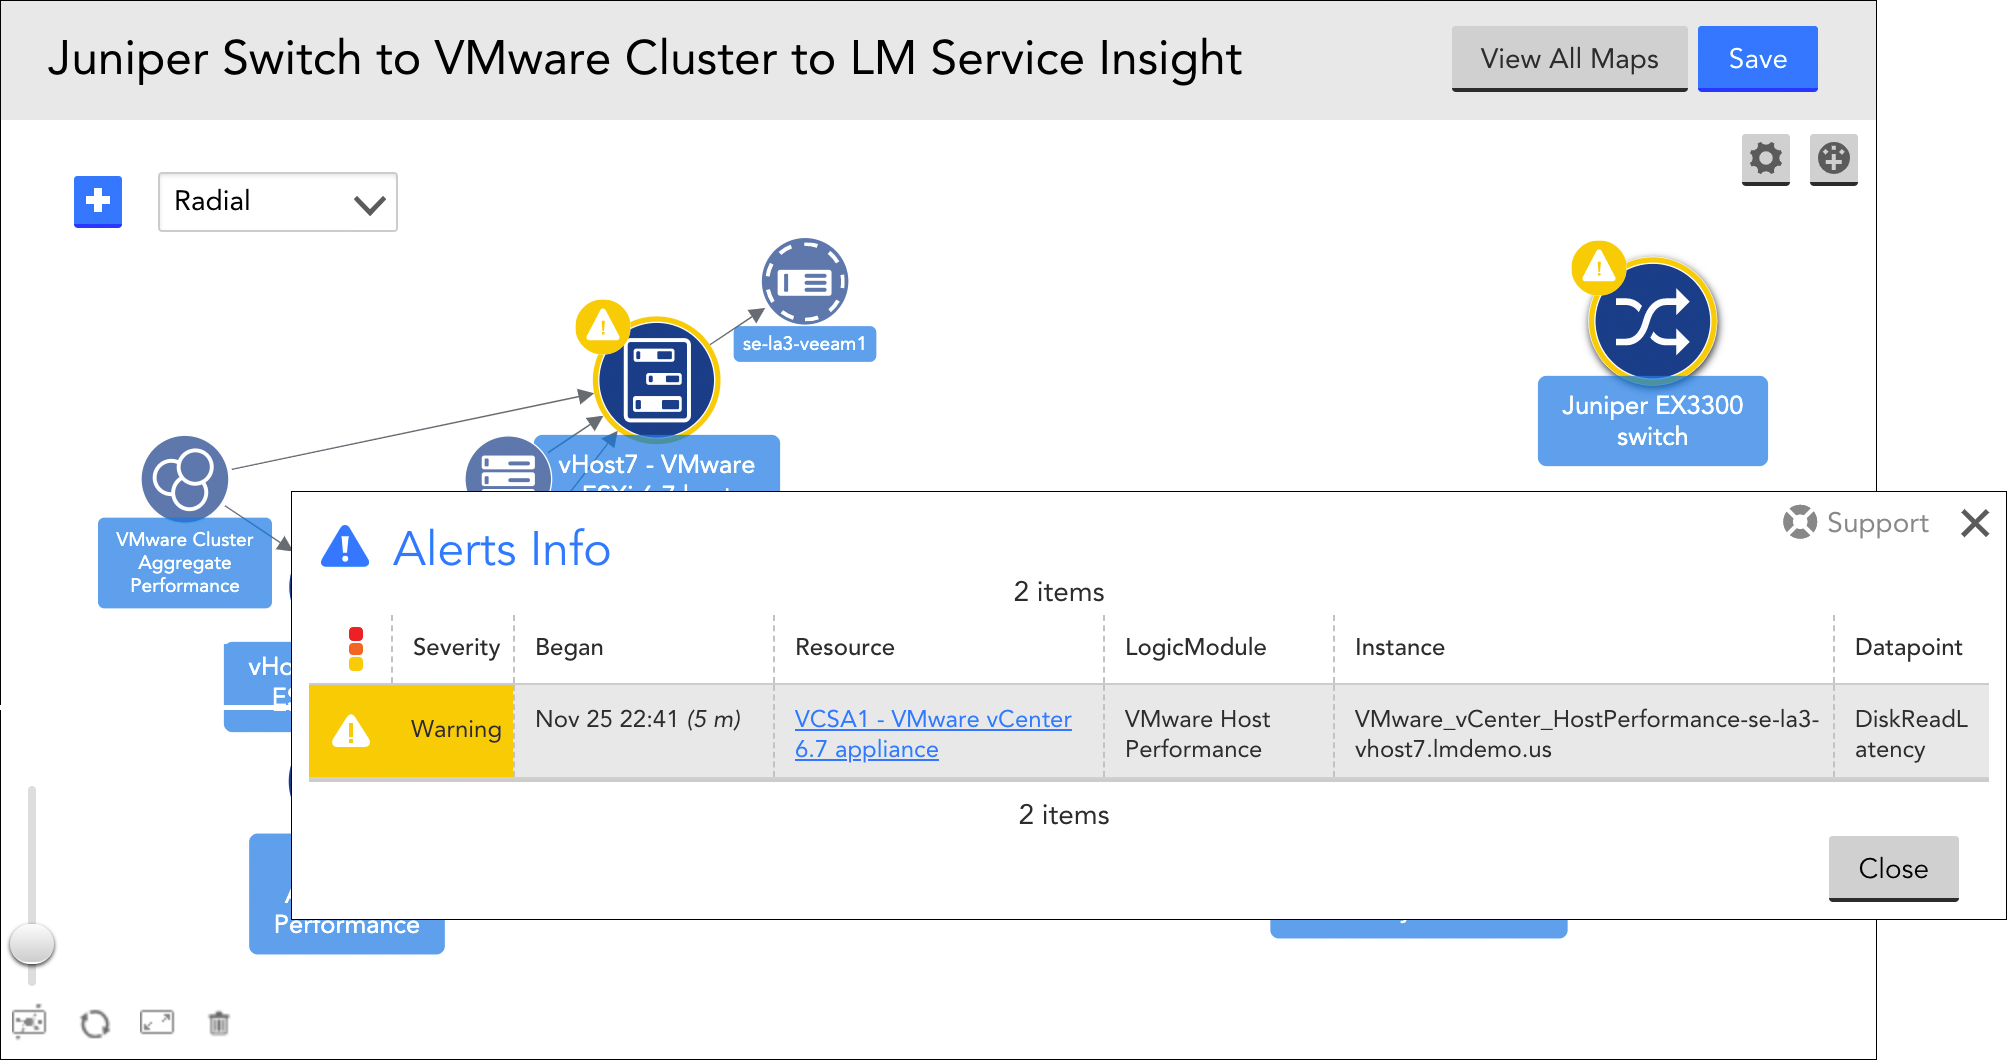
Note: Not only can you generate a list of relevant alerts from a topology map, but you can also generate a relevant topology map from an individual alert on the Alerts page, as discussed in Managing Alerts from the Alerts Page.
Open Resources
Double-click any vertex on a topology map to navigate directly to the resource it represents. The Resources page will open in a new browser tab with the resource in focus on the Maps tab.
Adding Topology Maps to Dashboards
Saved topology maps can be added to dashboards as Topology Map widgets. This functionality is available by clicking the add to dashboard (  ) icon from either the Saved Maps area of the Mapping page or the map canvas itself. For more information on Topology Map widgets, see Topology Map Widget.
