Release Note


-
LogicMonitor Platform
- Introduction to LogicMonitor
- In-App Resources
-
Account Information
- Portal Information
- Portal Settings
- Financial
-
Usage Reporting
- Usage Reporting Overview
-
Product-Specific Usage Reporting
- Usage Reporting for APM Metrics
- Usage Reporting for LM Logs
- Usage Reporting for SaaS Monitoring
- Usage Reporting for IaaS Monitoring
- Usage Reporting for PaaS Monitoring
- Usage Reporting for APM Traces
- Usage Reporting for APM Synthetics
- Usage Reporting for Devices
- Usage Reporting for Websites
- Usage Reporting for Wireless Access Points
- Audit Logs
- Ops Notes
- Security Settings
- User Access
- Collectors
-
Dashboards
- Dashboards Overview
- Dashboard Creation
- Modern Dashboards
- Adding Dashboard Groups
- Finding Dashboards and Dashboard Groups
-
Widgets
- Widgets Overview
- Widgets Creation
- Widget Datapoint Configurations
-
Widget Types
- Alert List Widget
- Big Number Widget
- Netflow Widget
- NOC Widget
- Log Query Widget
- Pie Chart Widget
- Table Widget
- Text Widget
- Website Status Widget
- Custom Graph Widget
- SLA Widget
- Topology Map Widget
- Gauge Widget
- HTML Widget
- Job Monitor Widget
- Map Widget
- Resource Explorer Widget
- Recommendations Widget
- Billing Widget
- Widget Management
- Standard Widget Configurations
- Enabling Dashboard Text Widget Script Security
- Dashboard Management
- Dashboard Distribution
-
Resource Tree
- Navigating the Resources Page
- Changing the Time Range
- Remote Session
- Using Ops Notes
- Resources Details
- Resource Groups
- Resource Management
- NetScans
- Resource Explorer
- Services
- LM Uptime Overview
-
Websites
- Data Monitored for Websites
- Websites Page Overview
- Alerting on Websites Data
- Trace Route for Websites
-
Websites Management
- Websites Default Settings
- Web Check
- Ping Check
- Testing the Steps of a Web Check
- Creating a Website Dashboard
- Website Properties
- Website Management
- Executing Internal Web Checks using Groovy Scripts
- Web Checks with Form-Based Authentication
- Websites SDT
- Disabling External Website Testing Location Across your Account
- Understanding Website Status Codes
- Websites Groups
- Mappings
- Alerts
-
Reports
- Choosing a Report Type
- Creating a Report Group
- Shared Report Access
-
Report Types
- Alert Forecast Report
- Alert SLA Report
- Alert HealthCheck Report
- Alert Thresholds Report
- Alert Trends Report
- Alerts Report
- Audit Log Report
- Dashboard Report
- Interface Bandwidth Report
- Log Query Report
- NetFlow Resource Metric Report
- Resource Group Inventory Report
- Resource Inventory Report
- Resource Metric Trends Report
- Role Report
- SDT Inventory Report
- Server CPU Report
- Service Level Agreement Report
- User Report
- Website Overview Report
-
Modules
- Modules Overview
- Modules Installation
- Custom Module Creation
- Tokens Available in LogicModule Alert Messages
- Deprecated LogicModules
- Data Collection Methods
- Active Discovery
- Groovy Support
-
Module Configurations
- Types of Modules
- DataSource
- PropertySource
- AppliesTo
- SNMP SysOID Map Configuration
- JobMonitor
- ConfigSource
- TopologySource
- EventSource
-
LogSource
- LogSource Overview
- Configuring a LogSource
- Kubernetes Event Logging LogSource Configuration
- Kubernetes Pods LogSource Configuration
- Log Files LogSource Configuration
- Script Logs LogSource Configuration
- SNMP Traps LogSource Configuration
- Supported MIBs for SNMP Trap Translation
- SNMP Trap MIBs
- Troubleshooting MIBs to JSON Converter Utility Issues
- Troubleshooting SNMP Traps Issues
- Modules Management
- Access Groups for Modules
- Security
-
LM Logs
- LM Logs Overview
- Log Ingestion
- Log Processing
- Logs Partition
- Log Anomaly Detection
- Log Analysis
- Viewing Logs and Log Anomalies
- Reset Log Anomaly Detection
- Log Patterns
- Log Query Language
- Log Processing Pipelines
- Log Alert Conditions
- Logs Roles and Permissions
- LM Logs Usage Data
- Troubleshooting Logs
-
Cloud Monitoring
- Introduction to Cloud Monitoring
- Cloud Services and Resource Units
- Monitored Locations for Cloud Monitoring
- Cloud Monitoring using a Collector for Existing Cloud Resources
- Monitoring Utilized Cloud Service Limits
- Custom Event Integrations Setup
-
Amazon Web Services Monitoring
- AWS Monitoring Setup
- AWS Organizational Unit Monitoring Setup
- Using StackSets to Automate Role and Policy Creation
- AWS Billing Monitoring Setup
- CloudWatch Costs Associated with Monitoring
- Managing your AWS devices in LogicMonitor
- AWS Tag Usage in LogicMonitor
- AWS Cost by Tag Monitoring
- Active Discovery and AWS CloudWatch Metrics
- Customizing AWS CloudWatch DataSources
- Troubleshooting Custom AWS CloudWatch DataSources
- Microsoft Azure Monitoring
- Google Cloud Platform Monitoring
- MongoDB Atlas Monitoring
- Cost Optimization
- Cloud Data Collection with Poll Now
- SaaS Monitoring
-
Edwin AI
- Introduction to Edwin AI
- Key Concepts in Edwin AI
- Edwin AI Roles and Users
- Configure Edwin AI Dashboard
- Edwin AI Models
- Configure Edwin AI Actions
- Edwin AI Rules
- Working with Edwin AI
- Export and Import Edwin AI Configuration
-
Edwin AI Integrations
- Edwin AI Integrations Overview
- Edwin AI Integration YAML File
- Edwin AI Custom Integrations
- Edwin AI Monitoring Integrations
-
Edwin AI IT Service Management Integrations
- LogicMonitor Data Exchange (LMDX)
- Edwin AI Microsoft Dynamics Integration
- Edwin AI PagerDuty Integration
- Edwin AI Jira Server Integration
-
LM Integrations
- LogicMonitor Integrations Overview
- Navigating the Integration Page
- Communications Integrations
- Workflow Integrations
- Automation Integrations
- Custom Integrations for LogicMonitor
- Logs for LM Integrations
-
Container Monitoring
- About LogicMonitor Container Monitoring
-
Kubernetes Monitoring
- Support Matrix for Kubernetes Monitoring
- Kubernetes and LM Containers Key Concepts and Terms
- Kubernetes Monitoring Considerations and Required Permissions
- Resource Sizing for Performance Optimization and Tuning Recommendations
- LM Container Installation
- LM Container Upgrade
- LM Container Uninstallation
- Existing Configuration Migration
- Kubernetes Events and Pod Logs Collection
-
Resource Monitoring
- Monitoring Helm Charts Releases
- Kubernetes Core Components Monitoring
- Monitoring Kubernetes Clusters with kube-state-metrics
- Filtering Kubernetes Resources for Monitoring
- NGINX Ingress Controller Monitoring
- Kubernetes Certificates and cert-manager Monitoring
- Disabling Alerts on Kubernetes Resources
- Default Filtering for Kubernetes Resources
- Filtering Kubernetes Resources using Labels, Annotations, and Selectors
- Disabling Resources from Monitoring
- Retention of Deleted Kubernetes Resources using LM Containers
- Retaining Deleted Kubernetes Resources
- Advanced Configuration
- Monitor Supported Resources
- Topology for Kubernetes Cluster
- Kubernetes Cluster Monitoring as Non-Admin User
- Troubleshooting Kubernetes Monitoring
- Docker Monitoring
-
LM APM
- LM APM Overview
- Quick Steps to Setup LogicMonitor APM
-
Push Metrics
- Getting Started with Push Metrics
- Use Cases for Push Metrics
- About the Push Metrics REST API
- Ingesting Metrics with the Push Metrics REST API
- Python SDK for Push Metrics API
- .NET SDK for Push Metrics API
- Managing Resources that Ingest Push Metrics
- Rate Limiting for Push Metrics
- Updating Instance Properties with the Push Metrics REST API
- Updating Resource Properties with the Push Metrics REST API
- OpenMetrics Integration
-
Distributed Tracing
- Distributed Tracing Overview
- Application Authentication Overview
- Traces Page
- Application Instrumentation for LogicMonitor
- Trace Data Forwarding to LogicMonitor
- OpenTelemetry Collector for LogicMonitor Overview
- Synthetics
-
Monitoring Solutions
- Apache
- APC
- AI Monitoring
- Atlassian
- AWS
- Azure
- Broadcom
- Cato Networks
- Checkpoint
-
Cisco
- Cisco APIC Monitoring
- Cisco ASA/ASR
- Cisco Catalyst Center
- Cisco Catalyst SD-WAN Monitoring
- Cisco CUCM API Monitoring
- Cisco Device SNMP and NTP Configuration
- Cisco Firepower Chassis Manager Monitoring
- Cisco Firepower Threat Defense Monitoring
- Cisco Hyperflex Monitoring
- Cisco Intersight Monitoring
- Cisco IP SLA Monitoring
- Cisco ISE Monitoring
- Cisco Meraki Monitoring
- Cisco UCCX Monitoring
- Cisco UCS Monitoring
- Cisco UCS X Monitoring
- Cisco Unified Call Manager (CUCM) Monitoring
- Cisco VoIP Monitoring
- Cisco Wireless Monitoring
- Citrix
- Cohesity
- Common Config
- CommVault
- ConnectWise
- Couchbase Server
- Dell Technologies
- Email Service
- Extreme Networks
- F5
- FreeBSD
- Fortinet
- HPE
- IBM
- IMPI
- Infinidat
- Infoblox
- Java
- Jenkins
- Juniper
- Kemp
- Kubernetes
- Linux
- LogicMonitor
- LSI MegaRAID Controller
- Microsoft
- MongoDB
- NetApp
- Network Traffic Monitoring
- NTP
- Nutanix Systems
- OpenAI
- Oracle
- Palo Alto Networks
- Panzura
- Perfmon Access
- Pick
- Puppet
- Pure Storage
- Quantum
- RabbitMQ
- Redis
- Rubrik
- Ruckus
- SAP
- Slack
- SSL
- SNMP
- Sonicwall
- SumoLogic
- SwiftStack
- Ubiquiti
- Unomaly
- Varnish
- Veeam
- Versa SD-WAN
- Mobile
-
Developer
-
LogicMonitor REST API
-
REST API Overview
- Using LogicMonitor's REST API
- Migration to LogicMonitor REST API v3
- REST API Change Log
- REST API Authentication
- REST API Status Codes
- REST API Error Codes
- REST API Rate Limit
- REST API Troubleshooting
-
REST API v3
- REST API v3 Swagger Documentation
- LogicMonitor v3 SDK
- REST API Basic Filters
- REST API Advanced Filters
- Creating Services Using LogicMonitor REST API v3
- Delta Support for device/devices API
- Best Practices for Migrating to LogicMonitor v3 SDK
-
REST API v3 Endpoints
- Managing Alerts
- Managing Alert Rules
- Managing Cost Optimization Recommendations
- Managing Recipient Groups
- Managing Roles
- Managing Ops Notes
- Managing Report Groups
- Managing Dashboard Groups
- Managing Collector Groups
- Managing ConfigSources
- Managing EventSources
- Managing Collector Debug Command
- Managing Collector Version
- Managing NetScan
- Managing PropertySources
- Viewing Metrics
- Viewing Integration Audit Logs
- Viewing External APIs
- Managing AppliesToFunction
- Managing Devices
- Managing DataSources
- Managing Escalation Chains
- Managing API Tokens
- Managing DataSource Instances
- Managing Dashboards
- Managing Users
- Managing Audit Logs
- Managing Data
- Managing Access Group
- Managing OIDs
- Managing Device Groups
- REST API v2
-
REST API v1
- REST API v1 Overview
- Getting Data with the REST API
-
REST API v1 Endpoints
- Managing Alert Rules
- Managing Alerts
- Managing API Tokens
- Accessing Audit Logs
- Managing Collectors
- Managing Collector Groups
- Managing Dashboards and Widgets
- Managing Dashboard Groups
- Managing DataSources
- Managing DataSource Instances
- Managing Devices
-
Managing Device Groups
- About the Device Group Resource
- Add a Device Group
- Add Device Group Properties
- AWS Device Groups
- Azure Device Groups
- Delete Device Group Properties
- Delete a Device Group
- GCP Device Groups
- Get all alerts for a Device Group
- Get all SDTs for a Device Group
- Get Device Group Properties
- Get Device Groups
- Get devices for a particular device group
- Update a Device Group
- Update Device Group Properties
- Managing Escalation Chains
- Managing Ops Notes
- Managing Reports
- Managing Report Groups
- Managing Roles
- Managing SDTs
- Managing Websites
- Managing Website Groups
- Getting Websites Test Locations
- Managing Thresholds
- Managing Users
-
REST API Overview
- Scripting Support
- HAR File in LogicMonitor
-
LogicMonitor REST API
- Policies and Compliance
- Training and Education
-
Legacy UI
- Getting Started
- Devices
- Dashboards and Widgets
- AIOps
- LM Service Insights
- LogicModules
- Terminology and Syntax
- LM APM
-
Cloud Monitoring
-
Getting Started with LM Cloud
- LM Cloud Monitoring Overview
- Enabling Cloud Monitoring using Local Collector
- Visualizing your cloud environment with auto dashboards and reports
- Setting up custom event integrations
- Monitoring Cloud Service Limit Utilization
- Optimizing your Cloud Spend
- Cloud Data Collection
- Amazon Web Services Monitoring
- Google Cloud Platform Monitoring
- MongoDB Atlas Monitoring
-
Getting Started with LM Cloud
- Container Monitoring
- Monitoring Solutions
In this article
We’re in the final stretch of January and already preparing to roll out our second release of 2018. You will notice several major improvements in this release, including: dashboard group import/export and improved session timeout logic.
v.100 will be released through the first week of February.
Importing/Exporting Dashboard Groups
We are excited to introduce the ability to import and export dashboard groups! With v.97, we enabled you to export a dashboard as a JSON file to facilitate dashboard sharing across LogicMonitor accounts. Now, you can export entire dashboard groups (up to 500 dashboards) as a single JSON file! Look for the “Export” button in the Manage Group dialog.
Login Session Timeout
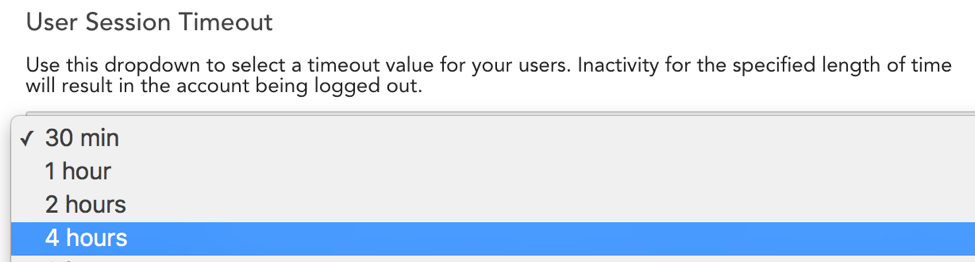
You can now customize the timeout duration in the Account Information | Portal Settings page by selecting from a dropdown menu with the following options: 30 minutes, 1 hour, 2 hours, 4 hours, 8 hours, 1 day, 7 days, and 30 days. By default, login sessions will now timeout after 4 hours of user inactivity. Please review the support documentation for more details about this feature and how it relates to Single Sign-On and Wall TV use cases.
Other Improvements
Collector
- Collector version 26.001 is released as a fix to 26.000. A bug in 26.000 could cause some performance issues
- With Collector version EA26.100, the Windows Collector installer will be signed upon download for improved security and less confusion on prompts when downloading and installing
Dashboards
- The header row will now remain visible when scrolling through the Table Widget
- Improved formatting of the NOC Widget to reduce empty space and maximize the amount of text that can be displayed per item. We also added an option to hide item type icons (group, device, instance, etc) to free up additional space. Look for the checkbox labeled “Show item type icons” in the widget configuration dialog
- Dashboard Groups and their contents can now be deleted at once. This allows easy deletion of several dashboards.
- The “description” field for Dashboards will now be included in the email when shared
- You can now use “*” to quickly add all dashboards within a group to a dashboard slideshow instead of adding each desired dashboard individually
- Added an Export button to the Manage Dashboard dialog
- When creating virtual datapoint expressions, we will show an error when attempting to combine datapoints across DataSources. Virtual datapoint expressions in widgets can only contain datapoints from the same DataSource
- Minor improvements to the Table Widget’s UI
Devices
- Added a system.instanceDescription property to all instances. This can be used in reports or retrieved via the instanceProps.get() Groovy method in a DataSource
- In Group selection fields, the root group will be indicated with “(root)” appended to the name to help differentiate it from others. This is especially helpful if you have created a group with the same name as your account, e.g. if your account is named “acme” and you create a group named “acme”, then the root will display as “acme (root)”
Integrations
- Improved AutoTask Integration’s handling of upper and lower case alert properties
- Integrations entries can now be cloned. To help protect your external environments, cloning will require re-entering authentication details for some of the integration types
LM Cloud
- LogicMonitor makes requests to get and update EBS volume properties via the EC2 API. We have improved the logic for making these requests in an effort to reduce the overall number of requests made
- Added monitoring support for AWS Elastic Beanstalk
- Corrected a bug by which spaces were not preserved in DataSource metric paths, as spaces are allowed in metric names via CloudWatch
LogicModules
- Minor change to restrict LogicModule pages and Services page to a minimum width. Narrowing the page too much prevented individuals from properly viewing data
- If a test script returns more than 2,000 characters, it will truncate the display and return a message indicating the truncation
Reports
- Creating a Report from the Audit Log will now include any user-specific filters that were applied to the Audit Log prior to clicking the Create Report button
- The “description” field of Reports will now be included in the email when shared
REST API
- Effective with this release, rate limits will be imposed for requests to LogicMonitor’s APIs. You can find more information about rate limits and how to work around them here for REST and here for RPC
- You can reference alerts via internal ids when adding a note to an alert
Service Checks
- There are some new SSL Monitoring features available for Services Checks. Collector version 26.200 is required to use these new features with Internal Service Checks. External checks from LogicMonitor’s data centers are fully supported
- We have added new functionality to the SSL Checks for Services. There is now the option to alert on SSL Errors, and a separate option to Halt or Continue with the Service Check if an SSL Error is found. This will allow for SSL related alerts to be generated for Service Checks, but the check will continue to determine if the service is functional beyond the SSL check. Currently, we use one Status datapoint to indicate either there is a Basic Service error or SSL errors. You will need to add another SSL Status datapoint to decouple the logic. Please note that only the first SSL certificate encountered will be evaluated
Settings
- Added “last 8 hours” and “last 12 hours” as pre-defined time ranges portal-wide
Bugs Fixed
- SAML logins no longer add entries to the Audit Log saying that an account has been “changed”
- Previously, if a user did not reset a password after clicking the auto-generated “reset password” link emailed to them, they would have to generate a new URL. Now, the original URL will be accessible until it expires or a new password is generated
- The “Test Permissions” option for AWS groups wasn’t always working correctly for the Elasticache service
- We corrected an error in the logic to auto-group Azure storage resources (e.g. table, queue, blob, file) with their storage account in which some non-storage type resources (eg VMs) were included
- AWS Billing monitoring discovery wasn’t working properly for Cost & Usage reports that did not contain cost allocation tags
- The start and end timestamps included in the nextPageParams field for the REST API data resource were set such that some records were returned twice. This was due specifically to the end timestamp bei
ng set exactly to the time of the last record in the returned results, and has been corrected by slightly adjusting the end value in the nextPageParams value - Password reset was not working using Internal Explorer 11
- Fixed an issue with the sorting order of legend items in the Graph Widget
- When zooming into a graph on the mobile app, the listed time range was not always updated
- Fixed an issue causing downstream fields to clear when modifying widget data fields
- Fixed an edge case where quickly clicking the navigation arrows in the Alerts panel will result in a blank list of alerts
LogicModule Releases
Below is a list of improved LogicModules that were implemented since our last release:
New Monitoring Coverage
- HashiCorp Nomad – 11 DataSources & 2 PropertySources
Monitoring Improvements
- HTTPS – 1 DataSource
- Minor fixes to datapoint valid value ranges.
- AWS Redshift Nodes – 1 DataSource
- Replaces ‘AWS_RedShiftNodes’ with a new Active Discovery method.
- AWS ElastiCache Memcached – 1 DataSource
- Replaces ‘AWS_ElastiCache_Memcached’ with a new Active Discovery method.
- AWS ElastiCache Redis – 1 DataSource
- Replaces ‘AWS_ElastiCache_Redis’ with a new Active Discovery method.
- Meraki MR, MX, MS and Z – 7 DataSources
- fix for Active Discovery timeout bug which prevented instance discovery in certain environments.
- Cisco IOS – 1 ConfigSource
- Fixed issue which could cause the log file to grow until the filesystem is out of space.