Disclaimer: This content applies to the legacy UI and is no longer maintained. It will be removed at a future time. For up-to-date content, see Changing the Time Range. At the time of removal, you will automatically be redirected to the up-to-date content.
Changing the Time Range
Last updated - 24 July, 2025
Per-user time range settings are available throughout the portal (for all graphs). You can change the time range by clicking the Time Range button located in the top right of the Resources, Websites, and Dashboards pages toolbars.
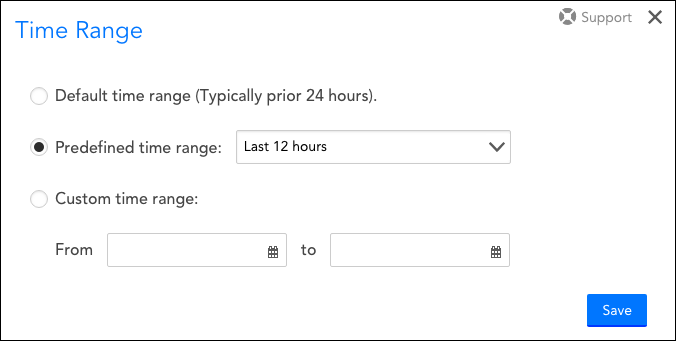
From the Time Range dialog that appears, select the default time range, a predefined time range, or a custom range. The default time range option allows the time range set in the configurations for a DataSource graph or Custom Graph widget to bubble up to the current view. The time range set here is applied to the majority of graphs across the LogicMonitor interface, and will remain in effect until the user session ends or the time range is changed once again.