Disclaimer: This content applies to the legacy UI and is no longer maintained. It will be removed at a future time. For up-to-date content, see Website Overview Report. At the time of removal, you will automatically be redirected to the up-to-date content.
Website Overview Report
Last updated - 25 July, 2025
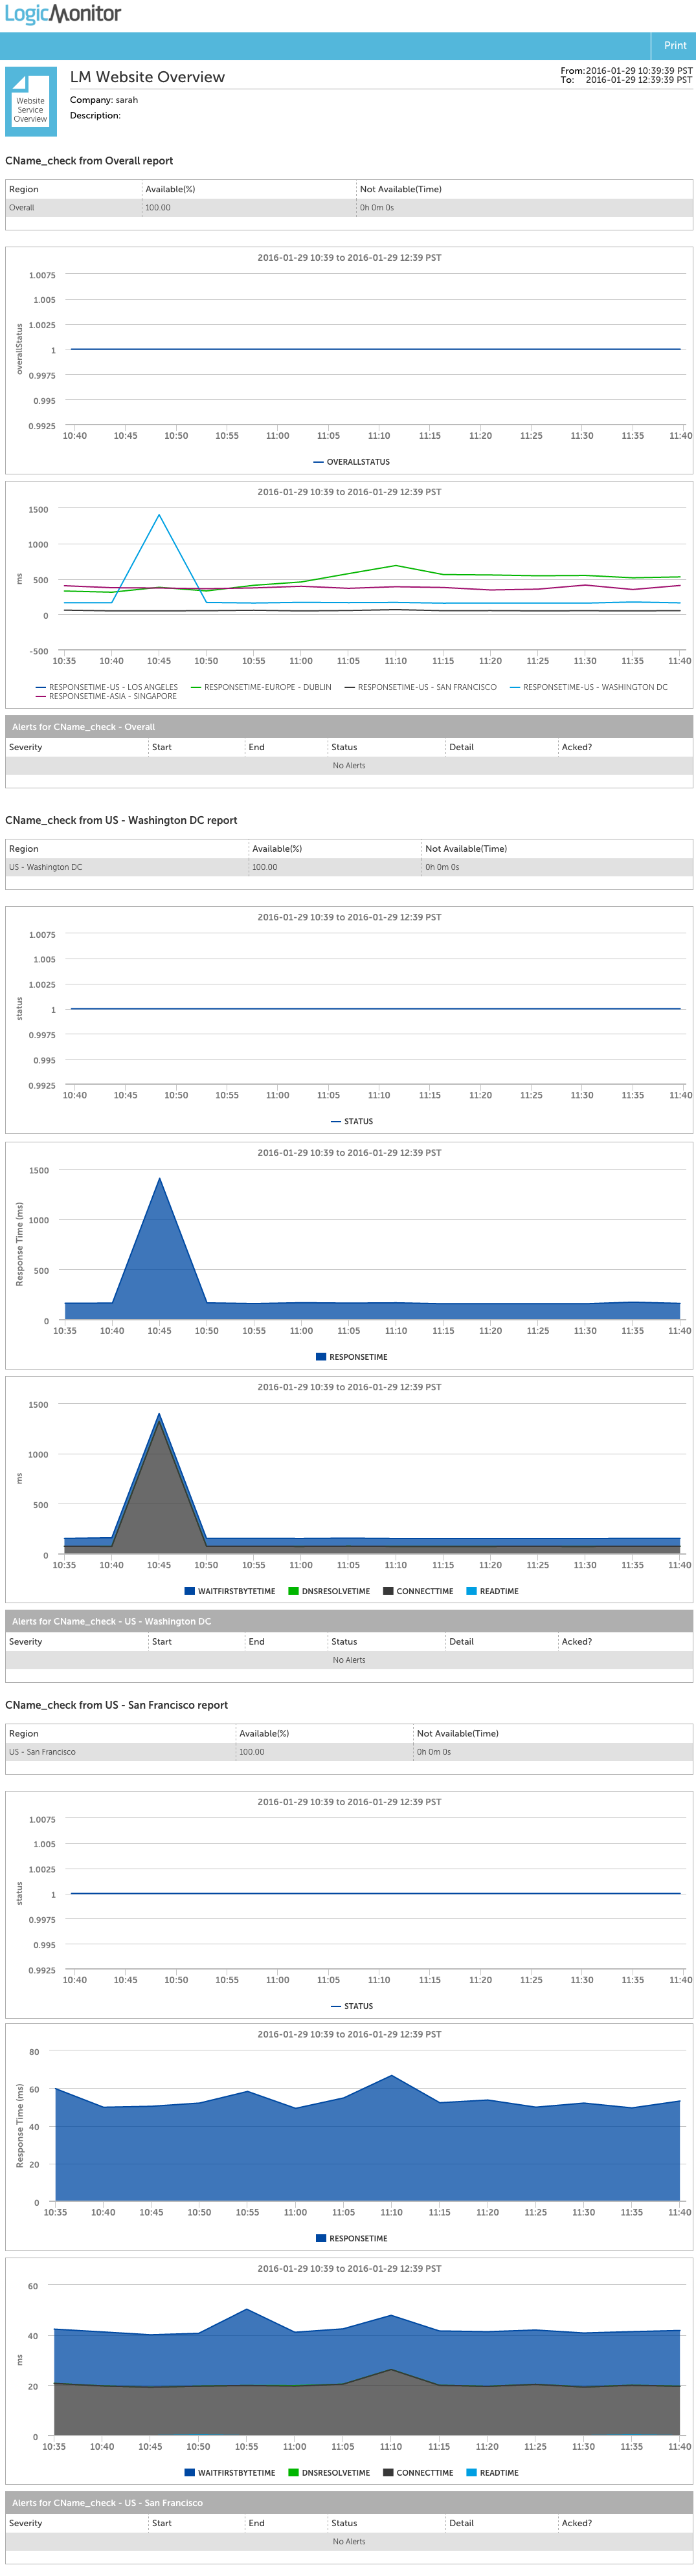
The Website Overview Report can display percent time available, time not available, and alert information per checkpoint for one or more external Web Checks (this report will not reflect Internal Web Checks). This information is displayed in a tabular data format and additionally includes graphs per checkpoint. Because the flexibility of this report allows you to view graphs and numerical data together for multiple websites, you may find this report useful for quickly reviewing availability metrics across a group of websites.
Configuration
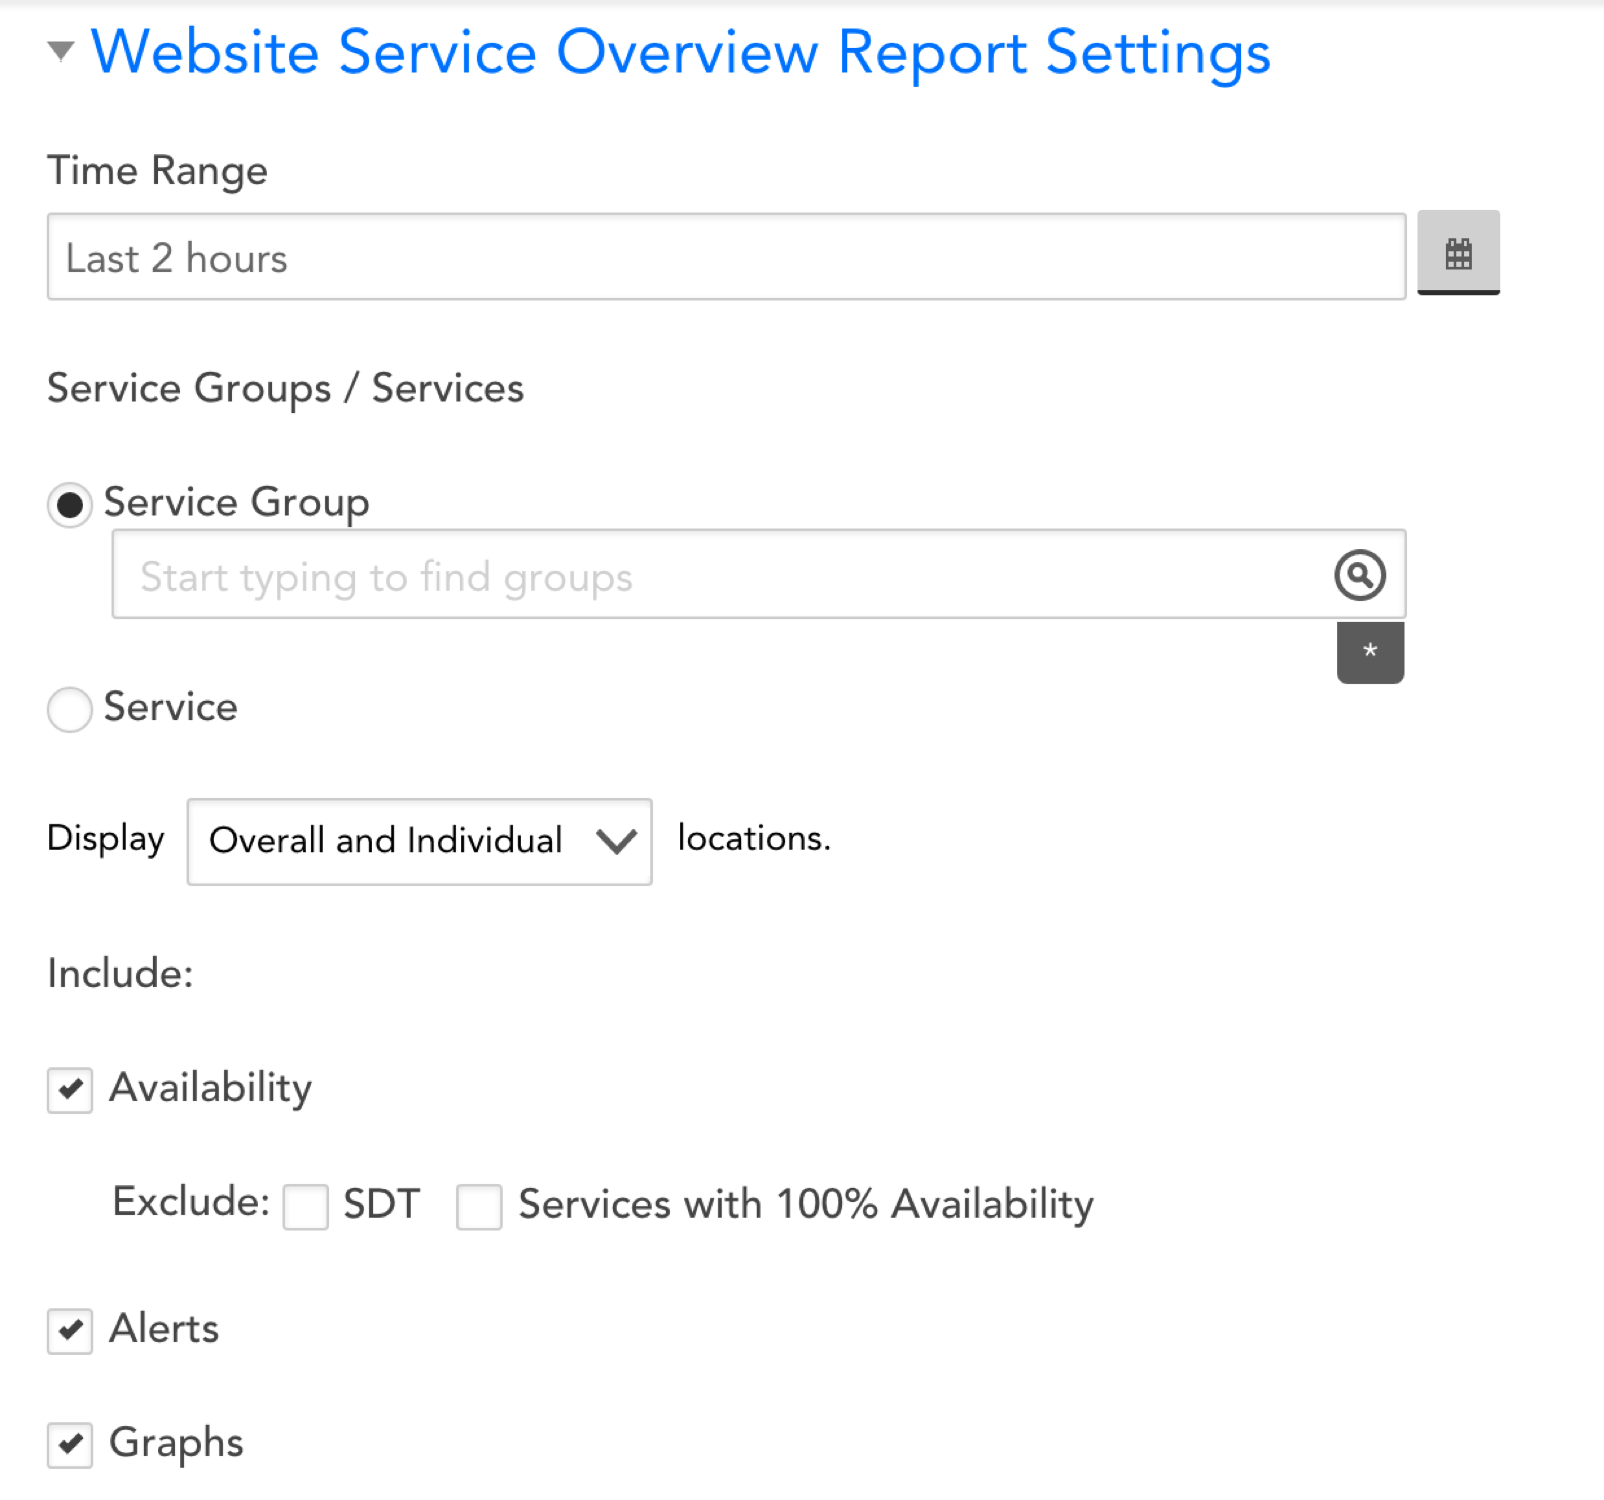
Time Range
Choose the time range for which you’d like to see website data.
Please note that for time ranges of two months or less, you will be able to include a maximum of 10,000 instances in your report. For time ranges of greater than two months, you will be able to include a maximum of 5,000 instances.
Website Groups / Websites
Select one or more websites or groups of websites that you’d like to see data for in the report.
Displayed Locations
Select whether you would like to only see overall data, or see overall data as well as data for each individual checkpoint location.
Include | Availability
You can choose whether to exclude scheduled downtime (SDT) from your Website Overview report. Checking this box will ensure that SDTs do not impact the overall percentage of your website’s availability.
You can also choose to ignore websites with 100% availability. Individuals may find this useful if they do not want data on websites that are functioning without downtime.
Include | Alerts/Graphs
Select whether you’d like to see percent time available, alerts, and/or graphs for the websites or website groups selected.
Checking “Calculate no data as Available” will include missing data as part of your website’s uptime.