
Dashboard Distribution
Last updated – 12 December, 2025
Import or export dashboards and dashboard groups and share dashboards with external users:
- Import/Export: You can import or export dashboards from your account as a JSON file. This enables you to harness the creativity of our customer base and share dashboard templates. Exporting or importing is particularly useful if you’ve used tokens in your dashboard and widgets. Replace token values to populate imported dashboards with new data. For more information on tokens, see Dashboard Tokens and Tokens in Widgets.
- Email: Sharing a dashboard via email allows you to send a dashboard snapshot to colleagues or customers on either a one time or reoccurring basis using a schedule of your choosing. This is useful for generating a visual report of your infrastructure’s overall status at a specific point in time. Dashboards are shared as web page URLs. These URLs provide read-only access to the dashboard and expire after seven days (this is a limitation of the AWS authentication technology that LogicMonitor uses to generate these URLs).
Note: You can also accomplish dashboard sharing via the Dashboard Report. For more information, see Dashboard Report.
Importing Dashboards and Dashboard Groups
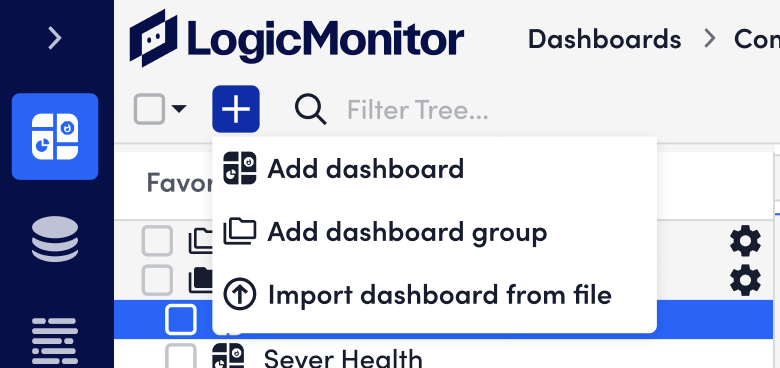
- In the top left corner of the Dashboards page, select the Add icon > Import dashboard from file.
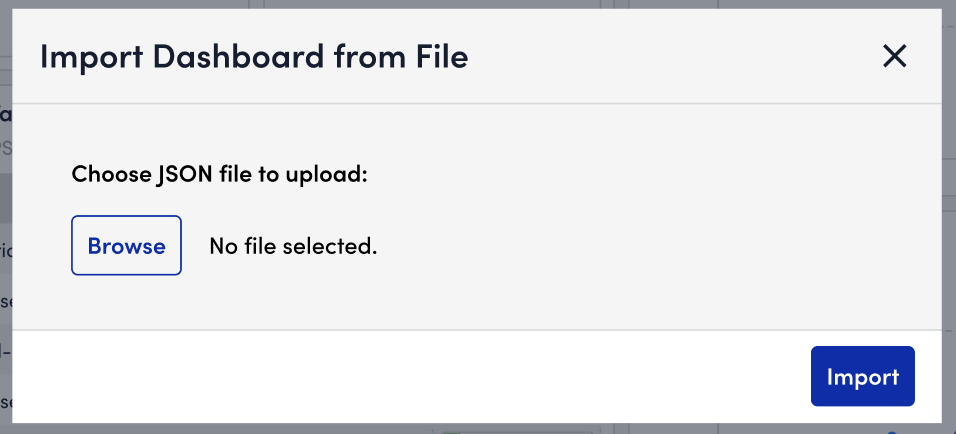
- In the Import Dashboard from File window, browse for a JSON file to upload.
Warning: The JSON file must be valid for the file to upload successfully. If you’re having issues uploading the file, try an online JSON validator to ensure the file is valid.
- Select Import to upload the file.
- Complete the steps for Adding a Dashboard.
Exporting Dashboards and Dashboard Groups
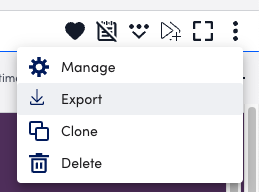
- In the top right corner of the dashboard you want to export, select the Overflow icon > Export.
The dashboard will be exported in a JSON file to your internet browser in the format dashboard name.json. - Open the file and save it to your desktop.
Sharing Dashboard Report
- In LogicMonitor, navigate to Dashboards and locate the dashboard you want to share.
- Select
 Manage Dashboard Options, and then select “Share Dashboard Report”.
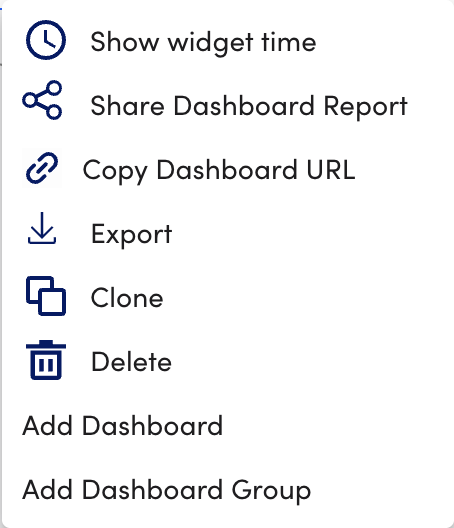
The Share Dashboard settings display. - In the Name field, enter a name if a name is not pre-populated.
By default, LogicMonitor enters the name of the dashboard in this field. - In Report Group, enter the name of an existing group or create a new group.
When creating a new group, LogicMonitor appends “(New)” to the name of the group.
By default, LogicMonitor enters “Shared Dashboards” as the report group. - In the Description field, enter a description for the dashboard.
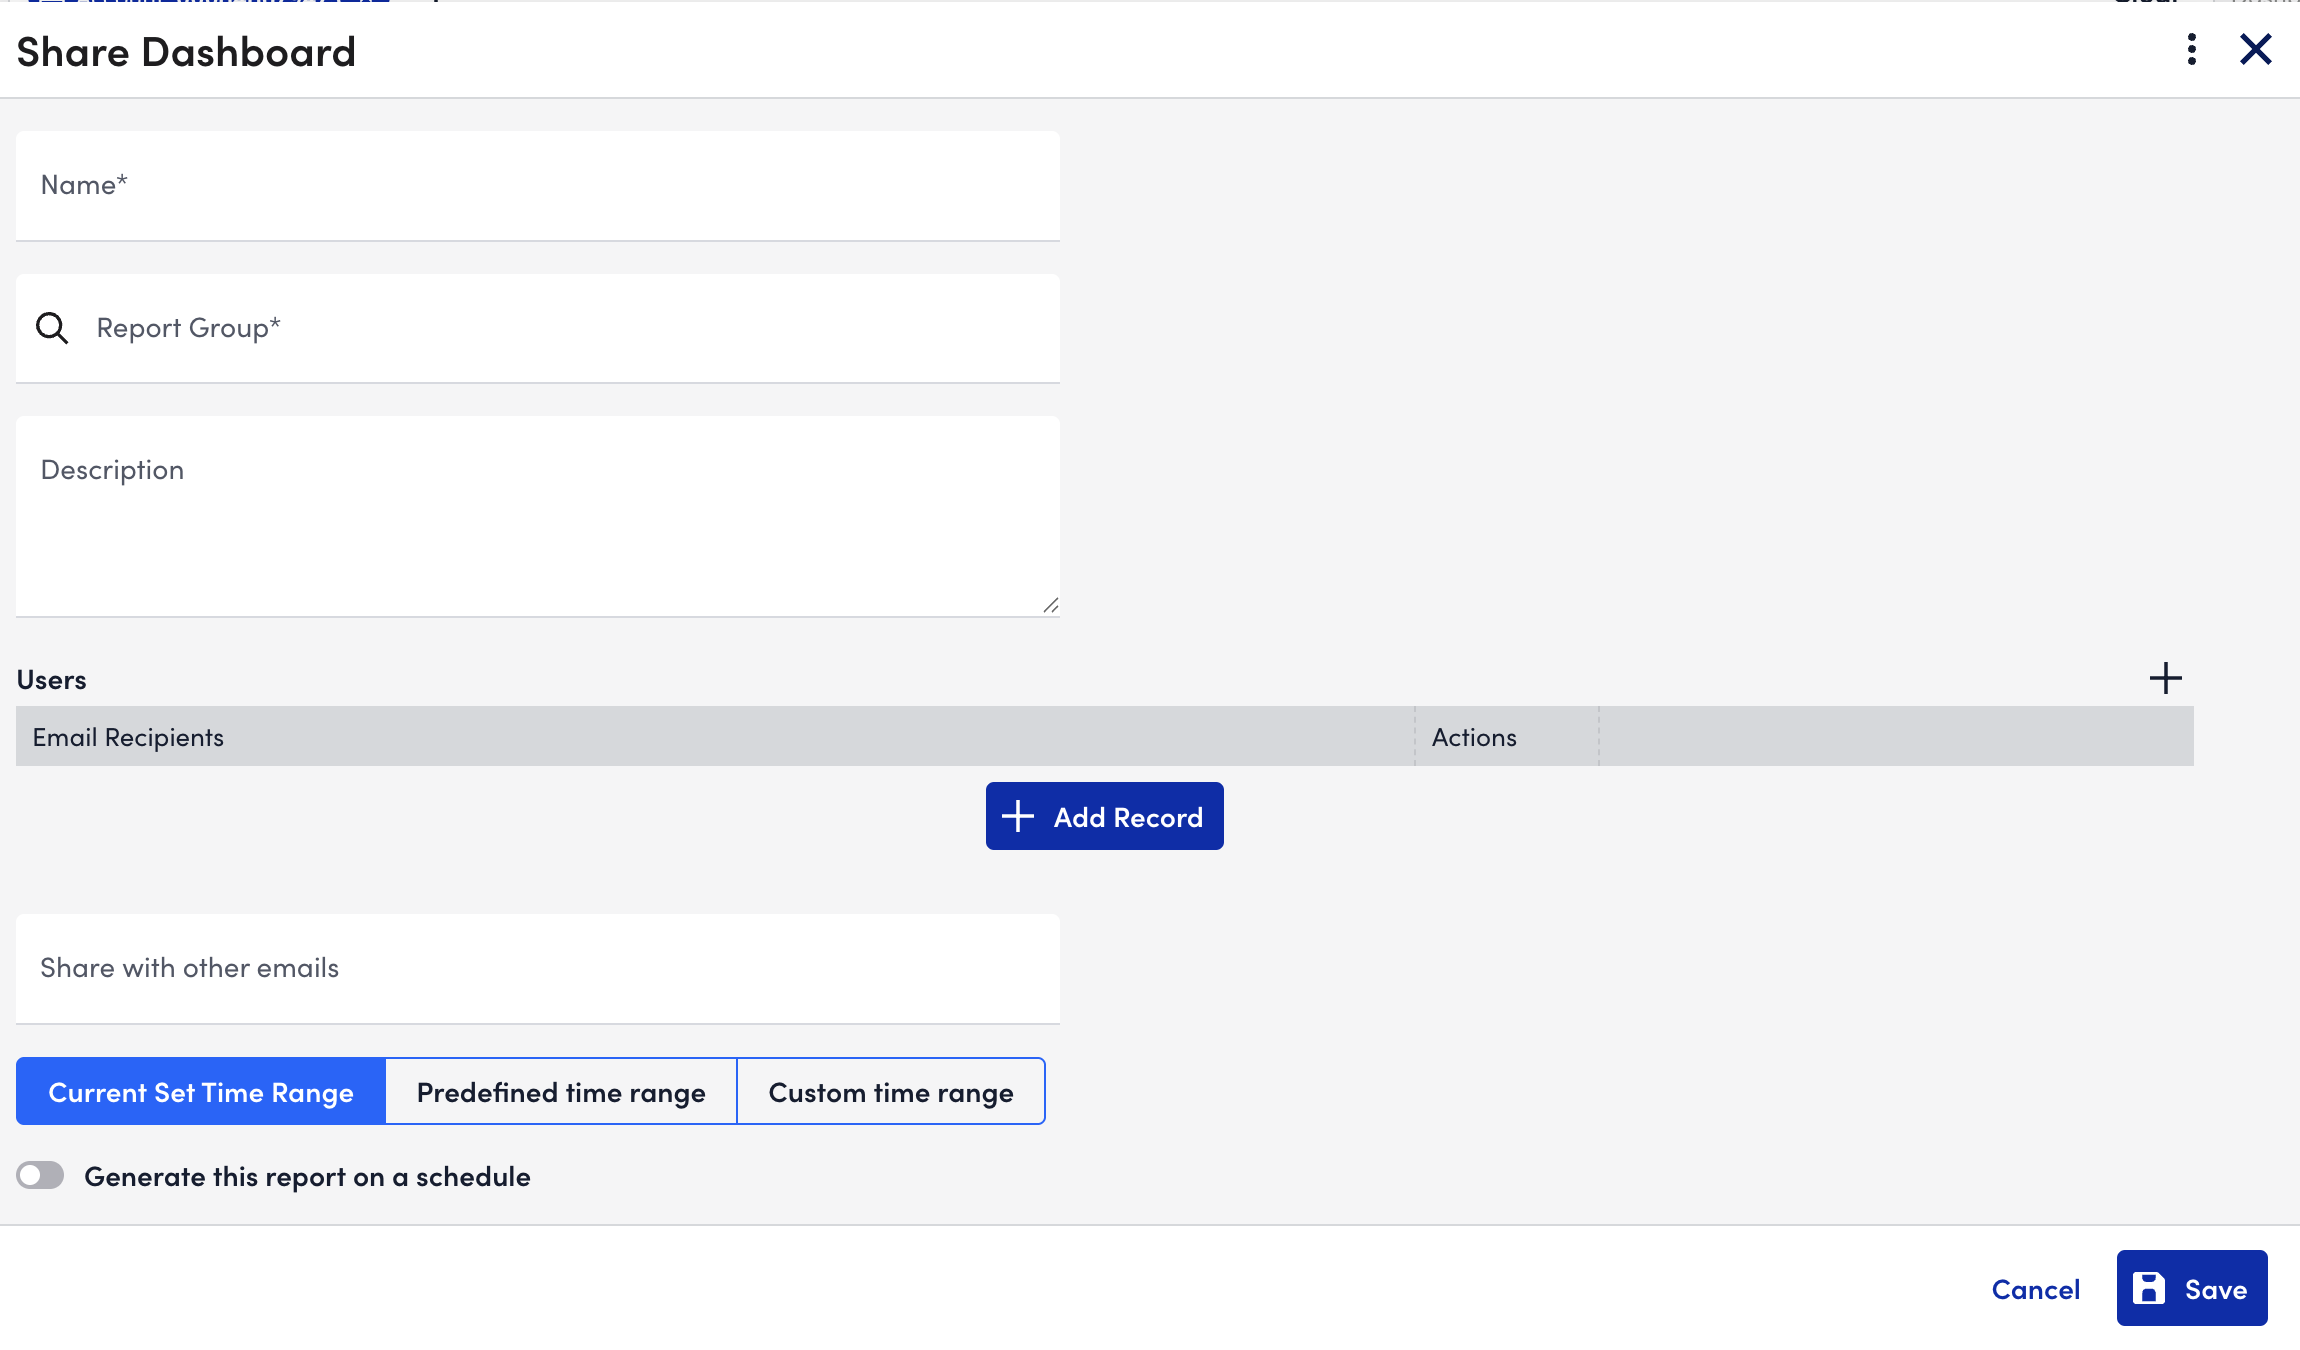
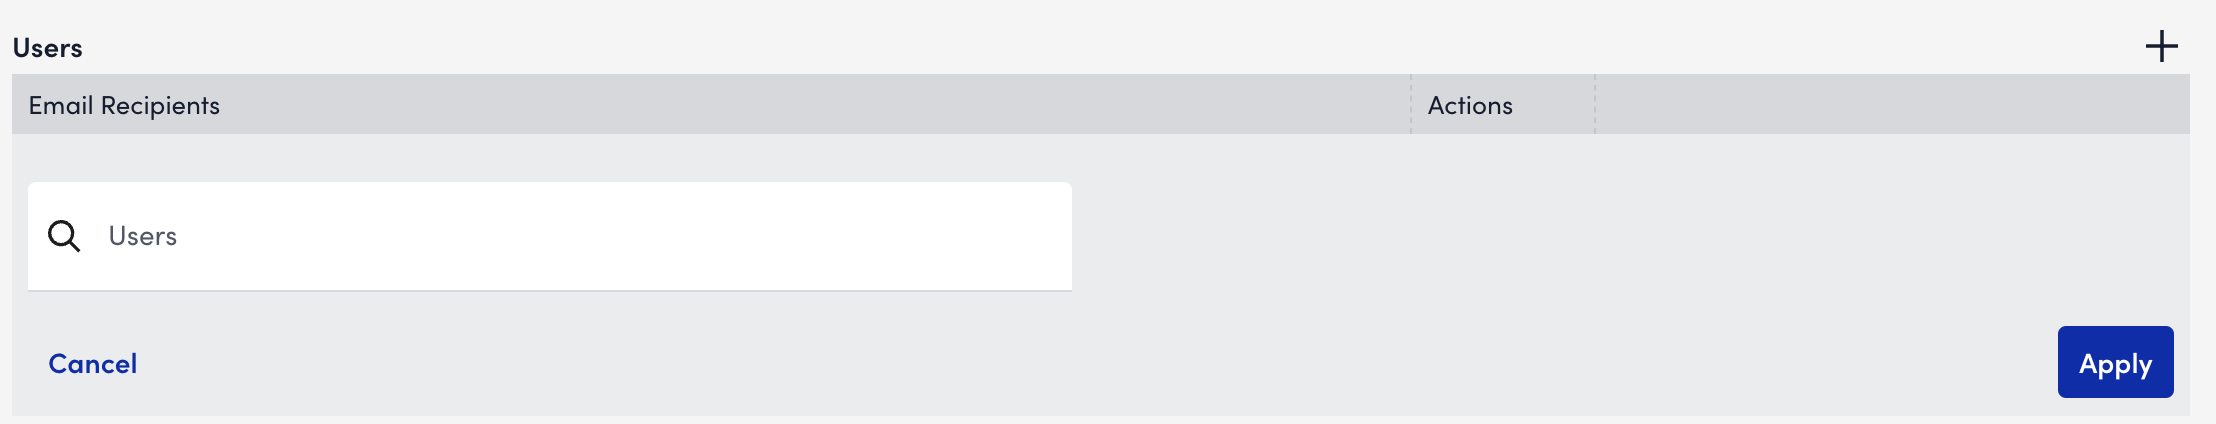
- In the Users settings, do the following to add users that are emailed a link to the shared dashboard:
- Select Add Record.
- In the Users field, enter the email address of the user you want to receive a link to the shared dashboard.
LogicMonitor attempts to populate users as you type. - Select Apply.
- Select
 to add another user, selecting Apply after each user.
You can add as many users as needed.
- In the Share with other emails field, enter external recipient email addresses who you want to receive a link to the shared dashboard.
- Select a time range for the data you want shared in the dashboard by doing one of the following:
- To choose the current time, select Current Set Time Range.
If the dashboard has a time range selected, this time is applied to all widgets.
If the dashboard time range is set to default, the widget time ranges are applied and the data renders accordingly. - To choose from a list of predefined time ranges, select Predefined time range, and then choose a time range from Default Time Range.
- To define a custom time range, select Custom time range, and then configure the date and time settings for the time range you want the data.
- To choose the current time, select Current Set Time Range.
- (Optional) To generate the report on a schedule, do the following:
- Toggle the Generate this report on a schedule switch.
- From the Frequency dropdown menu, select the frequency you want the report to generate.
For example, if you select “Day”, the report generates daily. - Configure when you want the report to generate using the day and time settings.
For example, if you configure the report to generate daily, you can choose the time to generate the report each day. If you configure the report to generate weekly, you can choose the day of the week and time to generate the report for the selected date. If you configure the report to generate monthly, you can configure the day of the month and time to generate the report.
- Select Save.
If the shared dashboard was not generated on a schedule, a confirmation message displays with a link to the dashboard. You can copy this link or select View. A dashboard report opens in a new tab.
If you configured the shared dashboard to generate on a schedule, it generates and sends to recipients based on the frequency you configured.
