Release Note


-
LogicMonitor Platform
- Introduction to LogicMonitor
- In-App Resources
-
Account Information
- Portal Information
- Portal Settings
- Financial
-
Usage Reporting
- Usage Reporting Overview
-
Product-Specific Usage Reporting
- Usage Reporting for APM Metrics
- Usage Reporting for LM Logs
- Usage Reporting for SaaS Monitoring
- Usage Reporting for IaaS Monitoring
- Usage Reporting for PaaS Monitoring
- Usage Reporting for APM Traces
- Usage Reporting for APM Synthetics
- Usage Reporting for Devices
- Usage Reporting for Websites
- Usage Reporting for Wireless Access Points
- Audit Logs
- Ops Notes
- Security Settings
- User Access
- Collectors
-
Dashboards
- Dashboards Overview
- Dashboard Creation
- Modern Dashboards
- Adding Dashboard Groups
- Finding Dashboards and Dashboard Groups
-
Widgets
- Widgets Overview
- Widgets Creation
- Widget Datapoint Configurations
-
Widget Types
- Alert List Widget
- Big Number Widget
- Netflow Widget
- NOC Widget
- Log Query Widget
- Pie Chart Widget
- Table Widget
- Text Widget
- Website Status Widget
- Custom Graph Widget
- SLA Widget
- Topology Map Widget
- Gauge Widget
- HTML Widget
- Job Monitor Widget
- Map Widget
- Resource Explorer Widget
- Recommendations Widget
- Billing Widget
- Widget Management
- Standard Widget Configurations
- Enabling Dashboard Text Widget Script Security
- Dashboard Management
- Dashboard Distribution
-
Resource Tree
- Navigating the Resources Page
- Changing the Time Range
- Remote Session
- Using Ops Notes
- Resources Details
- Resource Groups
- Resource Management
- NetScans
- Resource Explorer
- Services
- LM Uptime Overview
-
Websites
- Data Monitored for Websites
- Websites Page Overview
- Alerting on Websites Data
- Trace Route for Websites
-
Websites Management
- Websites Default Settings
- Web Check
- Ping Check
- Testing the Steps of a Web Check
- Creating a Website Dashboard
- Website Properties
- Website Management
- Executing Internal Web Checks using Groovy Scripts
- Web Checks with Form-Based Authentication
- Websites SDT
- Disabling External Website Testing Location Across your Account
- Understanding Website Status Codes
- Websites Groups
- Mappings
- Alerts
-
Reports
- Choosing a Report Type
- Creating a Report Group
- Shared Report Access
-
Report Types
- Alert Forecast Report
- Alert SLA Report
- Alert HealthCheck Report
- Alert Thresholds Report
- Alert Trends Report
- Alerts Report
- Audit Log Report
- Dashboard Report
- Interface Bandwidth Report
- Log Query Report
- NetFlow Resource Metric Report
- Resource Group Inventory Report
- Resource Inventory Report
- Resource Metric Trends Report
- Role Report
- SDT Inventory Report
- Server CPU Report
- Service Level Agreement Report
- User Report
- Website Overview Report
-
Modules
- Modules Overview
- Modules Installation
- Custom Module Creation
- Tokens Available in LogicModule Alert Messages
- Deprecated LogicModules
- Data Collection Methods
- Active Discovery
- Groovy Support
-
Module Configurations
- Types of Modules
- DataSource
- PropertySource
- AppliesTo
- SNMP SysOID Map Configuration
- JobMonitor
- ConfigSource
- TopologySource
- EventSource
-
LogSource
- LogSource Overview
- Configuring a LogSource
- Kubernetes Event Logging LogSource Configuration
- Kubernetes Pods LogSource Configuration
- Log Files LogSource Configuration
- Script Logs LogSource Configuration
- SNMP Traps LogSource Configuration
- Supported MIBs for SNMP Trap Translation
- Troubleshooting MIBs to JSON Converter Utility Issues
- Troubleshooting SNMP Traps Issues
- Modules Management
- Access Groups for Modules
- Security
-
LM Logs
- LM Logs Overview
- Log Ingestion
- Log Processing
- Logs Partition
- Log Anomaly Detection
- Log Analysis
- Viewing Logs and Log Anomalies
- Reset Log Anomaly Detection
- Log Patterns
- Log Query Language
- Log Processing Pipelines
- Log Alert Conditions
- Logs Roles and Permissions
- LM Logs Usage Data
- Troubleshooting Logs
-
Cloud Monitoring
- Introduction to Cloud Monitoring
- Cloud Services and Resource Units
- Monitored Locations for Cloud Monitoring
- Cloud Monitoring using a Collector for Existing Cloud Resources
- Monitoring Utilized Cloud Service Limits
- Custom Event Integrations Setup
-
Amazon Web Services Monitoring
- AWS Monitoring Setup
- AWS Organizational Unit Monitoring Setup
- Using StackSets to Automate Role and Policy Creation
- AWS Billing Monitoring Setup
- CloudWatch Costs Associated with Monitoring
- Managing your AWS devices in LogicMonitor
- AWS Tag Usage in LogicMonitor
- Customizing AWS CloudWatch DataSources
- Troubleshooting Custom AWS CloudWatch DataSources
- Microsoft Azure Monitoring
- Google Cloud Platform Monitoring
- MongoDB Atlas Monitoring
- Cost Optimization
- Cloud Data Collection with Poll Now
- SaaS Monitoring
-
Edwin AI
- Introduction to Edwin AI
- Key Concepts in Edwin AI
- Edwin AI Roles and Users
- Configure Edwin AI Dashboard
- Configure Edwin AI Models
- Configure Edwin AI Actions
- Edwin AI Rules
- Working with Edwin AI
- Export and Import Edwin AI Configuration
-
Edwin AI Integrations
- Edwin AI Integrations Overview
- Edwin AI Monitoring Integrations
- Edwin AI IT Service Management Integrations
-
LM Integrations
- LogicMonitor Integrations Overview
- Navigating the Integration Page
- Communications Integrations
- Workflow Integrations
- Automation Integrations
- Custom Integrations for LogicMonitor
- Logs for LM Integrations
-
Container Monitoring
- About LogicMonitor Container Monitoring
-
Kubernetes Monitoring
- Support Matrix for Kubernetes Monitoring
- Kubernetes and LM Containers Key Concepts and Terms
- Kubernetes Monitoring Considerations and Required Permissions
- Resource Sizing for Performance Optimization and Tuning Recommendations
- LM Container Installation
- LM Container Upgrade
- LM Container Uninstallation
- Existing Configuration Migration
- Kubernetes Events and Pod Logs Collection
-
Resource Monitoring
- Monitoring Helm Charts Releases
- Kubernetes Core Components Monitoring
- Monitoring Kubernetes Clusters with kube-state-metrics
- Filtering Kubernetes Resources for Monitoring
- NGINX Ingress Controller Monitoring
- Kubernetes Certificates and cert-manager Monitoring
- Disabling Alerts on Kubernetes Resources
- Default Filtering for Kubernetes Resources
- Filtering Kubernetes Resources using Labels, Annotations, and Selectors
- Disabling Resources from Monitoring
- Retention of Deleted Kubernetes Resources using LM Containers
- Retaining Deleted Kubernetes Resources
- Advanced Configuration
- Monitor Supported Resources
- Topology for Kubernetes Cluster
- Kubernetes Cluster Monitoring as Non-Admin User
- Troubleshooting Kubernetes Monitoring
- Docker Monitoring
-
LM APM
- LM APM Overview
- Quick Steps to Setup LogicMonitor APM
-
Push Metrics
- Getting Started with Push Metrics
- Use Cases for Push Metrics
- About the Push Metrics REST API
- Ingesting Metrics with the Push Metrics REST API
- Python SDK for Push Metrics API
- .NET SDK for Push Metrics API
- Managing Resources that Ingest Push Metrics
- Rate Limiting for Push Metrics
- Updating Instance Properties with the Push Metrics REST API
- Updating Resource Properties with the Push Metrics REST API
- OpenMetrics Integration
-
Distributed Tracing
- Distributed Tracing Overview
- Application Authentication Overview
- Traces Page
- Application Instrumentation for LogicMonitor
- Trace Data Forwarding to LogicMonitor
- OpenTelemetry Collector for LogicMonitor Overview
- Synthetics
-
Monitoring Solutions
- Apache
- APC
- AI Monitoring
- Atlassian
- AWS
- Azure
- Broadcom
- Cato Networks
- Checkpoint
-
Cisco
- Cisco APIC Monitoring
- Cisco ASA/ASR
- Cisco Catalyst Center
- Cisco Catalyst SD-WAN Monitoring
- Cisco CUCM API Monitoring
- Cisco Device SNMP and NTP Configuration
- Cisco Firepower Chassis Manager Monitoring
- Cisco Firepower Threat Defense Monitoring
- Cisco Hyperflex Monitoring
- Cisco Intersight Monitoring
- Cisco IP SLA Monitoring
- Cisco ISE Monitoring
- Cisco Meraki Monitoring
- Cisco UCCX Monitoring
- Cisco UCS Monitoring
- Cisco UCS X Monitoring
- Cisco Unified Call Manager (CUCM) Monitoring
- Cisco VoIP Monitoring
- Cisco Wireless Monitoring
- Citrix
- Cohesity
- Common Config
- CommVault
- ConnectWise
- Couchbase Server
- Dell Technologies
- Email Service
- Extreme Networks
- F5
- FreeBSD
- Fortinet
- HPE
- IBM
- IMPI
- Infinidat
- Infoblox
- Java
- Jenkins
- Juniper
- Kemp
- Kubernetes
- Linux
- LogicMonitor
- LSI MegaRAID Controller
- Microsoft
- MongoDB
- NetApp
- Network Traffic Monitoring
- NTP
- Nutanix Systems
- OpenAI
- Oracle
- Palo Alto Networks
- Panzura
- Perfmon Access
- Pick
- Puppet
- Pure Storage
- Quantum
- RabbitMQ
- Redis
- Rubrik
- Ruckus
- SAP
- Slack
- SSL
- SNMP
- Sonicwall
- SumoLogic
- SwiftStack
- Ubiquiti
- Unomaly
- Varnish
- Veeam
- Versa SD-WAN
- Mobile
-
Developer
-
LogicMonitor REST API
-
REST API Overview
- Using LogicMonitor's REST API
- Migration to LogicMonitor REST API v3
- REST API Change Log
- REST API Authentication
- REST API Status Codes
- REST API Error Codes
- REST API Rate Limit
- REST API Troubleshooting
-
REST API v3
- REST API v3 Swagger Documentation
- LogicMonitor v3 SDK
- REST API Basic Filters
- REST API Advanced Filters
- Creating Services Using LogicMonitor REST API v3
- Delta Support for device/devices API
- Best Practices for Migrating to LogicMonitor v3 SDK
-
REST API v3 Endpoints
- Managing Alerts
- Managing Alert Rules
- Managing Cost Optimization Recommendations
- Managing Recipient Groups
- Managing Roles
- Managing Ops Notes
- Managing Report Groups
- Managing Dashboard Groups
- Managing Collector Groups
- Managing ConfigSources
- Managing EventSources
- Managing Collector Debug Command
- Managing Collector Version
- Managing NetScan
- Managing PropertySources
- Viewing Metrics
- Viewing Integration Audit Logs
- Viewing External APIs
- Managing AppliesToFunction
- Managing Devices
- Managing DataSources
- Managing Escalation Chains
- Managing API Tokens
- Managing DataSource Instances
- Managing Dashboards
- Managing Users
- Managing Audit Logs
- Managing Data
- Managing Access Group
- Managing OIDs
- Managing Device Groups
- REST API v2
-
REST API v1
- REST API v1 Overview
- Getting Data with the REST API
-
REST API v1 Endpoints
- Managing Alert Rules
- Managing Alerts
- Managing API Tokens
- Accessing Audit Logs
- Managing Collectors
- Managing Collector Groups
- Managing Dashboards and Widgets
- Managing Dashboard Groups
- Managing DataSources
- Managing DataSource Instances
- Managing Devices
-
Managing Device Groups
- About the Device Group Resource
- Add a Device Group
- Add Device Group Properties
- AWS Device Groups
- Azure Device Groups
- Delete Device Group Properties
- Delete a Device Group
- GCP Device Groups
- Get all alerts for a Device Group
- Get all SDTs for a Device Group
- Get Device Group Properties
- Get Device Groups
- Get devices for a particular device group
- Update a Device Group
- Update Device Group Properties
- Managing Escalation Chains
- Managing Ops Notes
- Managing Reports
- Managing Report Groups
- Managing Roles
- Managing SDTs
- Managing Websites
- Managing Website Groups
- Getting Websites Test Locations
- Managing Thresholds
- Managing Users
-
REST API Overview
- Scripting Support
-
LogicMonitor REST API
- Policies and Compliance
- Training and Education
-
Legacy UI
- Getting Started
- Devices
- Dashboards and Widgets
- AIOps
- LM Service Insights
- LogicModules
- Terminology and Syntax
- LM APM
-
Cloud Monitoring
-
Getting Started with LM Cloud
- LM Cloud Monitoring Overview
- Enabling Cloud Monitoring using Local Collector
- Visualizing your cloud environment with auto dashboards and reports
- Setting up custom event integrations
- Monitoring Cloud Service Limit Utilization
- Optimizing your Cloud Spend
- Cloud Data Collection
- Amazon Web Services Monitoring
- Google Cloud Platform Monitoring
- MongoDB Atlas Monitoring
-
Getting Started with LM Cloud
- Container Monitoring
- Monitoring Solutions
In this article
The v.102 release will be rolled out through the end of March and second week of April. Several much-anticipated changes are introduced with this release, including Collector Properties and an improved Table Widget.
In v.99, we introduced a major improvement to the Table Widget in which you could establish a dynamic Top 10/25/all table of instances for designated datapoints with glob. In this release, we expand upon this improvement by adding the following:
- options to display the bottom 10 or 25 instances for a given datapoint.
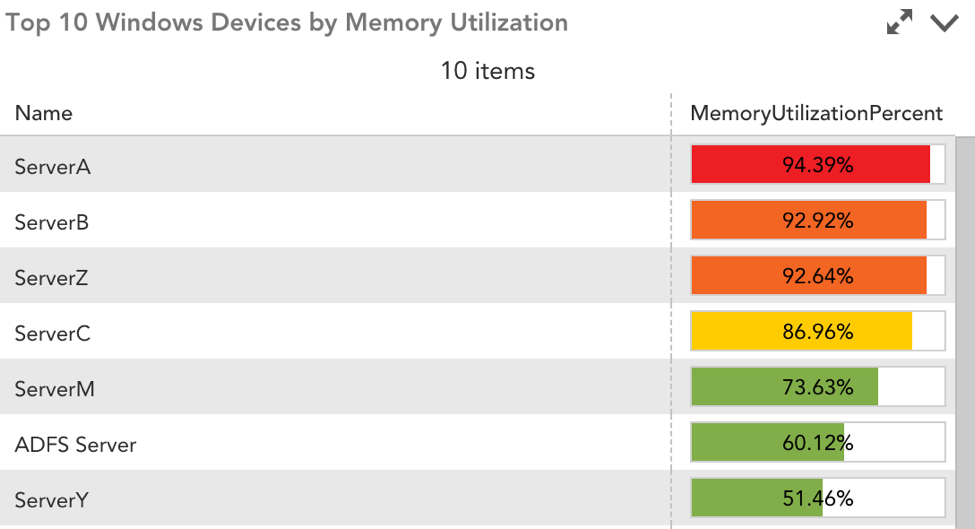
- “Percentage” bars can be enabled to color-code the value of a datapoint according to set thresholds. This can be enabled on up to two columns at once.
- instance filtering
Why you care: displaying the bottom X instances for a datapoint is useful for tracking resource-deficient or over-provisioned parts of your infrastructure, e.g. displaying the 10 least used CPU or IOPS across servers. Additionally, the ability to color-code datapoint values in your Table widget is useful for at-a-glance verification of your environment’s health. For example, if you want a clear indication when Server A’s CPUBusyPercent is over 90%, you would set the column to be highlighted red when its value crosses this threshold.
You can now define properties on Collectors or Collector Groups for use in Collector-related alerts. Once a Collector property has been defined, it can be tokenized to customize Collector-related alert messages and/or integration delivery. These tokens are substituted with the property value at the time of generation so that the alert or integration delivery can include dynamic information.
Why you care: in addition to providing more context for Collector-related alerts, this feature is particularly useful for routing Collector down alerts to the proper team or customer via integrations.
SAML Security Enhancement – SHA-256
To ensure alignment with current best practice, we are updating our SAML Service Provider framework to accept the SHA-2 family of hashing algorithms. Existing SAML Identity Providers configured to use SHA-1 hashing will not be impacted.
Note: This change will be deployed to all customers during LogicMonitor’s regularly scheduled maintenance window on April 12th, 2018.
Other Improvements
Alerts
- Recipient Groups now have a Description Field available for details about the group.
- SDT notes are now displayed in the Alerts panel along side ACK notes.
Dashboards
- Improved text wrapping in the Big Number Widget to display more of the label text in a single line.
- When configuring a Custom Table Widget, you can now select an instance from any of the alternate DataSources in the column, not just the first match.
Devices
- You can now delete or exclude a device from the “Unmonitored” group.
Integrations
- URL validation in integrations now covers newer url formats.
LM Cloud
- Added support for monitoring Azure App Service Plans. All App Services running in a particular plan will be auto-grouped with that plan.
- Added support for monitoring Azure Cosmos DB
- Added an operation field to AWS and Azure tag filters, with possible values of include and exclude. This field defaults to ‘include’, which is the current behavior. You may find this new field useful if you’d like to filter out a group of tagged resources from discovery / monitoring.
- We have added a new tab to the AWS account manage dialog for setting up billing monitoring based on AWS Cost & Usage Reports, and removed the Billing (Cost & Usage Report) option from the Services tab. You can find setup instructions here.
- Improved error message for cases where no resources are discovered for a cloud service.
- Added support for custom polling intervals via a custom property set for cloud devices and / or groups, per this support article.
LogicModules
- The ESX Collector method will now return a unique status value to represent inaccurate credentials to assist in troubleshooting those DataSources.
- Where applicable, longer collection intervals are available on most LogicModules.
Reports
- Increased the amount of data that can be queried by a report to match the data storage period in your pricing package.
- You can now add custom columns to the Alerts Report, much like in the Alerts Widget.
REST API
- We have published the ability to get and configure cluster alerts via our REST API.
Services
- Internal Service Checks now support UTF-8 with BOM (byte order mark).
Settings
- The minimum time range for the Audit Log has been reduced to one minute.
- Improved matching logic for the “suggested results” displayed for devices.
Bugs Fixed
- Fixed an issue with the default ACK payload for Slack Integrations that prevented the message from being successfully delivered.
- Azure tags are now added as properties in a lowercase format for discovered Azure resources, which is consistent with the fact that tags are case insensitive in Azure.
- Tags with a colon in the name weren’t working in data collection metric paths. We’ve improved how token values are substituted in metric paths to allow for colons.
- In certain cases, EBS volume properties providing attachment state/details weren’t kept up to date for detached volumes.
- Fixed an issue causing a timeout error when adding properties to the Device Inventory Report.
- Fixed minor dashboard font/sizing issues in Internet Explorer.
- Fixed a bug where very large custom logos would not display correctly when uploaded.
LogicModule Releases
Below is a list of new and improved LogicModules that were implemented since our last release:
New Monitoring Coverage
- FortiNet FortiGate Interfaces – 1 DataSource
- Microsoft Windows Domain Controller – 1 PropertySource
- Microsoft Windows CPU – 1 DataSource
- Microsoft Windows IIS – 1 PropertySource
- Microsoft Windows DNS – 1 PropertySource
- Microsoft SQL Server – 1 PropertySource
- Microsoft Windows Security Event Log – 1 EventSource
- Microsoft Domain Services Event Log – 1 EventSource
Monitoring Improvements
- AWS Redshift Cluster, AWS Redshift Nodes – 2 DataSources
- lengthened polling interval
- Microsoft Azure API Management – 1 DataSource
- fixed typo in metric name
- Apache Kafka – 3 DataSources
- updated tech notes with link to relevant support page
- Windows IIS Events – 1 EventSource
- updated appliesTo, definition, tech notes, and grouping.
- Windows Exchange Events – 1 EventSource
- updated appliesTo, definition, tech notes, and grouping.
- Windows SQL Events – 1 EventSource
- updated appliesTo, definition, tech notes, and grouping.
- Windows System Events – 1 EventSource
- updated definition and grouping.
- VMWare vSphere Cluster Performance – 1 DataSource
- updated collection method for improved performance
- VMWare vSphere Resource Pools – 1 DataSource
- updated collection method for improved performance.
- SNMP64_IF – 1 DataSource
- added ability for alert filtering for specific interfaces.
- In/Out interface utilization based on interface speed and configurable actual speed.
- additional datapoints.
- improved datapoint descriptions and graphs
- VMware_vSphere_HardwareSensors – 1 DataSource
- Added explanation about limitations and VMware Rollup Health State