Release Note


-
LogicMonitor Platform
- Introduction to LogicMonitor
- In-App Resources
-
Account Information
- Portal Information
- Portal Settings
- Financial
-
Usage Reporting
- Usage Reporting Overview
-
Product-Specific Usage Reporting
- Usage Reporting for APM Metrics
- Usage Reporting for LM Logs
- Usage Reporting for SaaS Monitoring
- Usage Reporting for IaaS Monitoring
- Usage Reporting for PaaS Monitoring
- Usage Reporting for APM Traces
- Usage Reporting for APM Synthetics
- Usage Reporting for Devices
- Usage Reporting for Websites
- Usage Reporting for Wireless Access Points
- Audit Logs
- Ops Notes
- Security Settings
- User Access
- Collectors
-
Dashboards
- Dashboards Overview
- Dashboard Creation
- Modern Dashboards
- Adding Dashboard Groups
- Finding Dashboards and Dashboard Groups
-
Widgets
- Widgets Overview
- Widgets Creation
- Widget Datapoint Configurations
-
Widget Types
- Alert List Widget
- Big Number Widget
- Netflow Widget
- NOC Widget
- Log Query Widget
- Pie Chart Widget
- Table Widget
- Text Widget
- Website Status Widget
- Custom Graph Widget
- SLA Widget
- Topology Map Widget
- Gauge Widget
- HTML Widget
- Job Monitor Widget
- Map Widget
- Resource Explorer Widget
- Recommendations Widget
- Billing Widget
- Widget Management
- Standard Widget Configurations
- Enabling Dashboard Text Widget Script Security
- Dashboard Management
- Dashboard Distribution
-
Resource Tree
- Navigating the Resources Page
- Changing the Time Range
- Remote Session
- Using Ops Notes
- Resources Details
- Resource Groups
- Resource Management
- NetScans
- Resource Explorer
- Services
- LM Uptime Overview
-
Websites
- Data Monitored for Websites
- Websites Page Overview
- Alerting on Websites Data
- Trace Route for Websites
-
Websites Management
- Websites Default Settings
- Web Check
- Ping Check
- Testing the Steps of a Web Check
- Creating a Website Dashboard
- Website Properties
- Website Management
- Executing Internal Web Checks using Groovy Scripts
- Web Checks with Form-Based Authentication
- Websites SDT
- Disabling External Website Testing Location Across your Account
- Understanding Website Status Codes
- Websites Groups
- Mappings
- Alerts
-
Reports
- Choosing a Report Type
- Creating a Report Group
- Shared Report Access
-
Report Types
- Alert Forecast Report
- Alert SLA Report
- Alert HealthCheck Report
- Alert Thresholds Report
- Alert Trends Report
- Alerts Report
- Audit Log Report
- Dashboard Report
- Interface Bandwidth Report
- Log Query Report
- NetFlow Resource Metric Report
- Resource Group Inventory Report
- Resource Inventory Report
- Resource Metric Trends Report
- Role Report
- SDT Inventory Report
- Server CPU Report
- Service Level Agreement Report
- User Report
- Website Overview Report
-
Modules
- Modules Overview
- Modules Installation
- Custom Module Creation
- Tokens Available in LogicModule Alert Messages
- Deprecated LogicModules
- Data Collection Methods
- Active Discovery
- Groovy Support
-
Module Configurations
- Types of Modules
- DataSource
- PropertySource
- AppliesTo
- SNMP SysOID Map Configuration
- JobMonitor
- ConfigSource
- TopologySource
- EventSource
-
LogSource
- LogSource Overview
- Configuring a LogSource
- Kubernetes Event Logging LogSource Configuration
- Kubernetes Pods LogSource Configuration
- Log Files LogSource Configuration
- Script Logs LogSource Configuration
- SNMP Traps LogSource Configuration
- Supported MIBs for SNMP Trap Translation
- Troubleshooting MIBs to JSON Converter Utility Issues
- Troubleshooting SNMP Traps Issues
- Modules Management
- Access Groups for Modules
- Security
-
LM Logs
- LM Logs Overview
- Log Ingestion
- Log Processing
- Logs Partition
- Log Anomaly Detection
- Log Analysis
- Viewing Logs and Log Anomalies
- Reset Log Anomaly Detection
- Log Patterns
- Log Query Language
- Log Processing Pipelines
- Log Alert Conditions
- Logs Roles and Permissions
- LM Logs Usage Data
- Troubleshooting Logs
-
Cloud Monitoring
- Introduction to Cloud Monitoring
- Cloud Services and Resource Units
- Monitored Locations for Cloud Monitoring
- Cloud Monitoring using a Collector for Existing Cloud Resources
- Monitoring Utilized Cloud Service Limits
- Custom Event Integrations Setup
-
Amazon Web Services Monitoring
- AWS Monitoring Setup
- AWS Organizational Unit Monitoring Setup
- Using StackSets to Automate Role and Policy Creation
- AWS Billing Monitoring Setup
- CloudWatch Costs Associated with Monitoring
- Managing your AWS devices in LogicMonitor
- AWS Tag Usage in LogicMonitor
- Customizing AWS CloudWatch DataSources
- Troubleshooting Custom AWS CloudWatch DataSources
- Microsoft Azure Monitoring
- Google Cloud Platform Monitoring
- MongoDB Atlas Monitoring
- Cost Optimization
- Cloud Data Collection with Poll Now
- SaaS Monitoring
-
Edwin AI
- Introduction to Edwin AI
- Key Concepts in Edwin AI
- Edwin AI Roles and Users
- Configure Edwin AI Dashboard
- Configure Edwin AI Models
- Configure Edwin AI Actions
- Edwin AI Rules
- Working with Edwin AI
- Export and Import Edwin AI Configuration
-
Edwin AI Integrations
- Edwin AI Integrations Overview
- Edwin AI Monitoring Integrations
- Edwin AI IT Service Management Integrations
-
LM Integrations
- LogicMonitor Integrations Overview
- Navigating the Integration Page
- Communications Integrations
- Workflow Integrations
- Automation Integrations
- Custom Integrations for LogicMonitor
- Logs for LM Integrations
-
Container Monitoring
- About LogicMonitor Container Monitoring
-
Kubernetes Monitoring
- Support Matrix for Kubernetes Monitoring
- Kubernetes and LM Containers Key Concepts and Terms
- Kubernetes Monitoring Considerations and Required Permissions
- Resource Sizing for Performance Optimization and Tuning Recommendations
- LM Container Installation
- LM Container Upgrade
- LM Container Uninstallation
- Existing Configuration Migration
- Kubernetes Events and Pod Logs Collection
-
Resource Monitoring
- Monitoring Helm Charts Releases
- Kubernetes Core Components Monitoring
- Monitoring Kubernetes Clusters with kube-state-metrics
- Filtering Kubernetes Resources for Monitoring
- NGINX Ingress Controller Monitoring
- Kubernetes Certificates and cert-manager Monitoring
- Disabling Alerts on Kubernetes Resources
- Default Filtering for Kubernetes Resources
- Filtering Kubernetes Resources using Labels, Annotations, and Selectors
- Disabling Resources from Monitoring
- Retention of Deleted Kubernetes Resources using LM Containers
- Retaining Deleted Kubernetes Resources
- Advanced Configuration
- Monitor Supported Resources
- Topology for Kubernetes Cluster
- Kubernetes Cluster Monitoring as Non-Admin User
- Troubleshooting Kubernetes Monitoring
- Docker Monitoring
-
LM APM
- LM APM Overview
- Quick Steps to Setup LogicMonitor APM
-
Push Metrics
- Getting Started with Push Metrics
- Use Cases for Push Metrics
- About the Push Metrics REST API
- Ingesting Metrics with the Push Metrics REST API
- Python SDK for Push Metrics API
- .NET SDK for Push Metrics API
- Managing Resources that Ingest Push Metrics
- Rate Limiting for Push Metrics
- Updating Instance Properties with the Push Metrics REST API
- Updating Resource Properties with the Push Metrics REST API
- OpenMetrics Integration
-
Distributed Tracing
- Distributed Tracing Overview
- Application Authentication Overview
- Traces Page
- Application Instrumentation for LogicMonitor
- Trace Data Forwarding to LogicMonitor
- OpenTelemetry Collector for LogicMonitor Overview
- Synthetics
-
Monitoring Solutions
- Apache
- APC
- AI Monitoring
- Atlassian
- AWS
- Azure
- Broadcom
- Cato Networks
- Checkpoint
-
Cisco
- Cisco APIC Monitoring
- Cisco ASA/ASR
- Cisco Catalyst Center
- Cisco Catalyst SD-WAN Monitoring
- Cisco CUCM API Monitoring
- Cisco Device SNMP and NTP Configuration
- Cisco Firepower Chassis Manager Monitoring
- Cisco Firepower Threat Defense Monitoring
- Cisco Hyperflex Monitoring
- Cisco Intersight Monitoring
- Cisco IP SLA Monitoring
- Cisco ISE Monitoring
- Cisco Meraki Monitoring
- Cisco UCCX Monitoring
- Cisco UCS Monitoring
- Cisco UCS X Monitoring
- Cisco Unified Call Manager (CUCM) Monitoring
- Cisco VoIP Monitoring
- Cisco Wireless Monitoring
- Citrix
- Cohesity
- Common Config
- CommVault
- ConnectWise
- Couchbase Server
- Dell Technologies
- Email Service
- Extreme Networks
- F5
- FreeBSD
- Fortinet
- HPE
- IBM
- IMPI
- Infinidat
- Infoblox
- Java
- Jenkins
- Juniper
- Kemp
- Kubernetes
- Linux
- LogicMonitor
- LSI MegaRAID Controller
- Microsoft
- MongoDB
- NetApp
- Network Traffic Monitoring
- NTP
- Nutanix Systems
- OpenAI
- Oracle
- Palo Alto Networks
- Panzura
- Perfmon Access
- Pick
- Puppet
- Pure Storage
- Quantum
- RabbitMQ
- Redis
- Rubrik
- Ruckus
- SAP
- Slack
- SSL
- SNMP
- Sonicwall
- SumoLogic
- SwiftStack
- Ubiquiti
- Unomaly
- Varnish
- Veeam
- Versa SD-WAN
- Mobile
-
Developer
-
LogicMonitor REST API
-
REST API Overview
- Using LogicMonitor's REST API
- Migration to LogicMonitor REST API v3
- REST API Change Log
- REST API Authentication
- REST API Status Codes
- REST API Error Codes
- REST API Rate Limit
- REST API Troubleshooting
-
REST API v3
- REST API v3 Swagger Documentation
- LogicMonitor v3 SDK
- REST API Basic Filters
- REST API Advanced Filters
- Creating Services Using LogicMonitor REST API v3
- Delta Support for device/devices API
- Best Practices for Migrating to LogicMonitor v3 SDK
-
REST API v3 Endpoints
- Managing Alerts
- Managing Alert Rules
- Managing Cost Optimization Recommendations
- Managing Recipient Groups
- Managing Roles
- Managing Ops Notes
- Managing Report Groups
- Managing Dashboard Groups
- Managing Collector Groups
- Managing ConfigSources
- Managing EventSources
- Managing Collector Debug Command
- Managing Collector Version
- Managing NetScan
- Managing PropertySources
- Viewing Metrics
- Viewing Integration Audit Logs
- Viewing External APIs
- Managing AppliesToFunction
- Managing Devices
- Managing DataSources
- Managing Escalation Chains
- Managing API Tokens
- Managing DataSource Instances
- Managing Dashboards
- Managing Users
- Managing Audit Logs
- Managing Data
- Managing Access Group
- Managing OIDs
- Managing Device Groups
- REST API v2
-
REST API v1
- REST API v1 Overview
- Getting Data with the REST API
-
REST API v1 Endpoints
- Managing Alert Rules
- Managing Alerts
- Managing API Tokens
- Accessing Audit Logs
- Managing Collectors
- Managing Collector Groups
- Managing Dashboards and Widgets
- Managing Dashboard Groups
- Managing DataSources
- Managing DataSource Instances
- Managing Devices
-
Managing Device Groups
- About the Device Group Resource
- Add a Device Group
- Add Device Group Properties
- AWS Device Groups
- Azure Device Groups
- Delete Device Group Properties
- Delete a Device Group
- GCP Device Groups
- Get all alerts for a Device Group
- Get all SDTs for a Device Group
- Get Device Group Properties
- Get Device Groups
- Get devices for a particular device group
- Update a Device Group
- Update Device Group Properties
- Managing Escalation Chains
- Managing Ops Notes
- Managing Reports
- Managing Report Groups
- Managing Roles
- Managing SDTs
- Managing Websites
- Managing Website Groups
- Getting Websites Test Locations
- Managing Thresholds
- Managing Users
-
REST API Overview
- Scripting Support
-
LogicMonitor REST API
- Policies and Compliance
- Training and Education
-
Legacy UI
- Getting Started
- Devices
- Dashboards and Widgets
- AIOps
- LM Service Insights
- LogicModules
- Terminology and Syntax
- LM APM
-
Cloud Monitoring
-
Getting Started with LM Cloud
- LM Cloud Monitoring Overview
- Enabling Cloud Monitoring using Local Collector
- Visualizing your cloud environment with auto dashboards and reports
- Setting up custom event integrations
- Monitoring Cloud Service Limit Utilization
- Optimizing your Cloud Spend
- Cloud Data Collection
- Amazon Web Services Monitoring
- Google Cloud Platform Monitoring
- MongoDB Atlas Monitoring
-
Getting Started with LM Cloud
- Container Monitoring
- Monitoring Solutions
Rolling out through the middle of March, v.116 continues to expand the reach of LM Cloud with monitoring additions and enhancements for AWS, Azure, and GCP. Other v.116 highlights include integration with ServiceNow CMDB, more robust integration with PagerDuty, Kubernetes monitoring improvements, and several UI updates.
NEW! NetFlow Widget
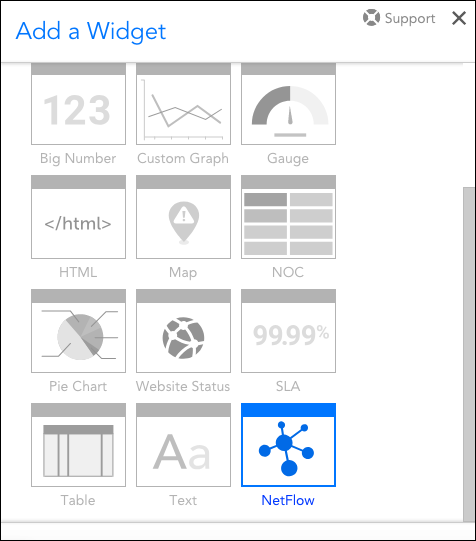
A configurable NetFlow widget is now available for your dashboards! Previously, NetFlow data could only be added to dashboards by manually adding the tables, graphs, and pie charts available from the Traffic tab found on the Resources page.
The new NetFlow widget is available as a new widget type from the Add a Widget dialog, with options to create any of the views currently visible under the Traffic tab. Users can update an existing NetFlow widget to point to a new resource at any time, and the Widget Title and Device fields both accept tokens, allowing for dashboard-wide changes and replication. Finally, NetFlow views added manually from a resource are automatically made configurable, and feature the same options as those added from a dashboard.
NEW! ServiceNow CMDB Integration
In addition to the existing ITSM integration, LogicMonitor now offers an out-of-the-box integration with ServiceNow CMDB (available as a premium, add-on feature). This new integration provides a robust baseline code that can easily be built upon to customize and fit the needs of any IT environment.
Key features of this new integration include bi-directional data synchronization to ensure a reliable and up-to-date CMDB, and enriched alerting data for quicker mean-time-to-resolution for incidents critically affecting business. By integrating LogicMonitor and ServiceNow CMDB, customers gain full visibility into their IT ecosystems, from infrastructure to applications. The certified LogicMonitor CMDB Integration app is available on the ServiceNow Store.
Other v.116 Enhancements
Dashboards
- Instance limits increased for several dashboard widgets. The Custom Graph, Big Number, and NOC widgets can now pull in up to 5000 instances each, increased from their previous maximums of 2000 instances. This is part of an ongoing effort to raise instance limits across all widgets and reports.
Integrations
- PagerDuty integration now incorporates machine learning and response automation features. Using LogicMonitor’s out-of-the-box PagerDuty integration, alerts can now generate PagerDuty events that take advantage of advanced PagerDuty capabilities such as intelligent real-time decisions and automated precision response. For more information on integrating with PagerDuty (or upgrading your existing PagerDuty integration to leverage these new features), see PagerDuty Integration.
LM Cloud
- Amazon Web Services (AWS) monitoring improvements:
- Added monitoring for two AWS regions. Added monitoring support for AWS Paris (eu-west-3) and Stockholm (eu-north-1) regions.
- Improved non-HTTP Route53 health check alerting. Added new properties for Route53 to include meaningful information for non-HTTP Route53 health checks (e.g. CloudWatch alarm name). These properties will be used to make alerts more meaningful for non-HTTP Route53 health checks.
- Spot instances filtered out of EC2 service limits collection. The AWS EC2 service limits DataSource was counting spot instances towards the on-demand limit. This has been corrected.
- Azure firewall monitoring. LogicMonitor now discovers and monitors metrics (application rules hit count, network rules hit count) for Azure firewalls.
- Google Cloud Platform (GCP) monitoring improvements:
- GCP VPN gateway monitoring. Added support for discovering and monitoring GCP VPN gateways. VPN tunnels are additionally discovered for each gateway, and metrics are collected at the tunnel level.
- GCP HTTPS load balancer monitoring. Added support for discovering and monitoring GCP HTTPS load balancers.
- Improved resiliency for GCP data collection. Previously, a configuration error in one datapoint for a GCP DataSource prevented successful data collection for all other datapoints, even if they were configured correctly. With v.116, LogicMonitor has made improvements to ensure that one misconfigured datapoint does not break data collection for other successfully configured datapoints in the DataSource.
- GCP filter validation. Errors will now display if datapoint filters for GCP (Stackdriver) data collection are not formatted correctly. This is helpful when modifying datapoints (e.g. tweaking a datapoint to get a different aggregation).
- Local Collector configuration removed for event data collection. Over the past few releases, all cloud event data collection (e.g. AWS, Azure, and GCP service disruptions) has been migrated to a LogicMonitor-maintained cloud Collector. As such, there is no longer a need for users to select local Collectors for event data collection and the configuration from the New Cloud Account wizard (and cloud account Manage dialog) that prompts a local Collector selection for event data collection has been removed.
LM Container
- Kubernetes node hostnames substituted for missing internal IPs. Kubernetes nodes are now added in by hostname if an internal IP is missing. Previously, a missing internal IP could cause errors.
- Kubernetes resource count broken out in resources tree. Kubernetes resource counts are now broken out from the standard device count that displays in the header of the resources tree. Along with cloud resources, Kubernetes resources now have their own category (e.g. “(261 devices / 211 cloud resources / 8 kubernetes resources)”). This provides visibility into Kubernetes resource counts for users that don’t have access to the Settings page.
LogicModules
- Hyphens no longer allowed in AppliesTo function names. User-defined AppliesTo functions can no longer be created with hyphens (-) in their names. Existing AppliesTo functions with hyphens in their names will continue to work in any AppliesTo fields in which they’ve previously been entered, but they cannot be newly entered without first being renamed. In a future release, any remaining AppliesTo functions containing hyphens in their names will be automatically migrated. This will help us optimize the backend code that evaluates AppliesTo and matches LogicModules with devices.
User Interface
- “Platform” column added to Collectors page. A new column titled “Platform” now displays on the Collectors page to denote Collector CPU architecture (e.g. Windows 64-bit, Linux 64-bit, etc.).
- SDT tab opens after a resource is put into scheduled downtime. After a resource is put into scheduled downtime using the Put in SDT button (found in the Resources page’s toolbar), the LogicMonitor UI will now automatically take users directly to the SDT tab for that resource.
- Improved Audit Log display. Lengthy descriptions for Audit Log entries are now truncated to provide a more friendly display. Truncated descriptions are indicated with a “Show more” hyperlink and can be expanded by clicking anywhere within the log entry.
LogicModule Releases
LogicModules that have been added or updated since the last release.
New Monitoring Coverage
- AWS Service Health – 1 DataSource
- Cisco NTP – 1 DataSource, 1 PropertySource
- EMC VNXe – 10 DataSources, 1 PropertySource
- Google Cloud Platform – HTTPS Load Balancer – 1 DataSource
- Kubernetes Topology – 3 PropertySources, 2 TopoSources
- Microsoft Azure Firewalls – 1 DataSource
Monitoring Improvements
- Citrix Application Trends – 1 DataSource
- Corrected issue with querying applications with large deployments
- GCP Service Health – 1 EventSource
- Data collection method change
- Kubernetes Pod – 1 DataSource
- Additional port compatibility
- Linux SSH CPU Cores – 1 DataSource
- Added support for Linux kernel versions 2.6.32 and older which did not support guest_nice stats
- VMware vCenter Datastore Performance – 1 DataSource
- Issue fixed in AD script that mismatched instance wildvalues, causing no data