Graphs Tab
Last updated - 24 July, 2025
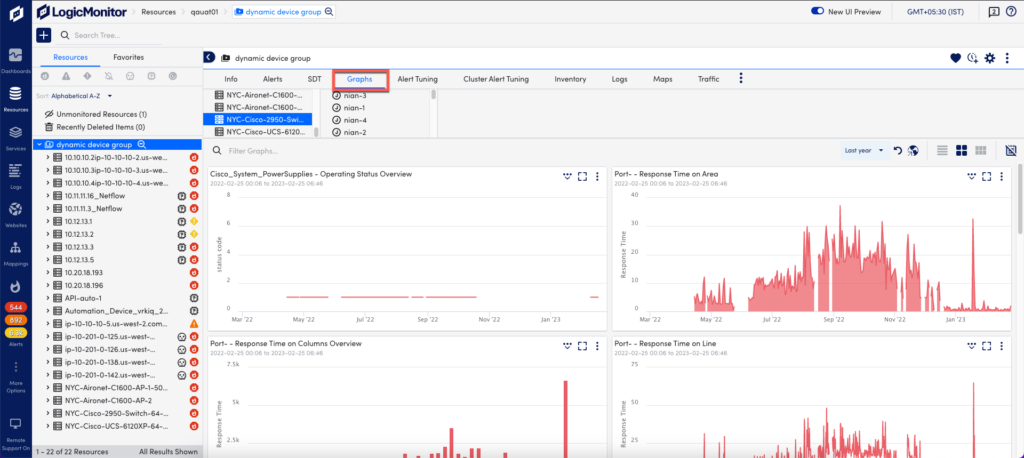
The Graphs tab is available on the Resources page and displays graphs based on DataSource and Instance data. To view, select the Resource and DataSource (or Instance) directly from the Resources Tree. This opens a horizontal navigation pane, which enables you to view graphs that exist at each level (Resource, DataSource, or Instance).
Graph Options
Each graph provides the following options:
| Icon | Option | Description |
| View Chart Full Screen | Opens the graph in a detailed, full screen mode. | |
| Add to Dashboard | Opens the Add to Dashboard window, where you can add the graph as a widget to a standard dashboard. Once added, the graph will no longer be tied to its originating DataSource graph. Rather, its configurations will be saved as a Custom Graph widget. | |
| View Legend | Displays the legend and allows you to select or deselect which graph lines to display. |
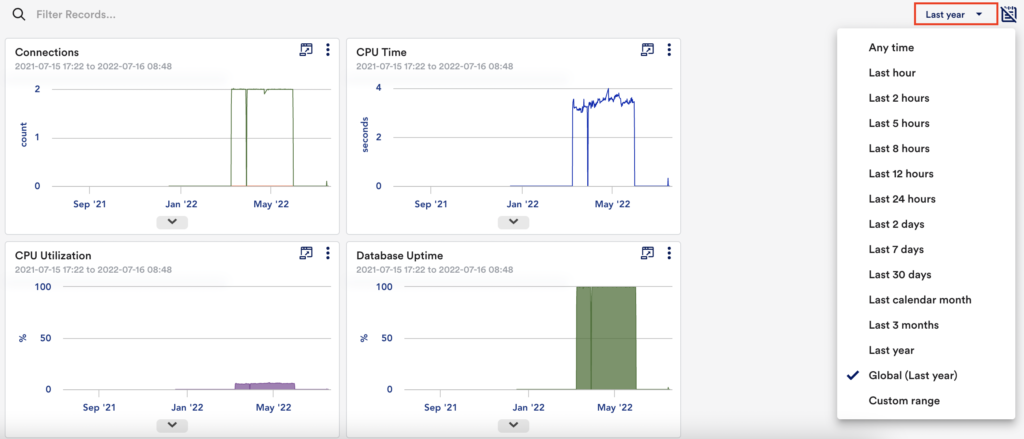
Time Range
Use the Time Range drop-down list to select the time range to include in the graph. For more information, see Changing the Time Range.
Full Screen Mode
When a graph is opened in full screen mode, there are additional options available.
| Option | Description |
|---|---|
| Enable Forecast Overlay. On/off toggle that enables the chart to include forecast (future) data. For more information, see Data Forecast Visualization. | |
| Download CSV. Allows you to download a CSV version of the graph’s data. | |
| Data | Displays the raw data associated with the graph in table format. |
| Ops Notes | Allows you to view and filter the Ops Notes associated with the graph. You also have the option to add a new Ops Note. For more information, see Using Ops Notes. |
| Forecast | Opens the Forecast panel, where you can view Datapoint, Collected Data, and Forecast Data when it’s available. For more information, see Data Forecast Visualization. |
Note: You can also view anomaly detection. For more information, see Anomaly Detection Visualization.
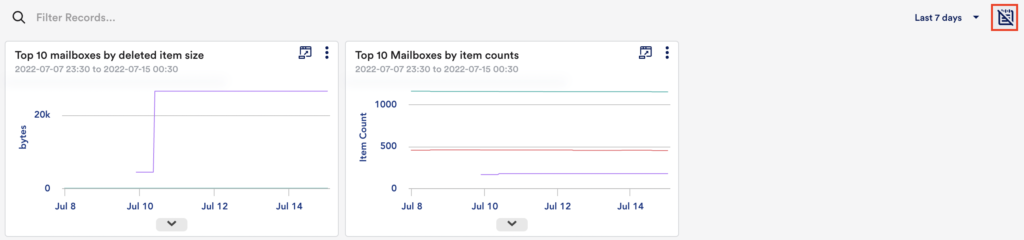
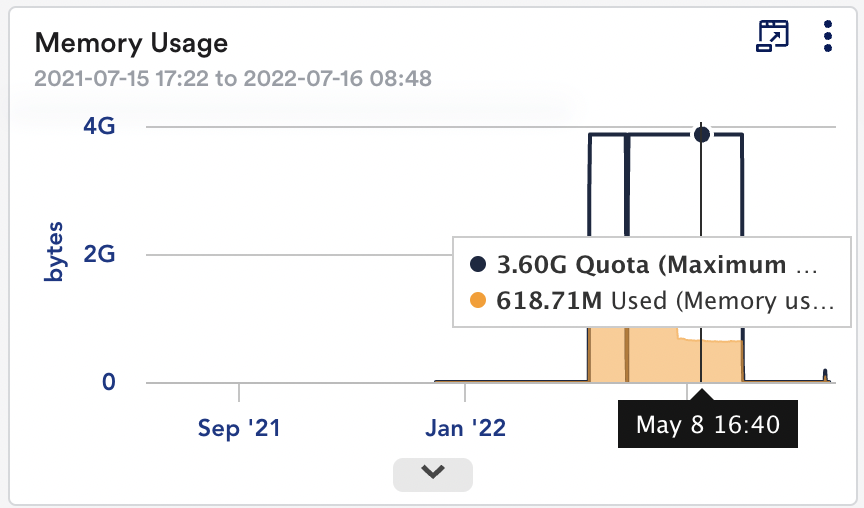
Graph Hover for Multiple Values
Hover over the graph to display the names and values of multiple datapoints or instances. Hovering over a graph will cause corresponding vertical lines to appear across all graphs in the current view. This is useful for correlating events across multiple related graphs.
Show or Hide Ops Notes
Use the Show/Hide Ops Notes toggle to view the Ops Notes associated with the graph. For more information, see Using Ops Notes.