
Pie Chart Widget
Last updated - 24 November, 2025
Whether your business measures success based on the current value of a single metric, the aggregate value of metrics across devices, a value from your database, or a combination of any of the above, you can represent it in an at-a-glance view with the Pie Chart or Donut Chart widget.
Configuring a Pie Chart widget involves a process similar to the following:
- Selecting the datapoints you want represented in the widget
These can be datapoint values on a single instance or across multiple instances.
In addition, you can create virtual datapoints to change units of measure, combine values, or perform a function on the value prior to display, as needed. - Adding the data you want represented in the widget.
You can add datapoints, resource counts, and virtual datapoints. - Choosing how you want the data displayed and how much of the data you want displayed
You can choose either a pie or donut visualization, whether or not you want the labels and lines displayed in the chart, and whether to display all the data or a specific amount.
Configuring a Pie Chart Widget
- In LogicMonitor, navigate to Dashboards, select a current Dashboard or create new, and then add a Text widget.
For more information, see Dashboard Creation.
For more information, see Widget Creation. - Configure the Basic Information section.
For more information, see Configuring Standard Widget Settings.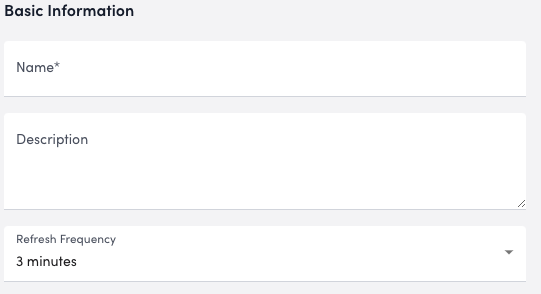
- In the Datapoints settings, select Add Record to configure and add datapoints, resource counts, or virtual datapoints.
You can add as many datapoints to the widget as needed. Select Apply after each datapoint you configure.
For more information, see Widget Datapoint Configurations.
Note: You must have at least one datapoint added to the widget to add a virtual datapoint.
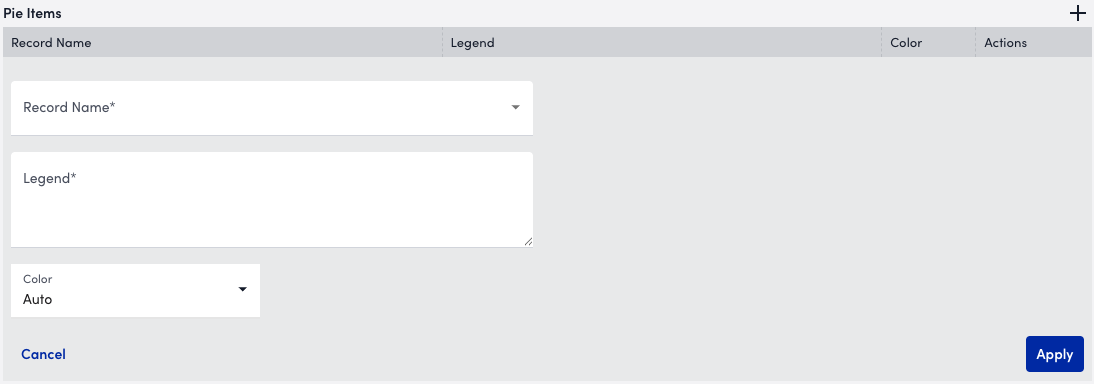
- In the Pie Items section, select Add Record to configure and add an item to the widget, and then do the following:
- From the Record Name dropdown, select a record name to add as a datapoint to your pie chart.
- In the Legend field, enter a unique name for the pie item to be identified in the widget legend.
- From the Color dropdown, select a color you want representing the datapoint in the chart.
- Select Apply.
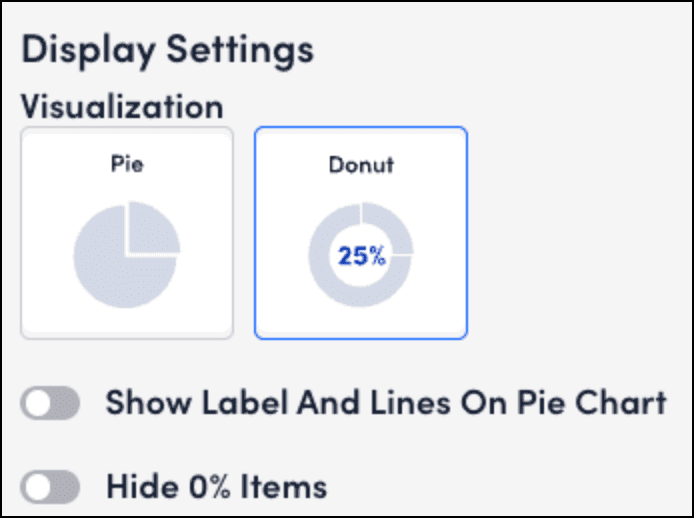
- From the Display Settings, configure how you want the widget to display on your dashboard by doing the following:
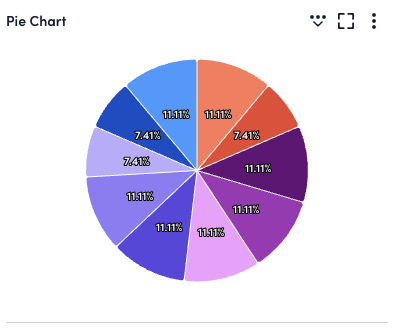
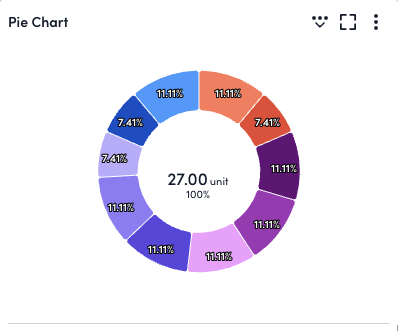
- From the Visualization settings, select whether you want the data displayed in a pie chart or a donut chart.
- To display the legends as labels connected to the chart with lines, toggle on the Show Label And Lines On Pie Chart switch.
- To hide any datapoints that are 0% of the total chart, toggle on the the Hide 0% Items switch.
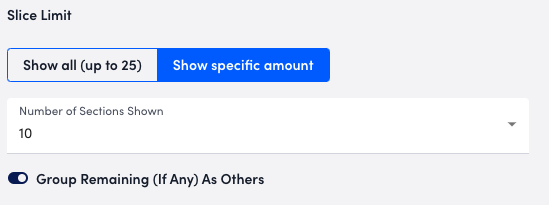
- In the Slice Limit section, do one of the following for displaying the slices:
- To show all slices in the pie chart, select Show all (up to 25).
- To show a specific number of pie slices, select Show specific amount, and do the following:
- From the Number of Sections Shown dropdown, select the number of slices to display in the chart.
- To group any remaining slices in the chart as “other”, toggle on Group Remaining (If Any) As Others switch.
- Configure the Widget Color Schema settings.
For more information, see Configuring Standard Widget Settings. - Select Save.
The Pie Chart widget displays on your dashboard.
Pie Chart Widget Interaction
There are various actions you can perform on a Pie Chart widget that is added to a Dashboard. This provides you with more flexible actions when interacting with widgets, enabling you to engage in active troubleshooting more efficiently. For example, you can select a specific slice of the pie chart and navigate directly to the corresponding Resources in the Resource Tree to view the data for that instance. You can perform the following actions for a Pie Chart widget:
- Hide slice—Hide the selected slice from the chart.
- Go to Resources—Navigate directly to Resources to view the data for the specific datapoint in the Resource Tree.
- Apply to filters—Apply a dashboard-level filter. This filter applies to all applicable widgets on the Dashboard.
- Go to Logs—Navigate directly to Logs to view the data for the specific resource in the Logs page.
To access these actions, select a slice on the graph. The interaction options display for that line.
