
Webhook LogSource Configuration
Last updated - 19 May, 2026
In LogicMonitor, Webhook LogSources enable external platforms to push event-based data directly into LogicMonitor for log ingestion.
For more information on how LogSources work, see LogSource Configuration Guide.
Webhook messages are formatted in JSON. The LogSource configuration enables you to do the following:
- Define key-value mappings from JSON payloads
- Use regular expressions (regex) to capture dynamic values from log messages
- Apply regex groups to extract multiple values for log fields or resource mappings
Include Filters
You can add filters to include resources of certain types, such as an application. The output matching the filter criteria will be forwarded to the log ingestion process.
The following table details the available parameters:
| Attribute | Comparison Operator | Value Example | Description |
| SourceName | Equal, NotEqual, Contain, NotContain, RegexMatch, RegexNotMatch | Meraki+CustomerA | Filters logs based on the sourceName value included in the webhook message. Useful for distinguishing logs from multiple sources. |
| OrganizationName | Equal, NotEqual, Contain, NotContain, RegexMatch, RegexNotMatch, Exist, NotExist | Customer_XYZ_Org | Filters logs by the organization name attribute in the webhook payload. This helps isolate logs from specific business units. |
| Message | Equal, NotEqual, Contain, NotContain, RegexMatch, RegexNotMatch | “Authentication failed” | Filters logs based on the content of the message field, enabling inclusion or exclusion of specific event types. |
Log Fields
You can configure Log Fields (tags) to send additional metadata with the logs. The following table details the available parameters:
| Method | Key example | Value example | Description |
| Static | Customer | Customer_XYZ | Attaches a fixed key-value pair to every log processed by the LogSource, ensuring consistent metadata tagging. |
| Dynamic(Regex) | Host | host=* | Extracts metadata by running a regex query on the message field. Useful for pulling values like hostnames or service names. |
| Dynamic Group Regex | Scheme, Login | (https*):\/\/([a-z]+) | Extracts multiple values from a single regex expression using groups, with each captured group mapped to a separate key.This method is particularly useful for capturing log fields from nested JSON. While standard Webhook Attributes can capture fields directly by their JSON field name, if the required data is nested inside a JSON array, you must use Dynamic Group Regex to extract it. |
| Webhook Attribute | SourceName | Meraki+CustomerName | Directly maps a JSON field included in the webhook payload (for example, sourceName) to a log field. Useful for differentiating webhook sources. |
Resource Mappings
Configure the log property to match a monitored resource. The following table details the available mappings:
| Method | Key example | Value example | Description |
| Static | Customer_Id | 1921 | Maps all webhook events from this LogSource to a specific monitored resource by applying a fixed key-value pair. Useful for tagging logs from a known source. |
| Dynamic(Regex) | system.ServiceName | service=* | Extracts resource identifiers (for example, service name) from the webhook payload using a regex applied to the message field. |
| Dynamic Group Regex | Scheme, Login | (https*):\/\/([a-z]+) | Captures multiple values from a webhook payload using regex groups. Each group is mapped to a separate resource property. |
| Webhook Attribute | auto.endpoint.serial_number | deviceSerial (where deviceSerial is a Webhook Attribute for Cisco Meraki) | Directly maps a property from the webhook payload (for example, device serial number) to a monitored resource in LogicMonitor. |
Requirements for Configuring a Webhook LogSource
To configure a Webhook LogSource, you must have a single Bearer Token or API Token included in the HTTP header of the webhook.
For more information on the requirements, see Webhook Events as Logs.
Configuring a Webhook LogSource
- In LogicMonitor, navigate to Modules > My Module Toolbox.
- Select
 Add.
Add. - In the Add modal, select LogSource.
- In the Name field, enter a descriptive and unique name for the source of the webhook logs.
- In the Description field, enter an appropriate description for the webhook LogSource.
This provides additional context to help you understand the purpose and configuration details of the LogSource. - In the Tags field, search for tags, also referred to as log fields) you want to assign to your LogSource.
Note: Tags are metadata fields used for filtering, grouping, and automation. For more information about tags, see the Log Fields table provided in this document.
- In the Group field, select one or more groups that best categorize the LogSource.
Groups reflect the function, location, or environment of the log origin. - Use the Technical Notes field to provide detailed reference information that may assist with troubleshooting or maintenance.
- Toggle the Show preview of rendered technical notes switch to view how markdown-formatted content displays when rendered.
- Select “LM Logs: Webhook” from the Type Dropdown menu.
- Add Access Groups to enable who can view, manage, and interact with the logs.
For more information, see Access Groups.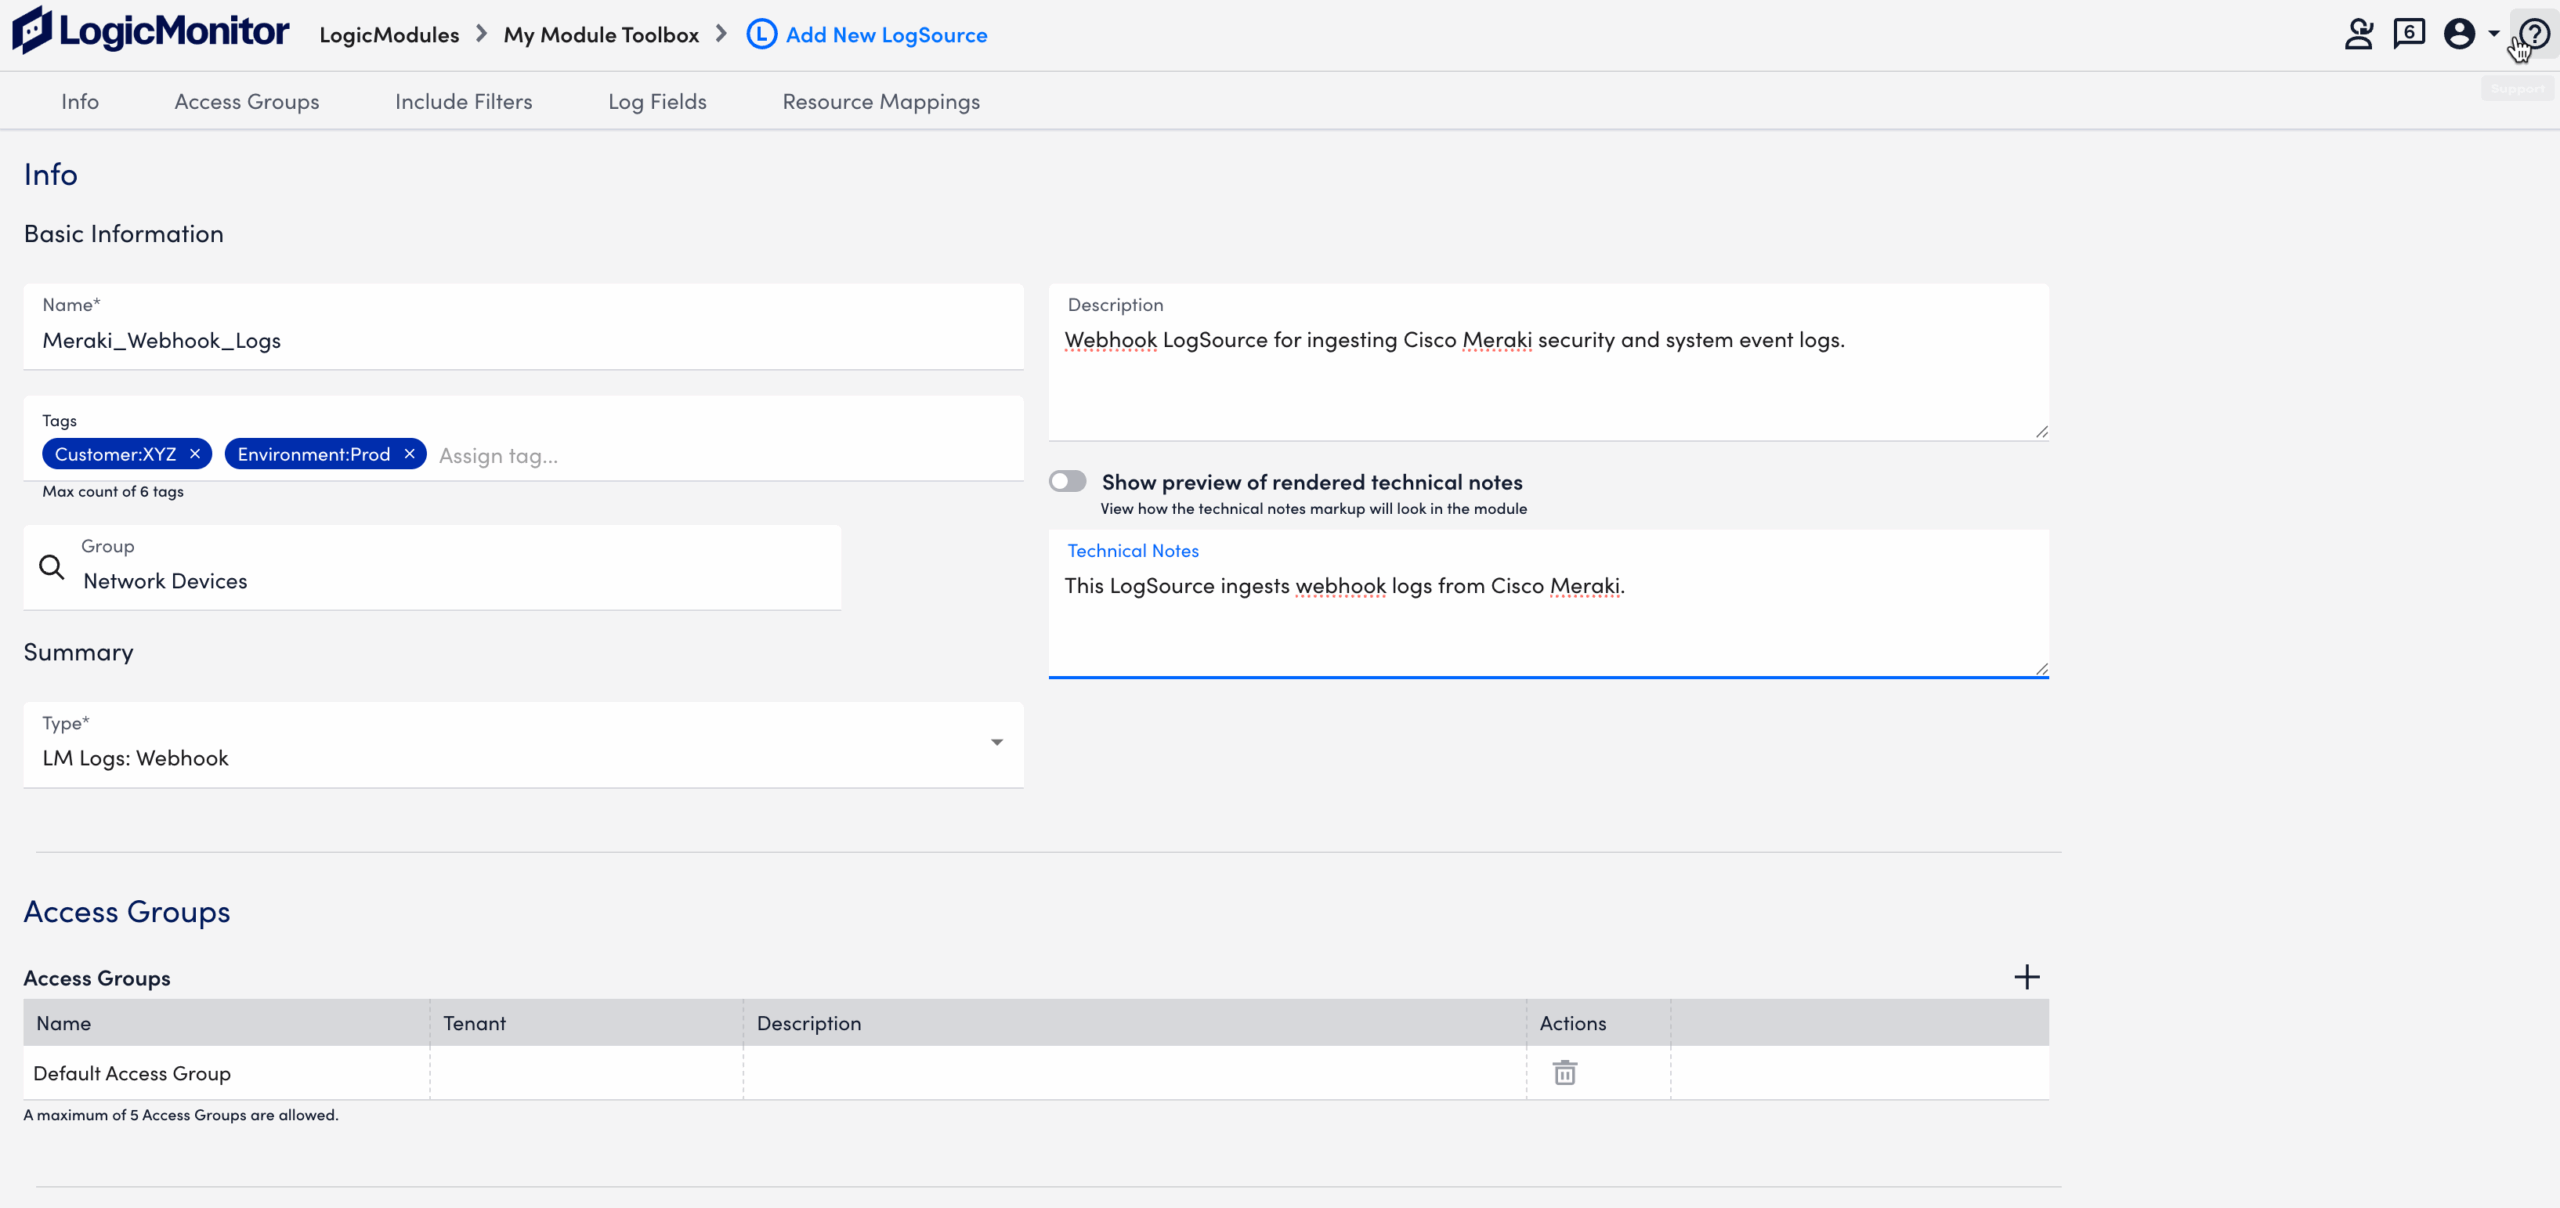
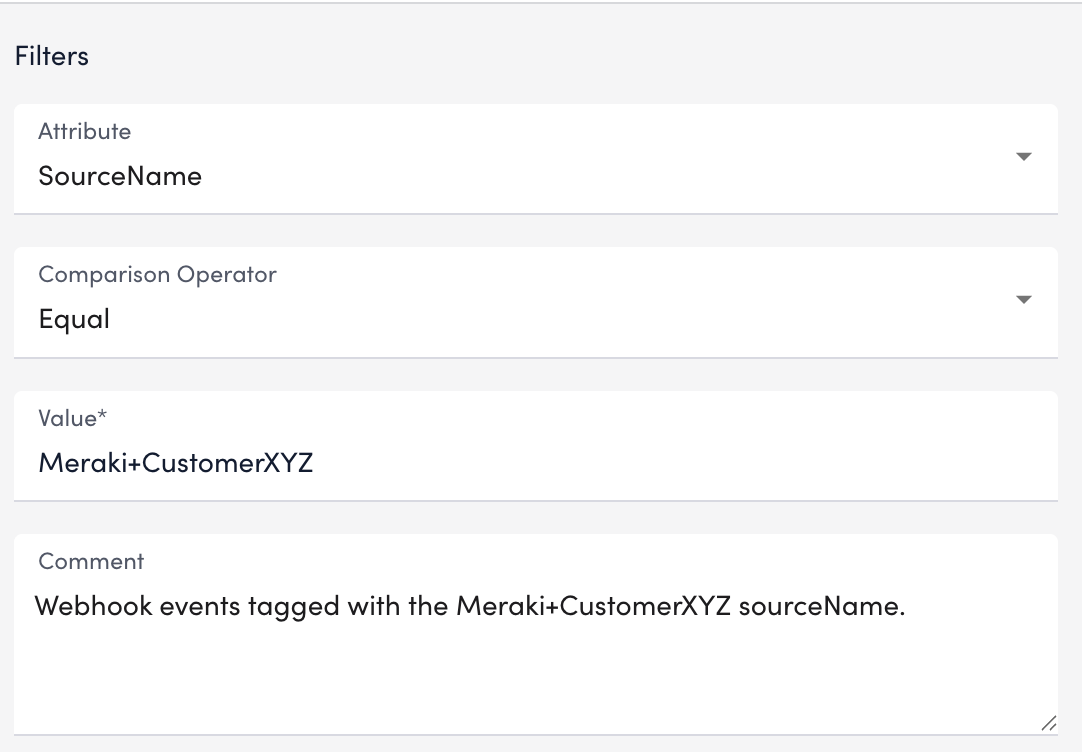
- Add Filters using the available parameters.
To add a filter, do the following:- Toggle the switch thing to determine the operators for the filters.
- Select Add Filter.
- From the Attribute dropdown, select the attribute you want to use for the filter.
- SourceName – Filters based on the sourceName value in the webhook payload.
- OrganizationName – Filters by the organization attribute included in the payload.
- Message – Filters based on the content of the log message itself.
- From the Comparison Operation, select the operator you want to use to do whatever with the filters.
- Equal/NotEqual – Exact value match.
- Contain/NotContain – Matches substrings within the field.
- RegexMatch/RegexNotMatch – Matches patterns using regular expressions.
- Exist/NotExist – Checks whether the attribute is present in the payload.
- In the Value field, provide the value to match against the selected attribute.
- Add details in the Comment field.
- Select Save
 .
.
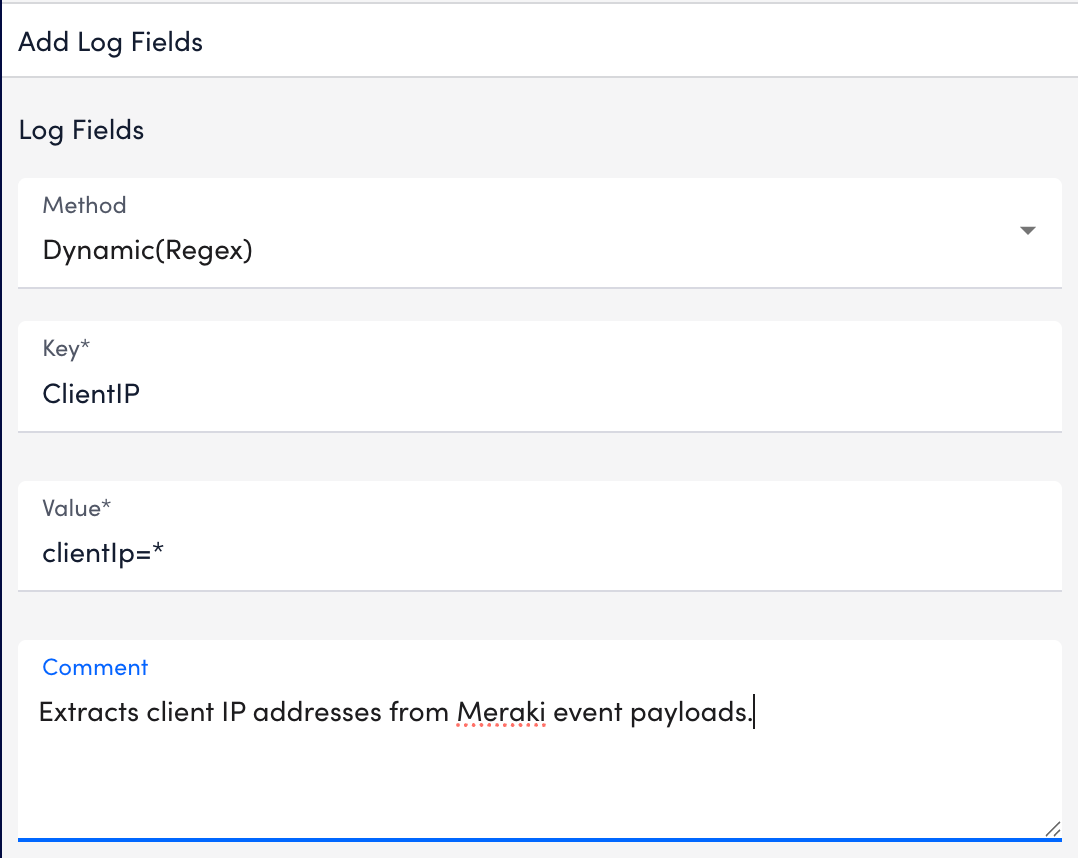
- Define Log Fields to attach metadata.
To add a log field, do the following:- Select Add Field. it opens a new log field row for configuration.
- From the Method dropdown, choose how the log field should be defined:
- Static – Attaches a fixed key-value pair to every log.
- Dynamic (Regex) – Uses a regex query on the message field to extract a single dynamic value.
- Dynamic Group Regex – Captures multiple values from a regex expression using groups, with each group mapped to a separate key.
- Webhook Attribute – Maps a value directly from the webhook payload.
For example, consider the following webhook payload:From this payload, you can attach the following fields as metadata:{ "eventId": "evt-12345", "severity": "critical", "timestamp": 1708179200, "device": { "name": "router-01", "ip": "10.0.0.15" }, "tags": ["network", "core", "production"], "acknowledged": false }- severity
- eventId
- device (object)
- tags (array)
- acknowledged (boolean)
- Enter a name in the Key field. The key is the name of the metadata field you want to create. For example,
ClientIP - Provide the corresponding value in the Value field, based on the method you selected.
- Add details in the Comment field if additional context is required.
- Select Save .
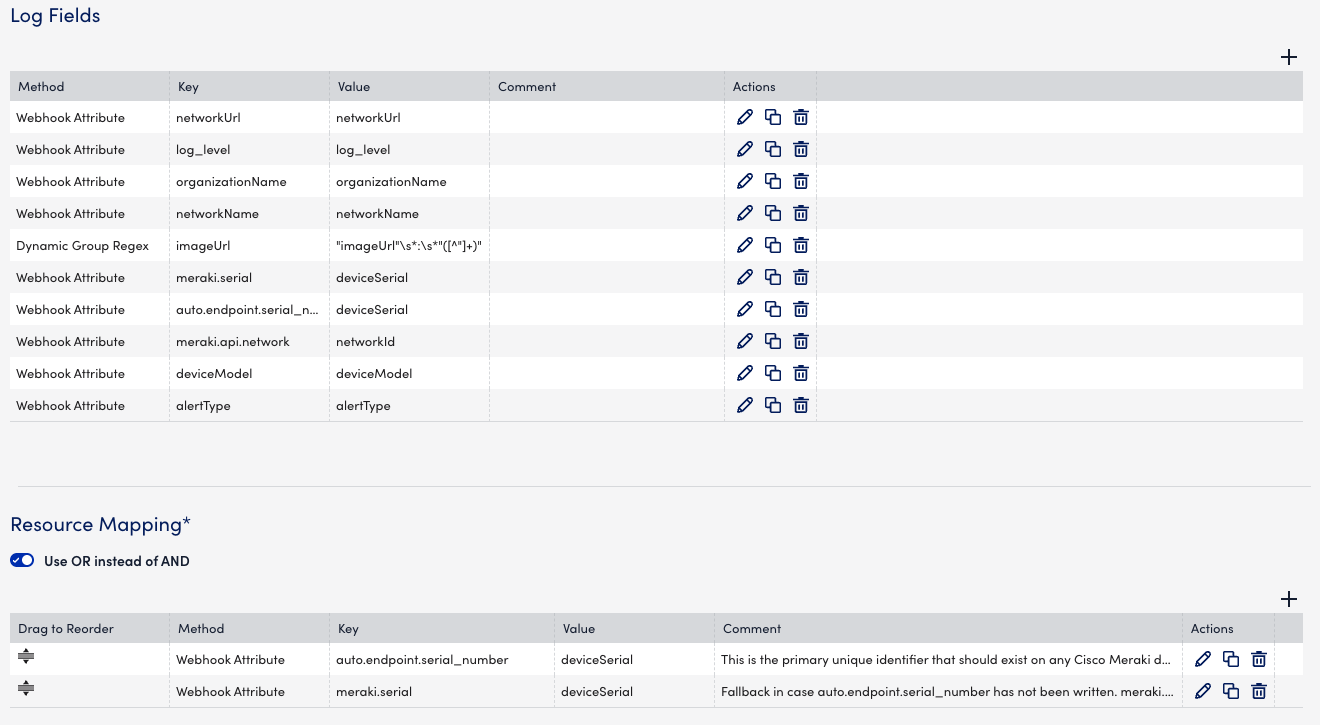
- Set up Resource Mappings to associate logs with monitored devices.
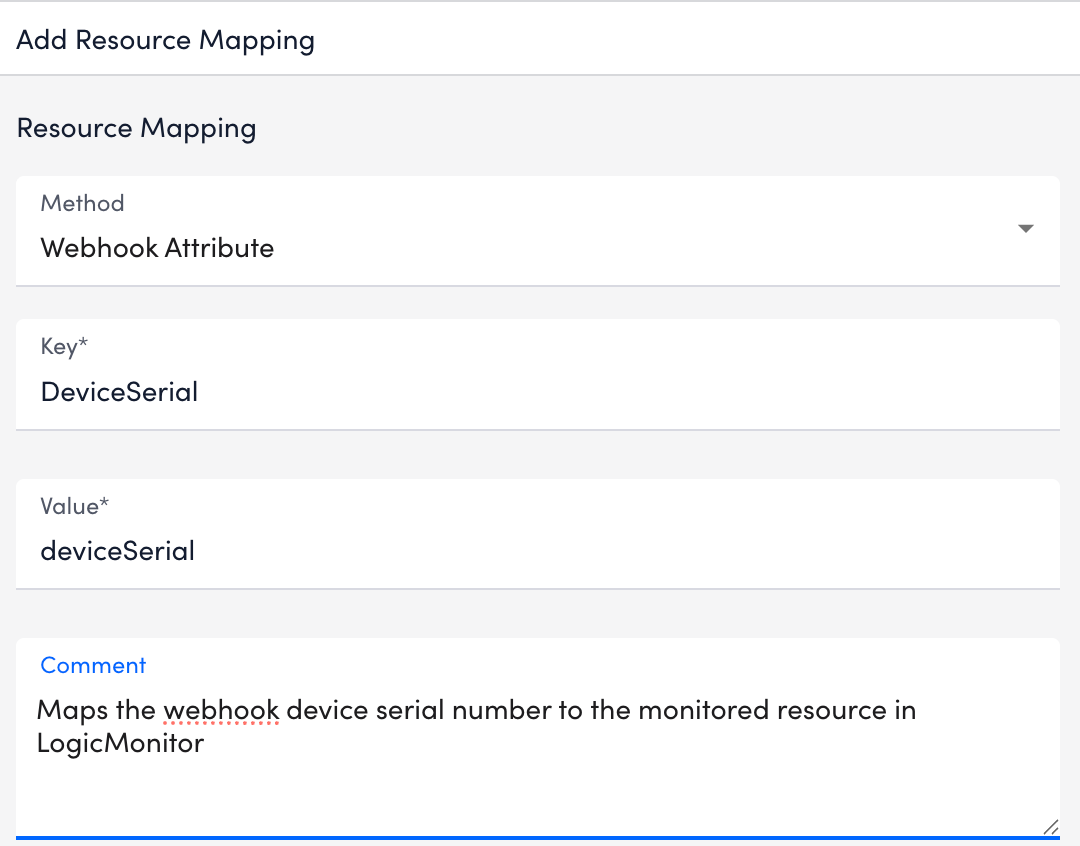
To add a mapping in the Resource Mappings, do the following settings:- Select Add Resource Mappings.
- From the Method dropdown, choose how the log field should be defined:
- Static – Attaches a fixed key-value pair to every log.
- Dynamic (Regex) – Uses a regex query on the message field to extract a single dynamic value.
- Dynamic Group Regex – Captures multiple values from a regex expression using groups, with each group mapped to a separate key.
- Webhook Attribute – Maps a value directly from the webhook payload.
- Enter a name in the Key field. For example, DeviceSerial.
- Enter the corresponding value in the Value field, based on the method you selected.
- Add details in the Comment field if additional context is required.
- Select Save .
- Select Save.
