Release Note


PRODUCT DOCUMENTATION
-
LogicMonitor Platform
- Introduction to LogicMonitor
- In-App Resources
-
Account Information
- Portal Information
- Portal Settings
- Financial
-
Usage Reporting
- Usage Reporting Overview
-
Product-Specific Usage Reporting
- Usage Reporting for APM Metrics
- Usage Reporting for LM Logs
- Usage Reporting for SaaS Monitoring
- Usage Reporting for IaaS Monitoring
- Usage Reporting for PaaS Monitoring
- Usage Reporting for APM Traces
- Usage Reporting for APM Synthetics
- Usage Reporting for Devices
- Usage Reporting for Websites
- Usage Reporting for Wireless Access Points
- Audit Logs
- Ops Notes
- Security Settings
- User Access
- Collectors
-
Dashboards
- Dashboards Overview
- Dashboard Creation
- Modern Dashboards
- Adding Dashboard Groups
- Finding Dashboards and Dashboard Groups
-
Widgets
- Widgets Overview
- Widgets Creation
- Widget Datapoint Configurations
-
Widget Types
- Alert List Widget
- Big Number Widget
- Netflow Widget
- NOC Widget
- Log Query Widget
- Pie Chart Widget
- Table Widget
- Text Widget
- Website Status Widget
- Custom Graph Widget
- SLA Widget
- Topology Map Widget
- Gauge Widget
- HTML Widget
- Job Monitor Widget
- Map Widget
- Resource Explorer Widget
- Recommendations Widget
- Billing Widget
- Widget Management
- Standard Widget Configurations
- Enabling Dashboard Text Widget Script Security
- Dashboard Management
- Dashboard Distribution
-
Resource Tree
- Navigating the Resources Page
- Changing the Time Range
- Remote Session
- Using Ops Notes
- Resources Details
- Resource Groups
- Resource Management
- NetScans
- Resource Explorer
- Services
- LM Uptime Overview
-
Websites
- Data Monitored for Websites
- Websites Page Overview
- Alerting on Websites Data
- Trace Route for Websites
-
Websites Management
- Websites Default Settings
- Web Check
- Ping Check
- Testing the Steps of a Web Check
- Creating a Website Dashboard
- Website Properties
- Website Management
- Executing Internal Web Checks using Groovy Scripts
- Web Checks with Form-Based Authentication
- Websites SDT
- Disabling External Website Testing Location Across your Account
- Understanding Website Status Codes
- Websites Groups
- Mappings
- Alerts
-
Reports
- Choosing a Report Type
- Creating a Report Group
- Shared Report Access
-
Report Types
- Alert Forecast Report
- Alert SLA Report
- Alert HealthCheck Report
- Alert Thresholds Report
- Alert Trends Report
- Alerts Report
- Audit Log Report
- Dashboard Report
- Interface Bandwidth Report
- Log Query Report
- NetFlow Resource Metric Report
- Resource Group Inventory Report
- Resource Inventory Report
- Resource Metric Trends Report
- Role Report
- SDT Inventory Report
- Server CPU Report
- Service Level Agreement Report
- User Report
- Website Overview Report
-
Modules
- Modules Overview
- Modules Installation
- Custom Module Creation
- Tokens Available in LogicModule Alert Messages
- Deprecated LogicModules
- Data Collection Methods
- Active Discovery
- Groovy Support
-
Module Configurations
- Types of Modules
- DataSource
- PropertySource
- AppliesTo
- SNMP SysOID Map Configuration
- JobMonitor
- ConfigSource
- TopologySource
- EventSource
-
LogSource
- LogSource Overview
- Configuring a LogSource
- Kubernetes Event Logging LogSource Configuration
- Kubernetes Pods LogSource Configuration
- Log Files LogSource Configuration
- Script Logs LogSource Configuration
- SNMP Traps LogSource Configuration
- Supported MIBs for SNMP Trap Translation
- Troubleshooting MIBs to JSON Converter Utility Issues
- Troubleshooting SNMP Traps Issues
- Modules Management
- Access Groups for Modules
- Security
-
LM Logs
- LM Logs Overview
- Log Ingestion
- Log Processing
- Logs Partition
- Log Anomaly Detection
- Log Analysis
- Viewing Logs and Log Anomalies
- Reset Log Anomaly Detection
- Log Patterns
- Log Query Language
- Log Processing Pipelines
- Log Alert Conditions
- Logs Roles and Permissions
- LM Logs Usage Data
- Troubleshooting Logs
-
Cloud Monitoring
- Introduction to Cloud Monitoring
- Cloud Services and Resource Units
- Monitored Locations for Cloud Monitoring
- Cloud Monitoring using a Collector for Existing Cloud Resources
- Monitoring Utilized Cloud Service Limits
- Custom Event Integrations Setup
-
Amazon Web Services Monitoring
- AWS Monitoring Setup
- AWS Organizational Unit Monitoring Setup
- Using StackSets to Automate Role and Policy Creation
- AWS Billing Monitoring Setup
- CloudWatch Costs Associated with Monitoring
- Managing your AWS devices in LogicMonitor
- AWS Tag Usage in LogicMonitor
- Active Discovery and AWS CloudWatch Metrics
- Customizing AWS CloudWatch DataSources
- Troubleshooting Custom AWS CloudWatch DataSources
- Microsoft Azure Monitoring
- Google Cloud Platform Monitoring
- MongoDB Atlas Monitoring
- Cost Optimization
- Cloud Data Collection with Poll Now
- SaaS Monitoring
-
Edwin AI
- Introduction to Edwin AI
- Key Concepts in Edwin AI
- Edwin AI Roles and Users
- Configure Edwin AI Dashboard
- Configure Edwin AI Models
- Configure Edwin AI Actions
- Edwin AI Rules
- Working with Edwin AI
- Export and Import Edwin AI Configuration
-
Edwin AI Integrations
- Edwin AI Integrations Overview
- Edwin AI Integration YAML File
- Edwin AI Monitoring Integrations
- Edwin AI IT Service Management Integrations
-
LM Integrations
- LogicMonitor Integrations Overview
- Navigating the Integration Page
- Communications Integrations
- Workflow Integrations
- Automation Integrations
- Custom Integrations for LogicMonitor
- Logs for LM Integrations
-
Container Monitoring
- About LogicMonitor Container Monitoring
-
Kubernetes Monitoring
- Support Matrix for Kubernetes Monitoring
- Kubernetes and LM Containers Key Concepts and Terms
- Kubernetes Monitoring Considerations and Required Permissions
- Resource Sizing for Performance Optimization and Tuning Recommendations
- LM Container Installation
- LM Container Upgrade
- LM Container Uninstallation
- Existing Configuration Migration
- Kubernetes Events and Pod Logs Collection
-
Resource Monitoring
- Monitoring Helm Charts Releases
- Kubernetes Core Components Monitoring
- Monitoring Kubernetes Clusters with kube-state-metrics
- Filtering Kubernetes Resources for Monitoring
- NGINX Ingress Controller Monitoring
- Kubernetes Certificates and cert-manager Monitoring
- Disabling Alerts on Kubernetes Resources
- Default Filtering for Kubernetes Resources
- Filtering Kubernetes Resources using Labels, Annotations, and Selectors
- Disabling Resources from Monitoring
- Retention of Deleted Kubernetes Resources using LM Containers
- Retaining Deleted Kubernetes Resources
- Advanced Configuration
- Monitor Supported Resources
- Topology for Kubernetes Cluster
- Kubernetes Cluster Monitoring as Non-Admin User
- Troubleshooting Kubernetes Monitoring
- Docker Monitoring
-
LM APM
- LM APM Overview
- Quick Steps to Setup LogicMonitor APM
-
Push Metrics
- Getting Started with Push Metrics
- Use Cases for Push Metrics
- About the Push Metrics REST API
- Ingesting Metrics with the Push Metrics REST API
- Python SDK for Push Metrics API
- .NET SDK for Push Metrics API
- Managing Resources that Ingest Push Metrics
- Rate Limiting for Push Metrics
- Updating Instance Properties with the Push Metrics REST API
- Updating Resource Properties with the Push Metrics REST API
- OpenMetrics Integration
-
Distributed Tracing
- Distributed Tracing Overview
- Application Authentication Overview
- Traces Page
- Application Instrumentation for LogicMonitor
- Trace Data Forwarding to LogicMonitor
- OpenTelemetry Collector for LogicMonitor Overview
- Synthetics
-
Monitoring Solutions
- Apache
- APC
- AI Monitoring
- Atlassian
- AWS
- Azure
- Broadcom
- Cato Networks
- Checkpoint
-
Cisco
- Cisco APIC Monitoring
- Cisco ASA/ASR
- Cisco Catalyst Center
- Cisco Catalyst SD-WAN Monitoring
- Cisco CUCM API Monitoring
- Cisco Device SNMP and NTP Configuration
- Cisco Firepower Chassis Manager Monitoring
- Cisco Firepower Threat Defense Monitoring
- Cisco Hyperflex Monitoring
- Cisco Intersight Monitoring
- Cisco IP SLA Monitoring
- Cisco ISE Monitoring
- Cisco Meraki Monitoring
- Cisco UCCX Monitoring
- Cisco UCS Monitoring
- Cisco UCS X Monitoring
- Cisco Unified Call Manager (CUCM) Monitoring
- Cisco VoIP Monitoring
- Cisco Wireless Monitoring
- Citrix
- Cohesity
- Common Config
- CommVault
- ConnectWise
- Couchbase Server
- Dell Technologies
- Email Service
- Extreme Networks
- F5
- FreeBSD
- Fortinet
- HPE
- IBM
- IMPI
- Infinidat
- Infoblox
- Java
- Jenkins
- Juniper
- Kemp
- Kubernetes
- Linux
- LogicMonitor
- LSI MegaRAID Controller
- Microsoft
- MongoDB
- NetApp
- Network Traffic Monitoring
- NTP
- Nutanix Systems
- OpenAI
- Oracle
- Palo Alto Networks
- Panzura
- Perfmon Access
- Pick
- Puppet
- Pure Storage
- Quantum
- RabbitMQ
- Redis
- Rubrik
- Ruckus
- SAP
- Slack
- SSL
- SNMP
- Sonicwall
- SumoLogic
- SwiftStack
- Ubiquiti
- Unomaly
- Varnish
- Veeam
- Versa SD-WAN
- Mobile
-
Developer
-
LogicMonitor REST API
-
REST API Overview
- Using LogicMonitor's REST API
- Migration to LogicMonitor REST API v3
- REST API Change Log
- REST API Authentication
- REST API Status Codes
- REST API Error Codes
- REST API Rate Limit
- REST API Troubleshooting
-
REST API v3
- REST API v3 Swagger Documentation
- LogicMonitor v3 SDK
- REST API Basic Filters
- REST API Advanced Filters
- Creating Services Using LogicMonitor REST API v3
- Delta Support for device/devices API
- Best Practices for Migrating to LogicMonitor v3 SDK
-
REST API v3 Endpoints
- Managing Alerts
- Managing Alert Rules
- Managing Cost Optimization Recommendations
- Managing Recipient Groups
- Managing Roles
- Managing Ops Notes
- Managing Report Groups
- Managing Dashboard Groups
- Managing Collector Groups
- Managing ConfigSources
- Managing EventSources
- Managing Collector Debug Command
- Managing Collector Version
- Managing NetScan
- Managing PropertySources
- Viewing Metrics
- Viewing Integration Audit Logs
- Viewing External APIs
- Managing AppliesToFunction
- Managing Devices
- Managing DataSources
- Managing Escalation Chains
- Managing API Tokens
- Managing DataSource Instances
- Managing Dashboards
- Managing Users
- Managing Audit Logs
- Managing Data
- Managing Access Group
- Managing OIDs
- Managing Device Groups
- REST API v2
-
REST API v1
- REST API v1 Overview
- Getting Data with the REST API
-
REST API v1 Endpoints
- Managing Alert Rules
- Managing Alerts
- Managing API Tokens
- Accessing Audit Logs
- Managing Collectors
- Managing Collector Groups
- Managing Dashboards and Widgets
- Managing Dashboard Groups
- Managing DataSources
- Managing DataSource Instances
- Managing Devices
-
Managing Device Groups
- About the Device Group Resource
- Add a Device Group
- Add Device Group Properties
- AWS Device Groups
- Azure Device Groups
- Delete Device Group Properties
- Delete a Device Group
- GCP Device Groups
- Get all alerts for a Device Group
- Get all SDTs for a Device Group
- Get Device Group Properties
- Get Device Groups
- Get devices for a particular device group
- Update a Device Group
- Update Device Group Properties
- Managing Escalation Chains
- Managing Ops Notes
- Managing Reports
- Managing Report Groups
- Managing Roles
- Managing SDTs
- Managing Websites
- Managing Website Groups
- Getting Websites Test Locations
- Managing Thresholds
- Managing Users
-
REST API Overview
- Scripting Support
- HAR File in LogicMonitor
-
LogicMonitor REST API
- Policies and Compliance
- Training and Education
-
Legacy UI
- Getting Started
- Devices
- Dashboards and Widgets
- AIOps
- LM Service Insights
- LogicModules
- Terminology and Syntax
- LM APM
-
Cloud Monitoring
-
Getting Started with LM Cloud
- LM Cloud Monitoring Overview
- Enabling Cloud Monitoring using Local Collector
- Visualizing your cloud environment with auto dashboards and reports
- Setting up custom event integrations
- Monitoring Cloud Service Limit Utilization
- Optimizing your Cloud Spend
- Cloud Data Collection
- Amazon Web Services Monitoring
- Google Cloud Platform Monitoring
- MongoDB Atlas Monitoring
-
Getting Started with LM Cloud
- Container Monitoring
- Monitoring Solutions
Rolling out through early November, LogicMonitor v.127 offers a new remote session protocol, as well as out-of-the-box monitoring for Azure HDInsight, GCP Pub/Sub Snapshots, Istio, Linux sensors, and more!
IN THIS RELEASE:
- Release Highlight: Remote session support for HTTP/S protocol
- Brand New Monitoring Coverage: Azure HDInsight, GCP Pub/Sub Snapshots, Istio, Linux sensors, and more!
- Other v.127 Enhancements: New “cleared” alert icon; important improvements to ConnectWise and F5 BIG-IP monitoring
- Looking Ahead: Integrations page (new!)
Release Highlight: Remote Session Support for HTTP/S Protocol
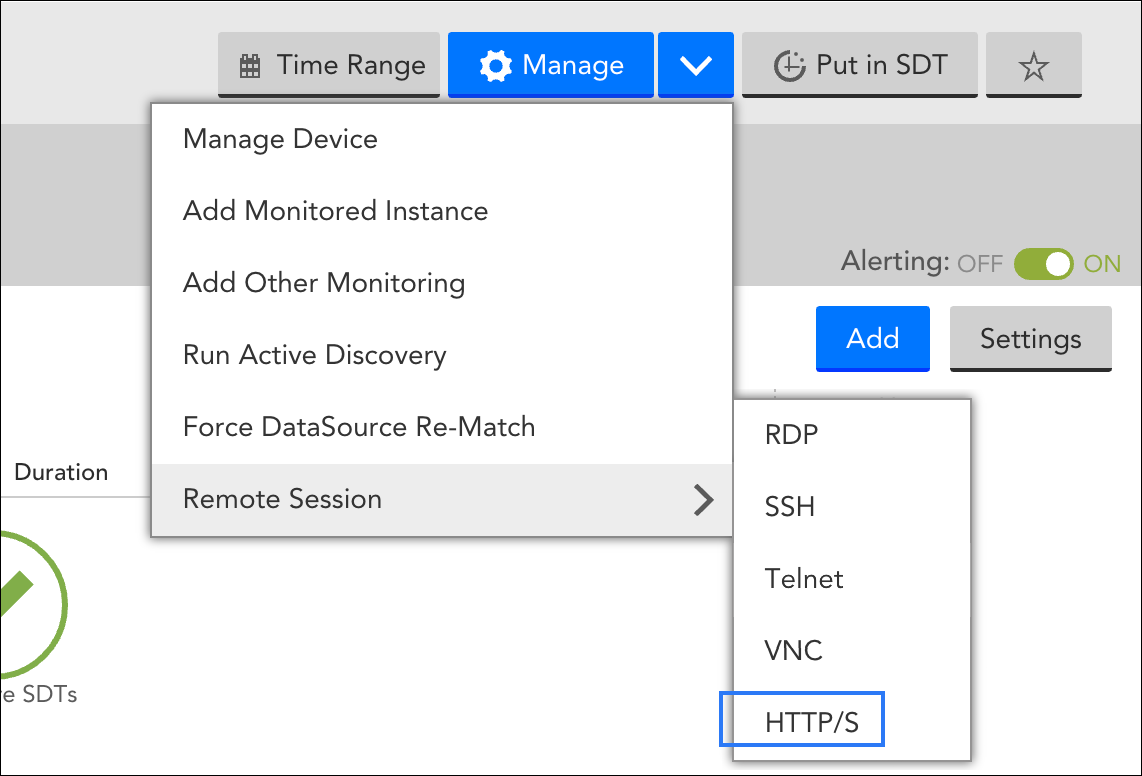
In July, we introduced two new remote session protocols: Telnet and VNC. With v.127, LogicMonitor’s Remote Session feature will now support HTTP/S as well, allowing you to remotely connect to devices with web-based configuration interfaces from within the LogicMonitor platform. (The new HTTP/S protocol will be activated for all customer portals on November 7.)
There are a few limitations to be aware of when using HTTP/S to connect to your devices. Specifically, the following scenarios are not supported:
- Domain/device redirects
- Port redirects
- SSO login redirects (affects vCenter remote session login)
- Link parsing in the HTTP body request (affects some devices such as Cisco UC devices)
To learn more about these limitations, and the Remote Session feature in general, see Remote Session.
Note: Collector version EA28.600 or higher is required in order to use the new HTTP/S protocol.
Brand New Monitoring Coverage
Upon your account’s upgrade to v.127, import our newest LogicModules from the LogicMonitor repository to expand your monitoring coverage.
- Arista EOS Configs – 1 ConfigSource
- Collects various Arista EOS device configurations and information.
- Azure HDInsight – 1 DataSource
- Monitors Azure HDInsight cluster performance metrics.
- Azure SQL Database Managed Instance – 1 DataSource
- Input/output, CPU, and storage utilization metric monitoring for Microsoft Azure SQL Database managed instances.
- Topology mapping Cisco ASA – 1 PropertySource, 1 TopologySource
- For topology mapping coverage for Cisco ASA, import the addERI_Cisco_ASA PropertySource and the Cisco_ASA_L2_HA TopologySource
- Cisco UCS – 2 SNMP SysOID maps
- Consolidated existing SNMP SysOID map entries as well as expanded coverage to other UCS devices.
- Cisco WSA Global Stats – 1 DataSource, 1 SNMP SysOID map
- Monitors Cisco Web Security Appliance (WSA) global performance metrics including CPU, memory, storage, client proxy backlog, and open files and sockets.
- FortiSwitch – 1 SNMP SysOID map
- GCP Pub/Sub Snapshots – 1 DataSource
- Added discovery and monitoring for Google Cloud Platform PubSub snapshots.
- F5 BIG-IP – 17 DataSources
- The F5 BIG-IP monitoring suite has been extensively restructured to provide improved monitoring coverage and quality. As discussed in F5 BIG-IP Monitoring, the current F5 BIG-IP DataSources are being retired and we strongly recommend that you download the new suite of F5 BIG-IP DataSources.
- Topology mapping Huawei – 1 PropertySource
- For topology mapping visualization for Huawei, import the addERI_Huawei PropertySource. (Note: LogicMonitor does not yet offer monitoring coverage for Huawei networking devices; this is targeted for Q1 2020.)
- Istio Kubernetes – 9 DataSources
- Provides comprehensive monitoring of the metrics from the backing Prometheus time-series database (TSDB) that comes bundled with Istio. See Istio Monitoring (Kubernetes) for details on this new monitoring package.
- Linux Sensors – 3 DataSources, 1 PropertySource
- Monitoring for Linux sensors (fans, temperature, and voltage) via SNMP. These DataSources read data generated by lm-sensors.
Other v.127 Enhancements
Alerting
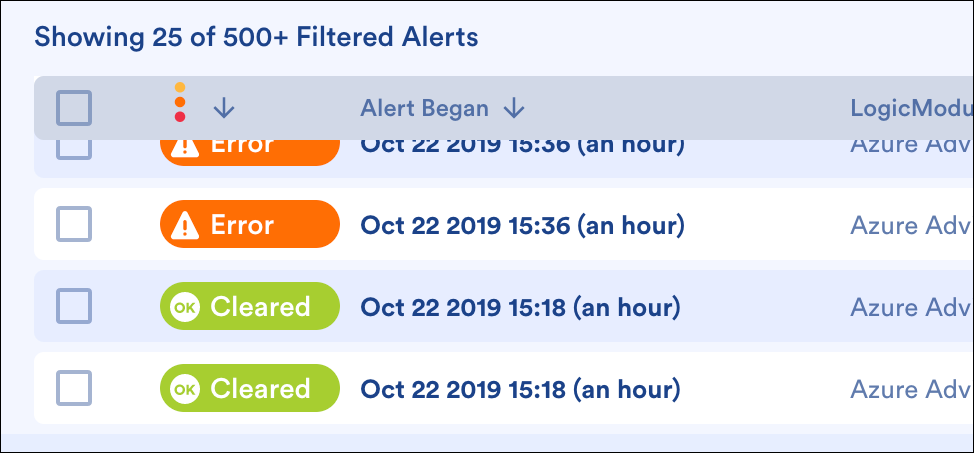 “Cleared” alert icon added to the Alerts page display. Previously, in the newly-released Alerts page UI, the icon for an alert did not change when the alert cleared; rather, the original severity icon (i.e. Warning, Error, Critical) remained associated with the alert. To allow you to quickly differentiate between active alerts that still require attention and those that have cleared, a new icon has been introduced to denote cleared alert status.
- Improved labeling in Alert Forecast report. Previously, when generating alert forecasting data using the Alert Forecast report, datapoints currently in alert were inaccurately labeled as being one day away from an alert condition. Now, the report displays the corresponding alert severity icons for datapoints currently in alert.
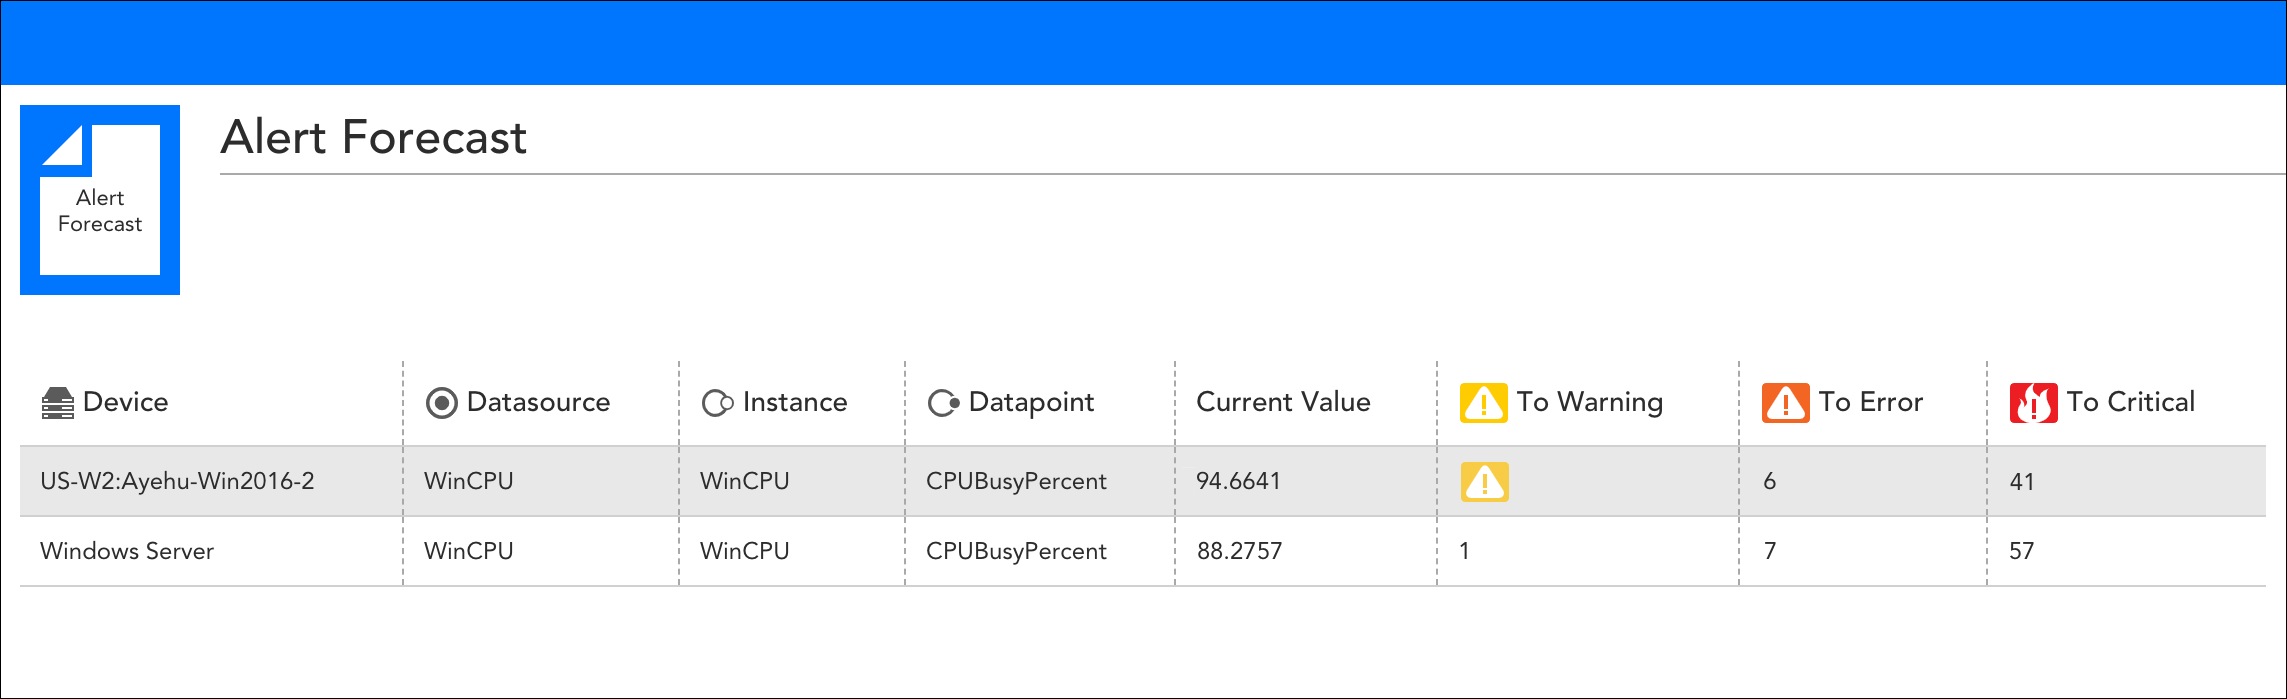
This Alert Forecast report indicates a datapoint is currently in a warning condition.
LogicModules
The following LogicModules have been updated. Upon your account’s upgrade to v.127, import these latest versions from the LogicMonitor repository for enhanced monitoring operations.
- Topology mapping Updated PropertySources – 9 PropertySources
- For improved topology mapping functionality, update the following PropertySources: addCategory_TopoSwitch, addERI_Arista, addERI_Cisco, addERI_Device, addERI_F5, addERI_HPSwitch, addERI_Juniper, addERI_Linux, and addERI_PaloAlto.
- Topology mapping Updated TopologySources – 2 TopologySources
- For improved topology mapping functionality, update the Networking_L2_snmpSwitch
and PaloAlto_L2_HA TopologySources.
- For improved topology mapping functionality, update the Networking_L2_snmpSwitch
- AWS EC2 (EBS | EBSBurstBalance) – 2 DataSources
- Refined AppliesTo logic for AWS/EC2 instance types to ensure other instance types aren’t being wrongly included.
- AWS Elasticsearch – 1 DataSource
- Added new datapoints and graphs.
- ConnectWise – 18 DataSources, 1 PropertySource
- Added support for ConnectWise’s new clientID token, which is now required for all REST API integrations. For instructions on setting this token as a property (connectwise.clientid) on the ConnectWise host, see ConnectWise Monitoring.
- F5 BIG-IP – 17 DataSources
- The F5 BIG-IP monitoring suite has been extensively restructured to provide improved monitoring coverage and quality. As discussed in F5 BIG-IP Monitoring, the current F5 BIG-IP DataSources are being retired and we strongly recommend that you download the new suite of F5 BIG-IP DataSources.
- Fortinet FortiOS – 1 ConfigSource
- Expanded AppliesTo logic to include FortiSwitch; improved filtering.
- HP 3PAR VLUN by [Host|Volume] – 2 DataSources
- Improved regex matching.
- HTTP and HTTPS – 2 DataSources
- Updated to follow redirects (max of 3); improved request headers, graphs, datapoints and alerting.
- Kubernetes Deployment – 1 DataSource
- Added null checks.
- Kubernetes Node – 1 DataSource
- Fixed minor issues in the Ready datapoint description and alert message template.
- Palo Alto Firewall System – 1 DataSource
- Updated support for newer PAN-OS versions for proper regex matching.
- Raritan Power Distribution Inlets – 1 DataSource
- Fixed issue with activeEnergyState datapoint.
- Sentry3 Tower – 1 DataSource
- Fixed issue with percentage alerting datapoint.
- WinOS Memory and Processes – 1 DataSource
- Improved various datapoints, alerting, and graphs.
- VMware ESXi Datastore [Capacity|Performance|Status] – 3 DataSources
- Improved alerting to reduce noise; updated datapoint descriptions.
- VMware vCenter Datastore Capacity – 1 DataSource
- Adjusted alert thresholds.
- VMware [vCenter|ESXi] Object Count – 2 DataSources
- Added missing datacenter count datapoints.
Looking Ahead: Integrations Page (new!)
As part of LogicMonitor’s ongoing UI initiative, we’ll soon be launching a brand new interface for the management of LogicModules. This new interface, called the Integrations page, will provide a centralized view into all LogicModule integrations (e.g. DataSources, PropertySources, EventSources, etc.) that are available for use in your monitoring activities.
The new Integrations page brings the LogicMonitor repository right into the platform. Using the LM Exchange tab, you can easily browse, search, and import new and updated LogicModules—whether published by LogicMonitor or by a member of the LogicMonitor user community. (UI image captured from alpha version; subject to change.)