
Disclaimer: This content applies to the legacy UI and is no longer maintained. It will be removed at a future time. For up-to-date content, see Adding Additional Monitoring. At the time of removal, you will automatically be redirected to the up-to-date content.
Monitoring Web Pages, Processes, Services and UNC Paths
Last updated - 25 July, 2025
LogicMonitor has DataSources to monitor web pages, processes, services, and UNC Paths. Because Active Discovery is disabled for these DataSources by default, you will need to add web pages, UNC paths, process, and services as instances on a per-device basis. The steps are outlined below:
- On the Resources page, navigate to the device in the Resources tree.
- Highlight the device in the Resources tree, and click the down arrow icon button located next to the Manage button for that device. From this dropdown menu, select “Add Other Monitoring“.
- Edit the necessary configurations for each web page, process, service, or UNC path you are adding as a monitored instance. These configurations are detailed in the following sections.
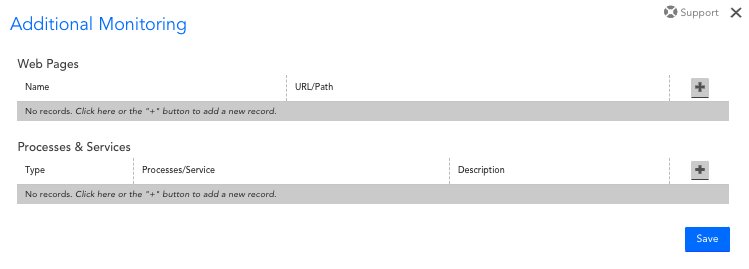
Web Pages
| Field | Description |
| Name | The name of the monitored web page as it will appear in LogicMonitor. |
| URL/Path | The full URL for the web page, or the relative URL path for the web page if the website domain is already associated with the device. |
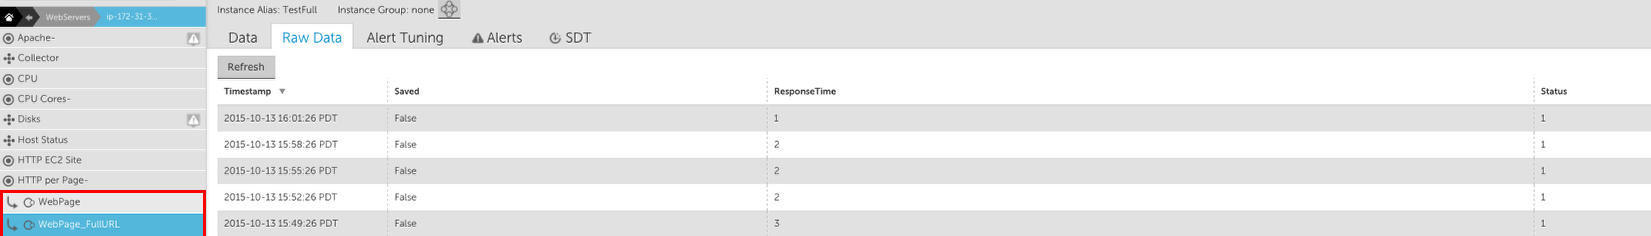
The HTTP per Page DataSource will load the web page, and provide a status and the page load time:
Processes and Services
| Field | Description |
| Type | The type of process or service you are adding. The dropdown values for this field will be limited based on whether the device runs a Windows or Linux Operating System. |
| Processes/Service | The process or service to be monitored. The dropdown values for this field will be pre-populated based on the processes and services running on your device. |
| Description | The description for the monitored process or service, as it will appear in LogicMonitor. |
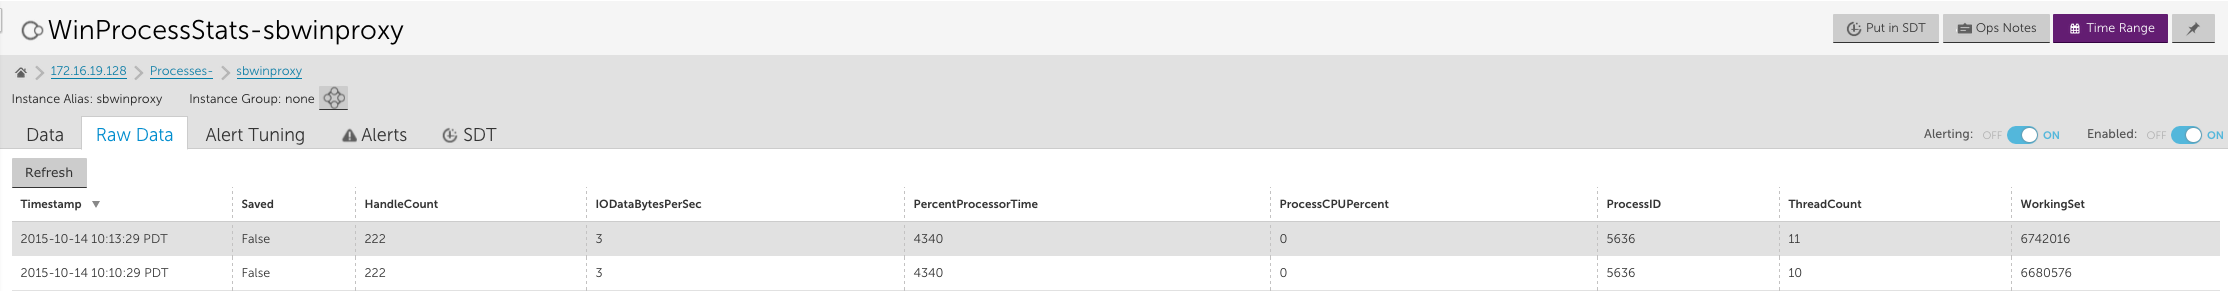
Linux processes will be monitored by the LinuxNewProcesses DataSource, Windows processes will be monitored by the WinProcessStats DataSource and Windows services will be monitored by the Microsoft_Windows_Services DataSource. For more information about monitoring Linux services, see LogicModules in Package.
Note: Instances will need to be manually added (using Add Monitored Instance) to a resource and applied to the Microsoft_Windows_Services DataSource to get output.
UNC Paths
To monitor a UNC share, whether a domain DFS share or otherwise, use the UNC Monitor DataSource. This DataSource will do a directory listing on the given UNC share and report success or failure.
To add a share to be monitored, select a Windows host in the hosts view. The monitoring of the UNC actually occurs on the Collector that monitors this host, but the results can be associated with any Windows host.
For Windows devices, the option to monitor UNC Paths is available in the Additional Monitoring settings.
| Field | Description |
| Name | The name of the monitored UNC path as it will appear in LogicMonitor. |
| URL/Path | The UNC path. This can be a path to a directory or a specific file, such as \\fs\root\builds . LFS Paths, such as C:\Windows, are also supported. |
The UNC Monitor DataSource will monitor the accessibility of the UNC path from the collector monitoring this device.
When specifying UNC Paths to monitor, make sure that the user account has the proper permissions to access the UNC share. By default the user specified by the property wmi.user is used to access the file. If you need to specify an alternative user, use the following properties to set the username and password for the Windows user:
| Property | Description |
| win.user | Windows user name. |
| win.pass | Windows password. |
The above device properties can be used to set from Manage Device > Add Property. For more information, see Resource and Instance Properties.
