Collector Failback and Dashboard Improvements (v.61)
Last updated on 14 September, 2022The v.61 release will be rolled out through mid April and includes collector failback (the ability to fail devices back to their primary collector after a collector fail over), improvements to the Dashboard page, and an update to JDK 8 for Services checks.
Collector Failback
LogicMonitor has always provided the ability for you to configure a backup collector, but there was not an elegant solution for moving devices back to their original collector after a failover. Until now.
On the surface, Collector failback is simple and only requires that you select the “Automatically failback when this collector becomes available again” option from Settings | Collectors | Manage Collector:

In practice, there are a few other things to be aware of:
- Preferred Collectors: To enable collector failback we have introduced the notion of preferred collectors. Any time you assign a device to a collector, either when the device is added or the collector is changed manually, the assigned collector will become the Preferred Collector. After a collector fail over, automatic fail back will reassign devices to their preferred collector.
- Manual Failback: If you do not have automatic fail back enabled you can manually reassign devices back to their preferred collector or to a new collector.
From Settings | Collectors you can:- Select ‘Devices’ for the collector that failed and either move devices back to their preferred collector or reassign to the backup collector.
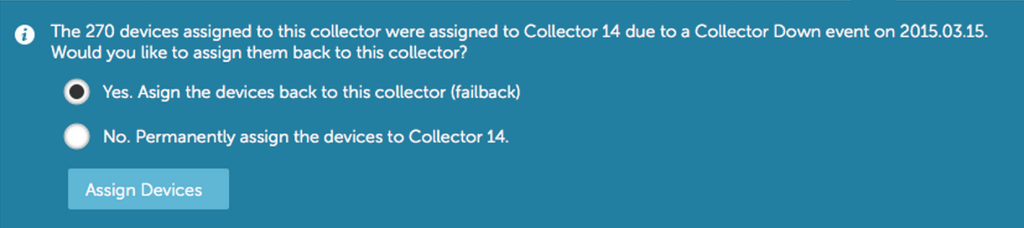
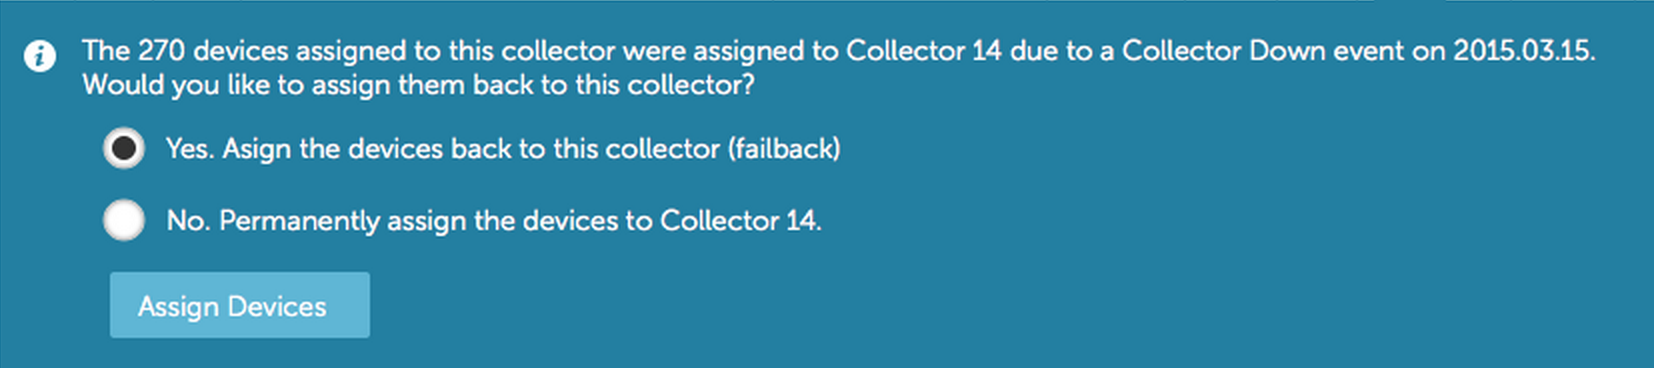
- Select ‘Devices’ for the backup collector and view devices assigned to the collector. You can either select specific devices and choose to “Change Preferred Collector”, or select “Failback to Preferred Collector” to automatically reassign all devices back to their preferred collector.
- You can select multiple devices from any collector and choose “Change Preferred Collector,” independent of fail over events.
- Select ‘Devices’ for the collector that failed and either move devices back to their preferred collector or reassign to the backup collector.
- Notifications: A new token is available for collector down alerts: ##AutoFailBackEnabled##. This will be automatically included in non-customized collector alerts.
- System Messages: Information about collectors will be displayed on the Collector Management page with a summary of available actions in the event that collector failover occurs.
Custom Graph Widget
The Custom Graph Widget is the most powerful Dashboard widget, and by nature the hardest to configure. To simplify the process, we are introducing two types of Custom Graph Widgets, Simple and Advanced.
The Simple Custom Graph Widget is ideal when you have a handful of datapoints or virtual datapoints that you want to include in a graph. Begin by creating a datapoint and selecting a device, datasource and datapoint:
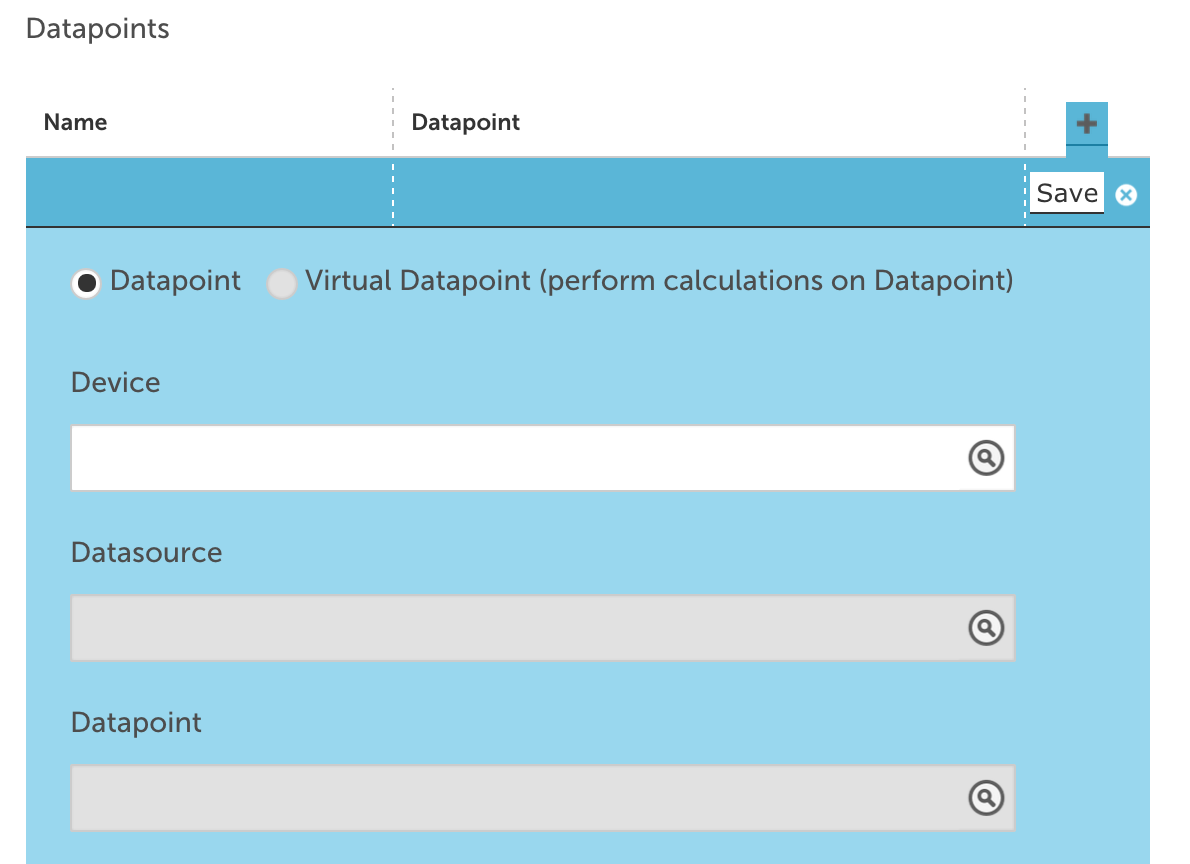
Once at least one datapoint has been created, you can also add Virtual Datapoints which enable calculations to be performed on or between existing datapoints.
Once all of your Datapoints have been created, configure what is displayed in the graph by creating Graph Lines. During the Add Graph Line step, you select which datapoint to graph, how it will be graphed (Line, Area, Stack, or Column), the Legend, and the Color.
The Advanced Custom Graph widget provides the same basic functionality as the Simple version, but also includes the ability to use wildcards in datapoint definition. Because multiple instances can be evaluated in the same datapoint, there is an additional option to limit results.
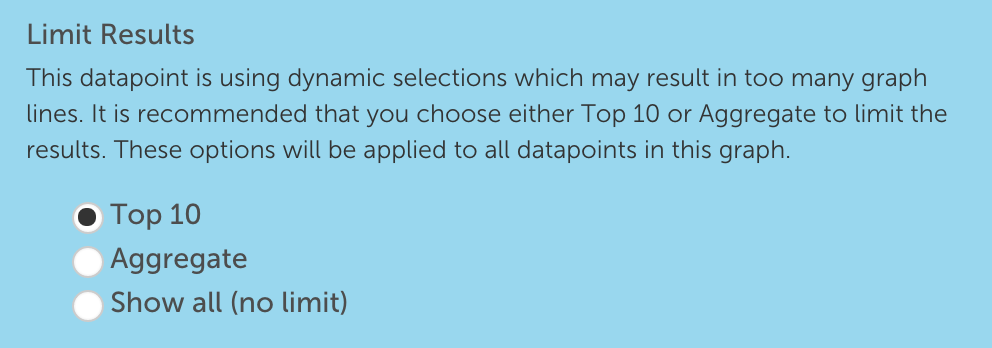
If Aggregate is selected, you can choose to view the Sum of all datapoints, Min, Max, or Average.
Beta UI – Dashboard Improvements
There is an ongoing focus on improvements and bug fixes for the new UI as we work to move it out of Beta. Improvements in this release were focused on the Dashboard page and include:
- An overall improvement in reordering and resizing widgets, including the ability to have 2 columns per row.
- Widget headers for instance graphs link directly to the instance.
- Dashboard selector is consistent with Devices layout, providing better group / member context.
- Account timezone is visible in the header.

Fixes in this release include:
- Time based chains are displayed correctly between the beta and existing UI views.
- SDTs are stored correctly for international accounts.
- Consistency with use of Datasource Display As name in the Device page.
- Remove any case sensitivity from search throughout the application.
- The suffix -ADMIN removed from user names in the escalation chain display.
Other General Improvements:
- Accounts using whitelist functionality do not have to include LogicMonitor IP ranges to provide access to LMSupport.
- The time a collector download is valid has been extended to 20 minutes to allow ample time for installation.
- Update to Services checks (SiteMonitor) to utilize JDK 8. With this upgrade we support TLS 1.2, but have removed support for the older, insecure version of TLS 1.0.