Collector Monitoring, More UI Beta Features
Last updated on 14 September, 2022Collector Monitoring
Many of you have a good idea of your collector throughput, based on your experience and knowledge of your infrastructure. Collector-specific datasources help remove any further question you might have. These new datasources provide the following metrics:
- Collector Auto Discovery Task
- Collector Data Collecting Task
- Collector Event Collection Task
- Collector Heartbeat
- Collector JVM Garbage Collection
- Collector JVM Memory Pools
- Collector JVM status
- Collector Reporter Task
Currently, you have to manually apply the datasources and associated thresholds. When we collect enough meaningful data, automation will be added, along with some exciting new collector functionality. For more information, see “Enabling Collector Monitoring.”
Additional User Interface Beta Features
Thank you to everyone actively using the new user interface pages and submitting feedback. Keep it coming!
In the latest release, you can expect to see more minor adjustments to existing pages, as well as some new functionality. Look for the following changes:
- Provides all dashboard widgets, including some small enhancements. For example, the NOC widget supports Groups or specific hosts and includes an alert summary.
- Offers more insightful error messages.
- Resize and reorder widgets using drag and drop.
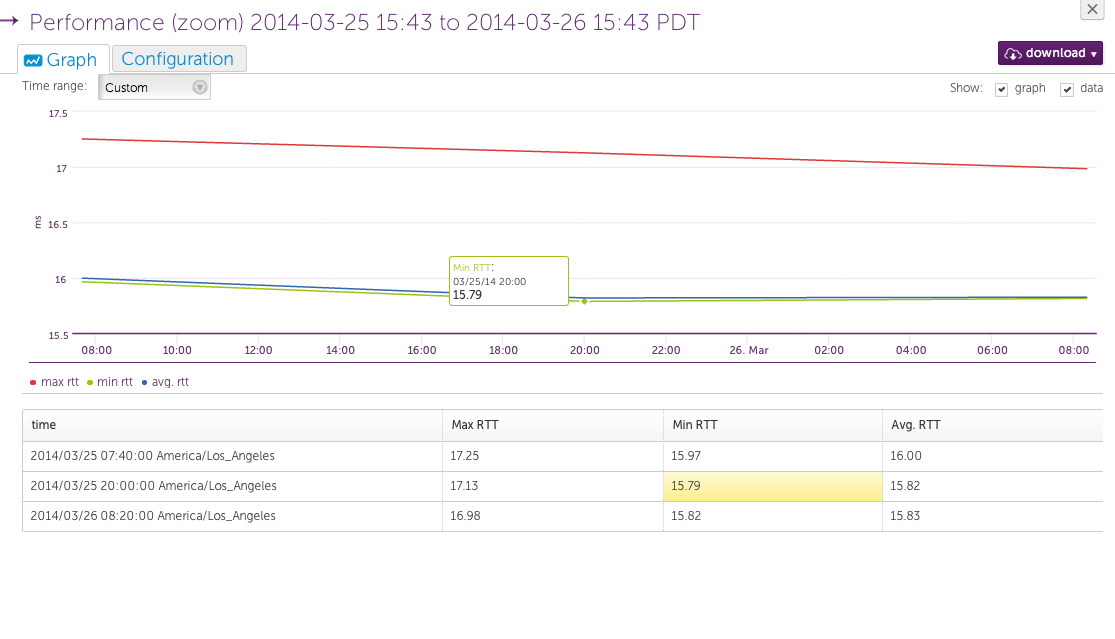
- Zoom in on a widget to view the graph and data. Hover over a line in the graph to view the raw data value for that point.
IPv6 Support in Beta
This release provides beta IPv6 devices support. Due to the beta status of this feature, you need to implement a manual change to your collector configuration.
- Navigate to Settings, and then click Collectors.
- Click the collector for your IPv6 devices.
- Click the wrench icon, and then click Restart collector.
- Scroll to the bottom of the Collector Config section to find
#pingpool implementation, pingpool.usejava = true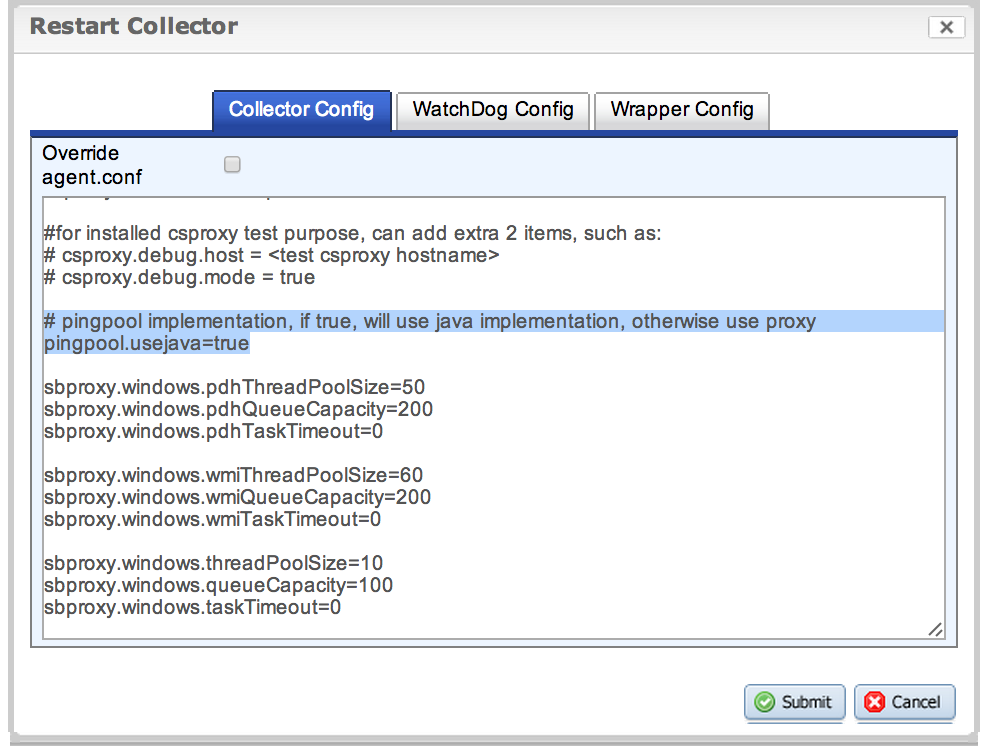
- Edit the line to reflect
pingpool.usejava=false - Click Submit.
On restart, add IPv6 hosts from the Host tab.
Automatic Rollback
Although rare, a new feature will occasionally impact performance. To keep any impact to a minimum, we have added the ability to rollback individual features if issues arise.
Improvements
- Including a host without data in a custom graph widget, the graph no longer waits for data before generating the graph.
- Increased character limit for Host Group field in alert rules to enable support for folder paths with many subgroups.
- Allows for the use of a dash (-) for ranges in whitelists.
- Updated the Date column in CSV exported reports to be easily sortable.
- Support added for RegExMatch xx[y-y] for event id filters.
Issues
- Corrects the CSV view of the Alert Report (CSV) to eliminate the sorting issue caused by presenting group information on a separate line.
- Fixes an inconsistency in the JDBC Collector fields for debug and collector tasks. Standardized to always use getColumnLabel with backward compatibility support for getColumnName.
- Resolves an issue where users created with single sign-on were unable to display the new Dashboard view.
- The collector was updated to use the Oracle 11g JDBC drivers. If you are seeing a Java exception: java.lang.UnsatisfiedLinkError: no ocijdbc11 in java.library.path, please update your Oracle databases to use the 11g JDBC drivers (https://www.oracle.com/technetwork/database/enterprise-edition/jdbc-112010-090769.html)
Known Issues
Advanced Queries Missing from Advanced Site Monitor when Accessed through the Default User Interface
Viewing Advanced Queries
If you are using the default user interface, you will not see your advanced query settings, though they have not been removed. There is an issue viewing these settings in the default user interface at this time.
To view your advanced queries:
- Click Toggle UI at the top right of your portal and navigate to the Services tab.
- Select the service you want to execute the query, and then click Manage.
- Scroll to the bottom of the Manage window and review the Steps section.
Editing and Saving Advanced Queries
Along with the viewing issue mentioned above, the default user interface does not allow you to successfully edit or save advanced queries. Edit and save advanced queries in the new user interface.
To edit your advanced queries:
- Click Toggle UI at the top right of your portal and navigate to the Services tab.
- Select the service you want to execute the query, and then click Manage.
- Scroll to the bottom of the Manage window and then edit or add steps in the Steps section.
Enabling the New User Interface
If you do not see the Toggle UI link at the top right of your portal, you need to enable the use of the new user interface.
To enable the new user interface:
- Select the Settings tab.
- In the right pane, click Roles and Users.
- In the Users section, click the pencil icon next to your name.
- On the Edit window, check Use New UI? and then click Submit.
Note: To know you are viewing the correct user interface, ensure you see uiv3 in the browser URL. For example, you should see https://portalName.logicmonitor.com/santaba/uiv3/service/index.jsp