Services Widget, New Role Based Access Controls, and more
Last updated on 14 September, 2022The following new features, improvements and bug fixes will be rolled out between now and the end of September.
New Features
New Testing Location for Services
The Services functionality has been enhanced over the last few releases which makes it time to add testing locations. A new location, Amazon SouthEast, will be available after this release, and enables you to take better advantage of overall versus individual test location settings. Additional locations will be added over the next few months.
Services Overall Status Widget
Add a quick view of the overall status of your websites with the Services Overall Status Widget. The widget displays the overall status of multiple services in one graph, with one line representing each service.
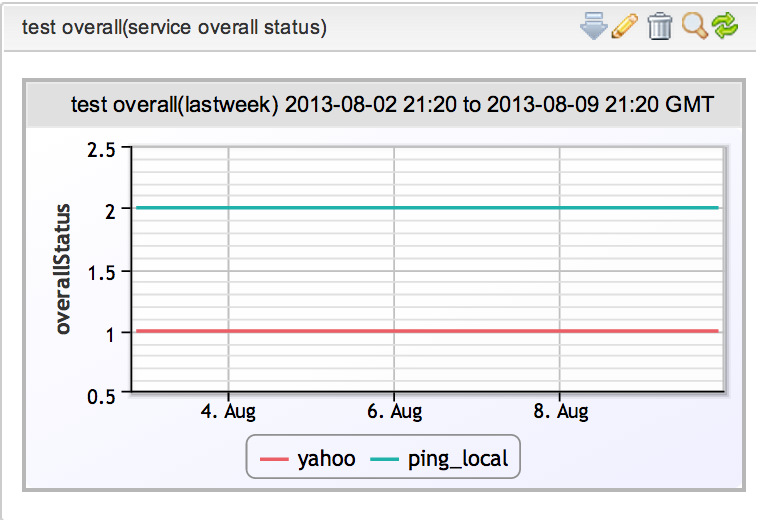
See Creating Widgets for more details.
New Role Based Access Control Settings
A variety of new features have been added to enable you to better control user access for Dashboards, Hosts, and Reports.
Dashboard Access Control:
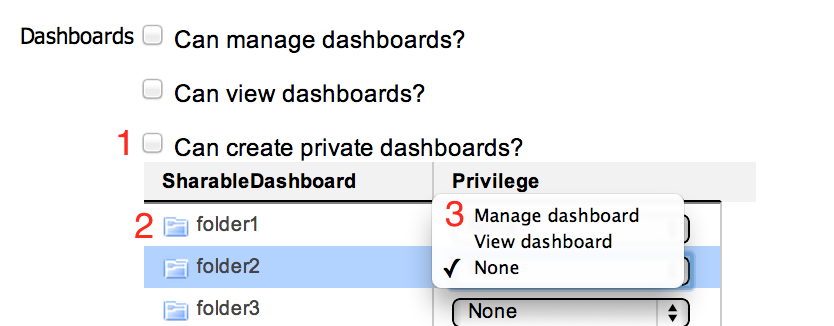
- If Can create private dashboards is not selected the user will not be able to access the Manage Dashboards functionality. This enables you to lock a user to the dashboard view.
- Folders have been added to the Dashboards tab to ease organization and permissions.
- Assign manage dashboard permissions at the folder level.
Host Access Control for SubGroups:
Manage control of user access to your hosts and their data down to the subgroup.
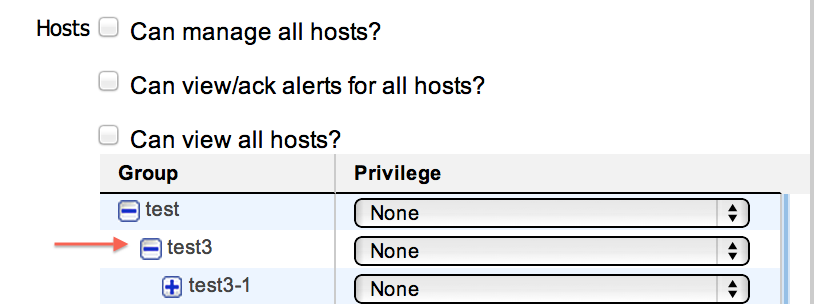
View, Acknowledge, and Manage permissions can be set at the global, group, or subgroup level. Subgroups will inherit Group permissions by default unless otherwise specified.
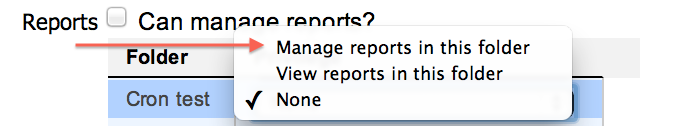
Report Management for Report Folders
Give users the ability to manage reports per folder.
Last Modified By for Reports
Reports are designed to respect a users data permissions, so if a user who only has rights to manage hosts in Group B will only see data from Group B when running a report that includes all hosts.
This can get confusing if people are seeing different data, we added the ability to see who last modified a report. Users who can manage all hosts will have the option to run the report as the last modified by user.
This option will only be available on reports that have been modified after this release.
Improvements
OpsNotes Enhancements
Our July release included OpsNotes and we’ve been receiving a lot of great feedback. Among the kudos and compliments we eat up, there were some requests we had to agree were needed. These include:
- The ability to enter an arbitrary time. You will still see a drop down of 15 minute increments, but any time can be entered (up to 59, we avoided fancy math).
- Terminology – you’ll see options for Select OpsNotes and Hide All / View in your drop down. This aligns better with the functionality.
- The effective time range for OpsNotes displays at the top of the Select modal.
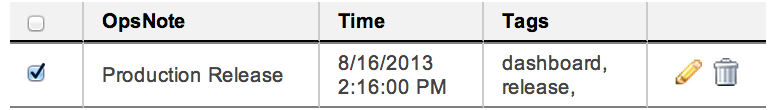
- When selecting OpsNotes, Time and Tags are included in the table.
- If you have filtered OpsNotes by tag or keyword, the button will display in red. Hovering will display the active filters.
- The OpsNotes RPC is published and available.
Alerts
We updated how we generate and store alerts for clearer interpretation and notifications if an alert changes severity.
- A new alert and alert ID will be generated any time an alert changes severity.
- Alerts increasing in severity will still respect the alert trigger interval.
- Alerts decreasing in severity will respect the alert clear interval.
- Alert clear notifications will be sent when alerts decrease in severity.
Other Improvements:
- The summary for ConnectWise Tickets has been shortened and details moved to the description.
- SNMP v3 is fully supported.
- In SDT added as a column in the Alerts Report.
- Alerts acknowledged from an email address without a LogicMonitor account will display the full email address in the Ack’ed by field.
Bugs
- Variety of fixes to Dashboards and Graphs, including:
- Better handling of graphs with large spikes in Safari and Chrome
- On smaller screen sizes the dashboard drop down menu would disappear behind the first widget.
- getGraphImage was returing inconsistent graphs when area lines were in use.
- We made it challenging to update your dashboards for auto rotation, forcing a clear all if cached values didn’t meet your needs.
- In order to correctly display Netflow data, the device time must match the LogicMonitor server time. An error has been included.
- NTLM authentication was failing
- OpsNotes were not appearing on a graph with no data
- There were a few issues with how Google Maps was (or wasn’t) displaying locations.
- Disabling alerting on a services folder was ineffective.
- A few bugs with how alert levels were stored for services were also addressed.
- A logic error to determine hosts covered by a datapoint of flexible custom graph (host=abc*, hostgroup=group1, group2 treated as OR instead of AND)