v.92 Release: Easy Collector Tuning and Expanded AWS Support
Last updated on 14 September, 2022The v.92 release will be rolled out through the end of July. As mentioned in our last release, we are continuing a long-term initiative to improve our platform’s ease-of-use so you can gain maximum insight with the shortest possible workflows. As we crank away at these improvements, you may notice the next couple releases are a bit lighter. Some of the larger changes you will see in v.92 include:
Easy Collector Tuning
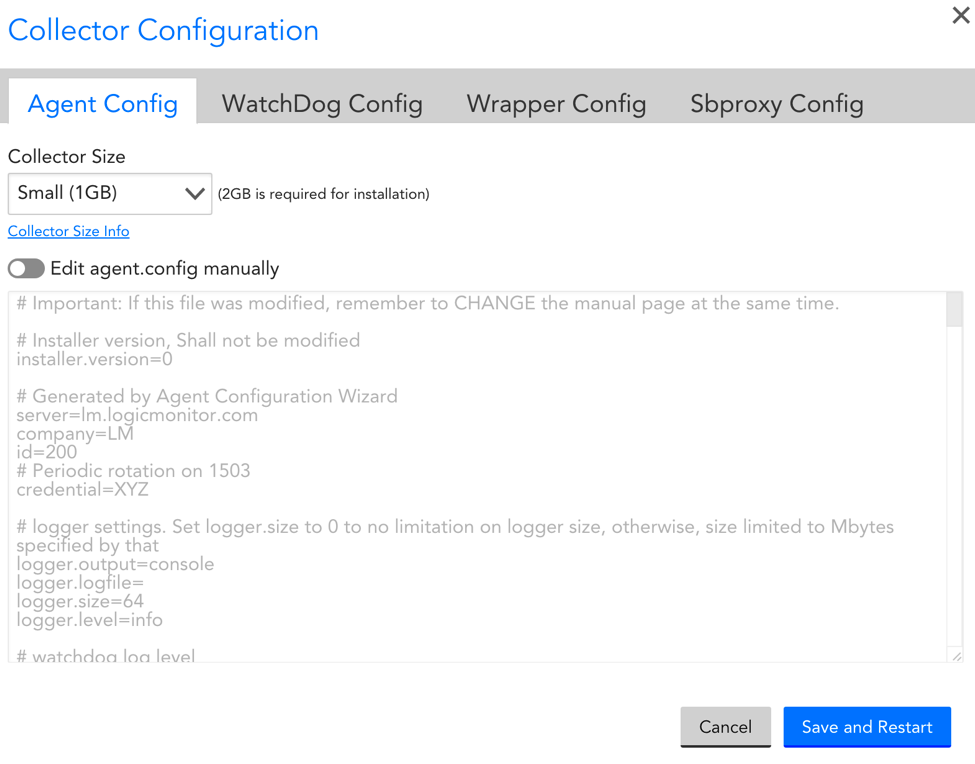
You no longer have to manually edit the Collector’s configuration parameters in order to increase its monitoring capacity! Now, simply navigate to the Collector configuration window and select the desired Collector size (Small, Medium, or Large) from a dropdown menu. By making this selection, we will automatically update all necessary parameters in the Collector’s configuration file for you. This functionality requires a minimum Collector version EA 24.126.
Why you care: when a Collector (say, a Small or Medium Collector) reaches its monitoring capacity, you can now increase the number of devices it can monitor with the click of a button. This saves a substantial amount of time and mitigates the risk of human error when changing the Collector’s config.
Please note:
- Older Collectors will display their current size as “Custom (xGB)” in the dropdown, even if no parameters have been modified since installing. This is because our definition of size has changed since the Collector was installed. To ensure the Collector configuration is up to date, simply select the size you want (or had installed originally) and select Save and Restart.
- Changing a Collector’s size has no effect on parameters unrelated to its size. Please consult the “Configuration Details” section of this document to see which parameters are impacted by changing the Collector’s size.
Expanded Support for AWS Resources:
We have made the following changes to our AWS monitoring:
- We added support for AWS Kinesis Firehose, SES, and VPN CloudWatch metrics.
Why you care: these services can now be selected from the Add / Manage AWS Account Dialog, and LogicMonitor will discover resources and automatically begin monitoring CloudWatch metrics.
- We now auto-group AutoScaling resources and their member EC2 instances. You will see subgroups underneath the AWS | AutoScaling group automatically created for each AutoScaling resource detected, and associated EC2 instances will be auto-added to this group.
Why you care: this is useful if you have custom properties that need to be set for EC2 AutoScaling instances. By setting properties at the group level, you ensure all EC2 instances created for the AutoScaling group and auto-discovered by LogicMonitor inherit the correct properties.
Other Improvements
Alerts
- Sensitive properties, such as .pass, .key, .community, etc., are now obfuscated when referenced in alert message templates.
- When using the “Test Alert” routing dialog, we will now denote if alert delivery is disabled account-wide. This helps avoid confusion when attempting to troubleshoot or confirm alert delivery details.
- When using the “See All” option for alert graphs’ Ops Notes, we will display all Ops Notes within the time range selected for that alert graph rather than the global time range. This is useful for isolating Ops Notes that may be relevant to a specific alert.
Collector
- An error message will display when attempting to save faulty Collector Configuration file via the UI. The message will display which lines are missing/duplicated so they can be corrected.
Dashboards
- Minor improvement to the Big Number Widget in which we maximize the size of the displayed number when no labels are specified.
Devices (AWS)
-
We now include AWS account IDs in the billing data we monitor, which enables filtering by account ID in the AWS billing DataSources. You may find this useful for accounts configured to use consolidated billing, because it allows you to break out detailed costs to be per account.
Devices
- When an instance is deleted (manually or by Active Discovery) we will send “clear” payloads to all relevant integrations. This is useful because it prevents “stranded” tickets in integrations for instances that are expected to come and go.
- We improved the way bytes are displayed in the Traffic tab. It now displays using appropriate units of k for kilobytes, M for Megabytes, G for Gigabytes, T for Terabytes, P for Petabytes, E for Exabytes, Z for Zettabytes.
- We added a new property, “system.deviceId”, to the Info Tab for all devices and “system.instanceId” to the Info Tab for all instances. You may find this useful if you are trying to get a deviceId or instanceId for API use.
- Improved the Add Device wizard in the case the user accidentally enters extra spaces at the beginning or end of IP address/DNS name (i.e. the spaces will be removed)
LogicModules
- Obfuscated sensitive properties such as those ending in .community, .pass, .key, etc. can no longer be used in conjunction with comparison operators in Applies To fields. This is a security improvement to prevent users from being able to confirm the property value. These properties can still be used without comparison operators.
- Datapoints will now be ordered automatically in an alpha-numeric order in order to improve readability.
Mobile
- We added support for the SLA Widget on dashboards.
- You can now swipe down to refresh the alerts list or dashboard view.
REST API- version 1.4.3
- We have added a new field, “nextPageParams”, to the “get data” resource. This field returns start and end timestamps for the next page of data (if it exists). This is helpful for quickly iterating through large data sets with the API.
Miscellaneous Improvements
- A mouse moving in the alert detail / graph panel will postpone the Alerts page refresh. You may find this useful for minimizing refresh interruptions during alert investigation.
Bugs Fixed
- Alert count was not always displayed correctly for group level Alerts Tabs.
- Some users encountered issues when exporting DataSources with some special characters in them.
- In some cases, automatic Collector updates were not populating with the correct date. We have improved our Calendar processing logic to fix this.
- The ‘SSO login’ button was not displaying when logging in with two-factor authentication.
- Clicking on the search result’s header multiple times added additional prefixes. For example, clicking “devices(2)” to narrow the search to devices changed the search text to “d:d:somesearch” instead of just “d:somesearch”.
- In some cases, widgets
were displaying ‘No Data’ when calculating an aggregate datapoint. - On the Alerts report, the checkbox include existing alerts will now respect the time range specified (e.g. 2 hours, 24 hours, etc).
LogicModule Releases
Below is a full list of new/improved LogicModules as well as bug fixes that were implemented since our last release:
New Monitoring Coverage
- Cisco Product Info – 1 DataSources
- Juniper VPN & RPM – 2 DataSources
- Azure Service Health – 1 EventSource
- AWS CloudWatch VPN – 1 DataSource
- Nimble System Properties – 1 PropertySource
- AWS Kinesis Firehose – 1 DataSource
Monitoring Fixes & Updates
- PureStorage Volume Performance
- AWS CloudFront
- VMware vSphere Datastore Performance
- VMWare vSphere Datastore Capacity
- Windows Exchange Process
- AWS Service Health
- HyperV Virtual Machines
- ElasticSearch
- AWS Application ELB
- Cisco IOS ConfigSource
- VMware vSphere Network Status
- AWS EC2 T2 Instance Credits
- Windows Exchange Processes
- Cisco ASA Cluster
- Palo Alto Global Counters
- Nutanix Virtual Machines
- AWS EC2 Schedule Events
- VMware vSphere VM Status
- AWS Kinesis