
Resource Metric Trends Report
Last updated - 29 May, 2026
The Resource Metric Trends report displays minimum, maximum, average, percentage change, and sum values for any datapoint that is available for a resource or resource group. This information is formatted as a table and can include graphs for each resource, DataSource, and datapoint. This report allows you to review recent performance metrics across a group of resources.
Note: To report on CPU trends for a group of resources, use the Server CPU Report. For more information, see Server CPU Report.
Requirements for Configuring a Resource Metric Trends Report
To configure a Resource Metric Trends report, you need a LogicMonitor user with the “View Permissions” for Reports and an associated role with Manage permissions for Reports. For more information, see Reports Role Permissions.
Configuring a Resource Metric Trends Report
- In LogicMonitor, navigate to Reports.
- Select
 > Add Report > select Add for the Resource Metric Trends report.
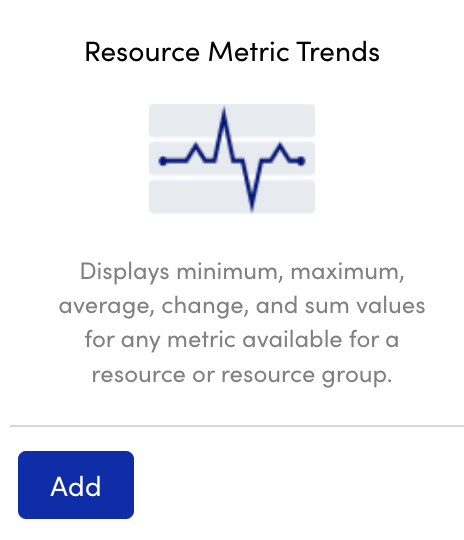
- In the Name field, enter a name for the report.
Report names cannot include the operators and comparison functions used in LogicMonitor’s datapoint expression syntax. - (Optional) In the Description field, enter a description for the report.
For example, you can enter a description of the specific purpose of the report. - From Report Group, select the report group where your report is stored.
Matching groups display as you type, and you can select the group from the list. - From the Format dropdown menu, select the type of format for the output of the report.
You can select HTML, PDF, or CSV.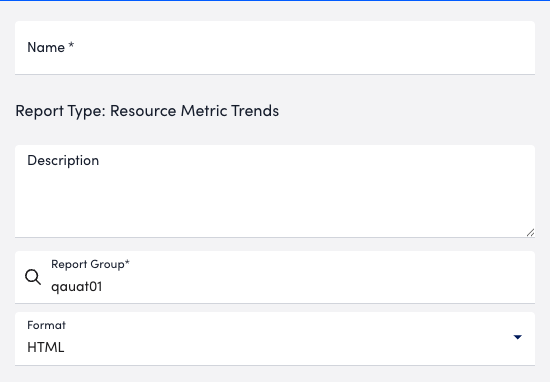
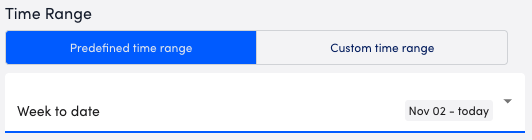
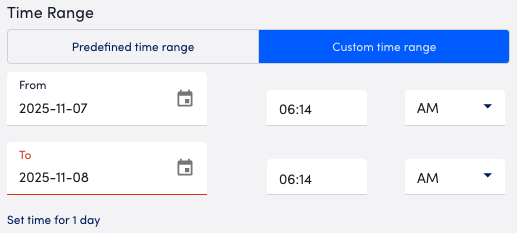
- In the Time Range section, select whether to configure a predefined time range or custom time range by doing the following:
- To configure a predefined time range, select Predefined time range and then choose a time range option.
- To configure a custom time range, select Custom time range and then configure the time range settings.
- To configure a predefined time range, select Predefined time range and then choose a time range option.
- Define at least one resource group or resource to use in your report by doing one of the following:
- To define a resource group, select Resource group and then enter a group into the Resource Group field.
LogicMonitor attempts to match values as you type.
The resource group you enter restricts your report to the data available in that group only.
You can select a combination of both glob and distinct values to specify your resources and resource groups. For more information, see Using Glob in your LogicMonitor Portal.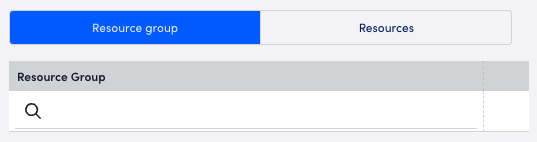
- To define resources, select Resources and then enter a resource into the Resource field
LogicMonitor attempts to match values as you type.
The resources you enter restrict your report to the data available in those resources only.
You can select a combination of both glob and distinct values to specify your resources and resource groups. For more information, see Using Glob in your LogicMonitor Portal.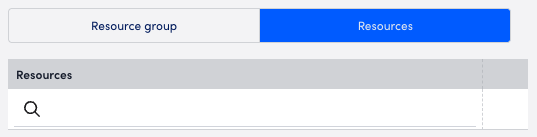
- To define a resource group, select Resource group and then enter a group into the Resource Group field.
- In the Datapoints section, define the datapoints to retrieve from the specified resources by doing the following:
- In the DataSource field, enter the name of a DataSource to include in your report.
- In the Instance field, enter the name of an instance to include in your report.
- In the Datapoint field, enter the name of a datapoint to include in your report.
You can enter datapoint calculations, such asInOctets*8/1000/1000. In addition, you can use a calculation to convert the units of your collected data without defining a datapoint definition. - From Consolidation Function, select the function you want to use.

- Toggle the Scale by units of 1024 switch to change the scale of the graph.
By default, the graph is scaled by units of 1000. - To limit the number of results displayed in the report, select an option from the Number of results to display in report dropdown menu.
The report displays the number of DataSources you have defined based on the selected time range. For example, if you defined a DataSource for HostStatus and Ping and you select “Top 10,” your report displays the top 10 results for HostStatus and the top 10 results for Ping.Note: If “All” is selected, the report displays all available data based on the Resources or Resource Groups defined. - From the Sort By dropdown, select the sort order you want applied to the report.
By default, the report sorts by resources. - From the Report Format dropdown, select the format you want the report displayed in.
You can include one graph per resource group, resource, DataSource, instance, or datapoint.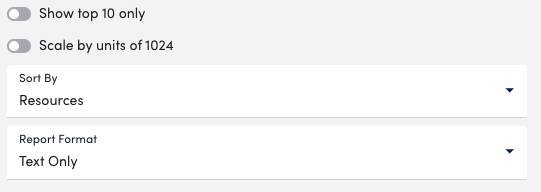
- Use the Columns settings to configure the columns you want displayed in your report.
You can configure the order the columns display in and whether or not to hide certain columns.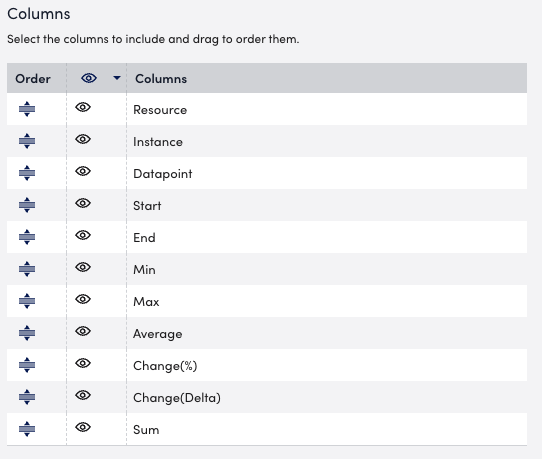
- In the Properties section, select the host properties and group host properties you want to include in the report.
Each property displays as a column header in your report.
- In the Report Schedule section, do the following to configure the report to generate on a schedule:
- Toggle the Generate this report on a schedule switch.
- From the Frequency dropdown menu, select how frequent you want the report to generate, and then configure when you want the report to generate.
For example, if you configure the report to generate daily, you can choose the time to generate the report each day. If you configure the report to generate weekly, you can choose the day of the week and time to generate the report for the selected date. If you configure the report to generate monthly, you can configure the day of the month and time to generate the report.
Each frequency option provides you a setting for selecting the time zone. - In Recipients Email, enter the name of the user you want to receive the generated report.
You can also add recipient groups.
You can enter as many users as needed.
LogicMonitor attempts to match values as you type.
The recipients you add to the report are emailed a generated report based on the format you configured and the email associated with the username.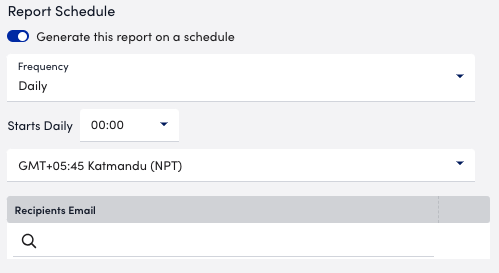
- Do one of the following to save the report:
- Select Save.
The report saves to the Report Group you selected.
If you configured the report to generate on a schedule, the report generates and sends to recipients based on the frequency you configured. - Select Save and Run.
The report saves to the Report Group you selected and generates a report based on the format you configured.
If you configured the report to generate on a schedule, the report generates and sends to recipients based on the frequency you configured.
- Select Save.
Threshold Limtis for Resource Metric Trends Report
Note: For ad-hoc reports, you must select the maximum date range as less than or equal to last month. If you require a date range more than the previous month, you must schedule the required reports.
Adhoc Requests Thresholds (Limit for number of graphs)
| CSV | HTML | |
| 20 | 20 |
Scheduled Requests Thresholds (Limit for number of checkpoints)
| CSV | HTML | |
| 600 | 600 |
Adhoc Requests Thresholds (Limit for number of instances)
| CSV | HTML | |
| 2900 | 500 | 500 |
Scheduled Requests Thresholds (Limit for number of checkpoints)
| CSV | HTML | |
| 32900 | 5000 | 5000 |
