
Disclaimer: This content applies to the legacy UI and is no longer maintained. It will be removed at a future time. For up-to-date content, see Alert Forecast Report. At the time of removal, you will automatically be redirected to the up-to-date content.
Alert Forecast Report
Last updated - 25 July, 2025
Overview
The Alert Forecast report forecasts which datapoints are likely to go into alert within the next 30 days, using the static thresholds that are set for datapoints. It uses predictive analytics to review datapoints’ past trends and plot their future trajectories. To learn more about LogicMonitor’s data forecasting features, see Data Forecasting.
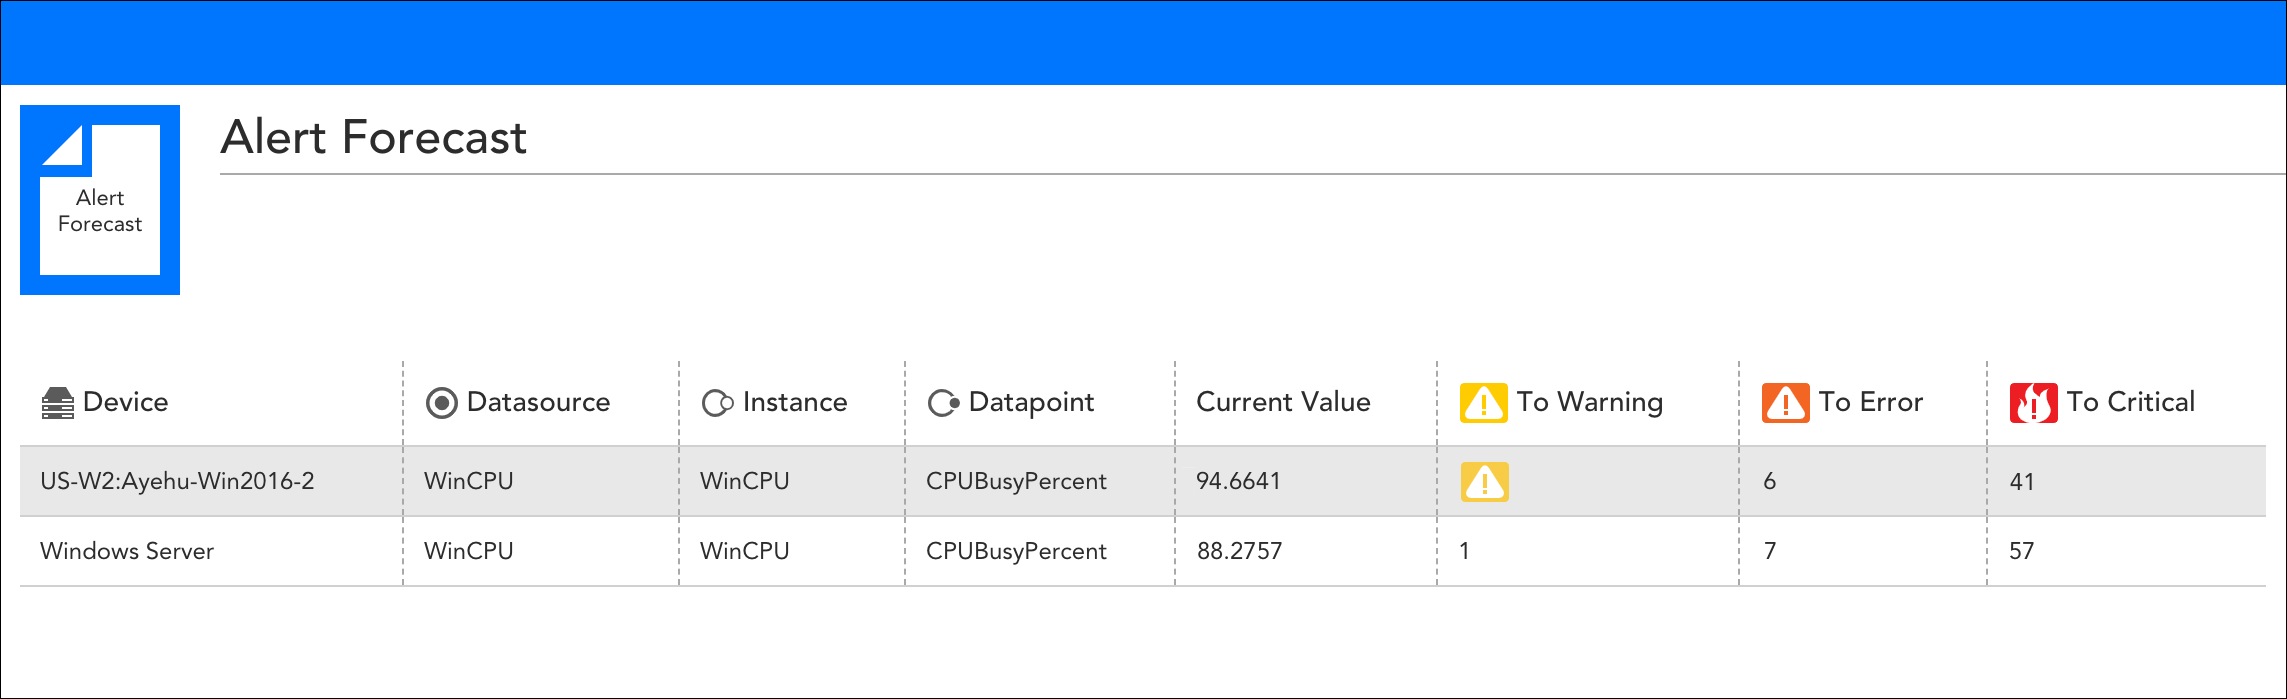
The Alert Forecast report features columns that indicate the number of days until a datapoint is projected to reach warning, error, and critical alert conditions. If a datapoint is currently in alert, as is the case with the first datapoint listed here, the alert severity level icon displays instead.
Configuring an Alert Forecast Report
To configure an Alert Forecast report, select Reports | Add | Report | Alert Forecast Report. A report dialog appears that allows you to configure various report settings.
Configuring Settings Common to All Report Types
The first four settings, along with the final setting, that are found in the report dialog (Title, Description, Group, Format, and Generate this report on a schedule) are universal to all report types. To learn more about these global report settings, see Creating and Managing Reports.
Configuring Alert Forecast Report Settings
In the Alert Forecast Report Settings area of the report configuration dialog, shown and discussed next, specify settings particular to the Alert Forecast report including which datapoints you would like to forecast and the forecast method you would like applied.
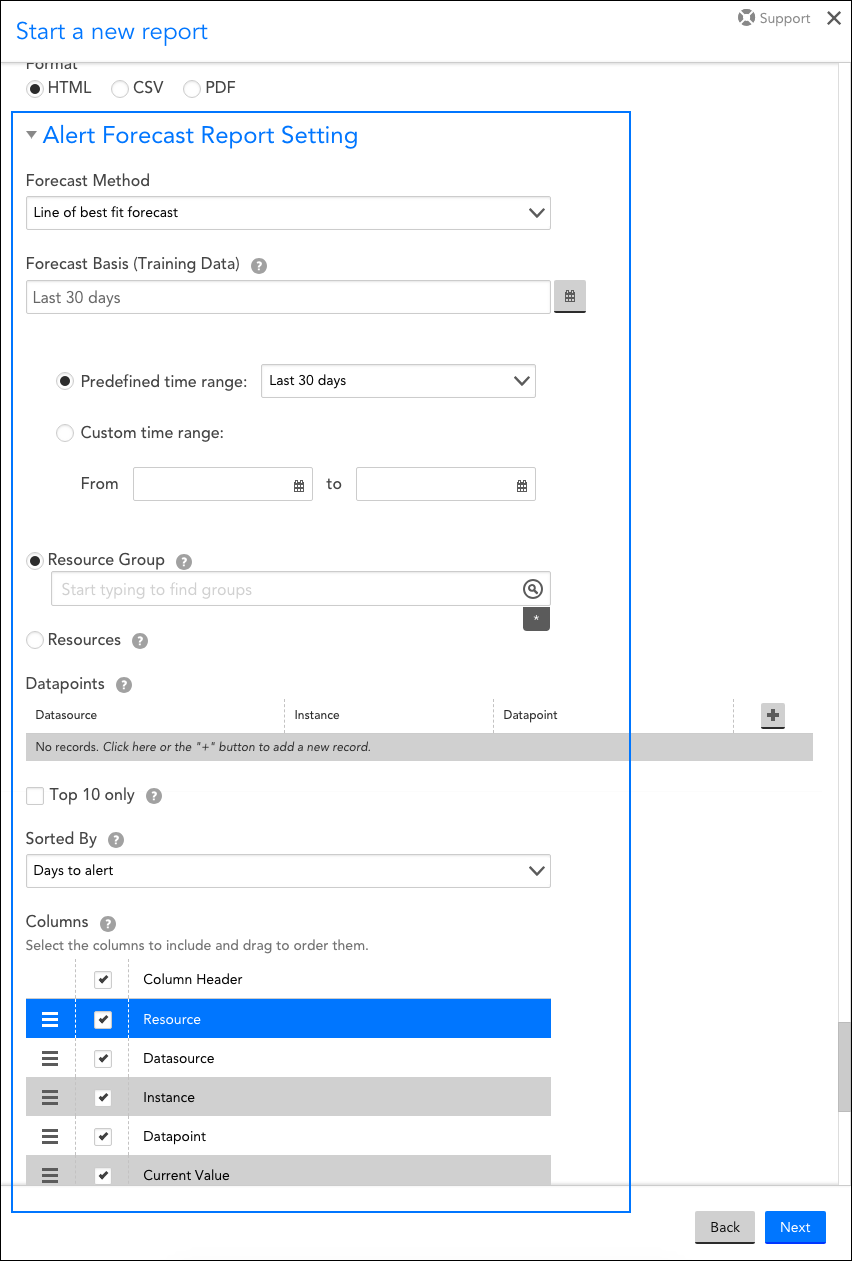
Forecast Method
From the Forecast Method field’s dropdown menu, select from one of two forecast methods:
- Line of best fit forecast
- 95% confidence forecast
For more information on these forecasting methods, see Data Forecasting.
Forecast Basis (Training Data)
In this field, indicate the duration of time from which data will be pulled and analyzed to predict future alerts.
Resource Groups / Resources
From the Resource Groups or Resources field, limit the resources to which this report will apply by designating one or more resource groups or resources. You can use explicit names or glob expressions in these fields.
Note: Multi-glob lookup is available in this field. You can select a combination of both glob and distinct values to specify your resources/resource groups. For more information on LogicMonitor’s support of glob, see Using Glob throughout your account.
Datapoints
From the Datapoints area of the dialog, enter one or more DataSource/instance/datapoint sets to indicate which datapoints you would like included in the report. These datapoints will be pulled only from the resource(s) you specified in the previous field.
Top 10 only
Select the Top 10 only checkbox to limit the report’s results to the top ten datapoints that are closest to alerting.
Sorted By
From the sorted by field’s dropdown menu, select the criteria that should determine the sort order of the report results.
Columns
Uncheck any columns that you would like to exclude from the report. To reorder columns, grab the icon to the far left of a column name and drag and drop the column into its new position.
